Auto Fib SR MT4

Fibonacci ratios are a widely used and proven method for identifying support and resistance levels—both within individual trends and across the entire chart.
However, using the standard MetaTrader Fibonacci tool is often time-consuming and frustrating.

Levels must be positioned manually from wick to wick, and as the trend extends, the tool requires constant re-adjustment to remain accurate.

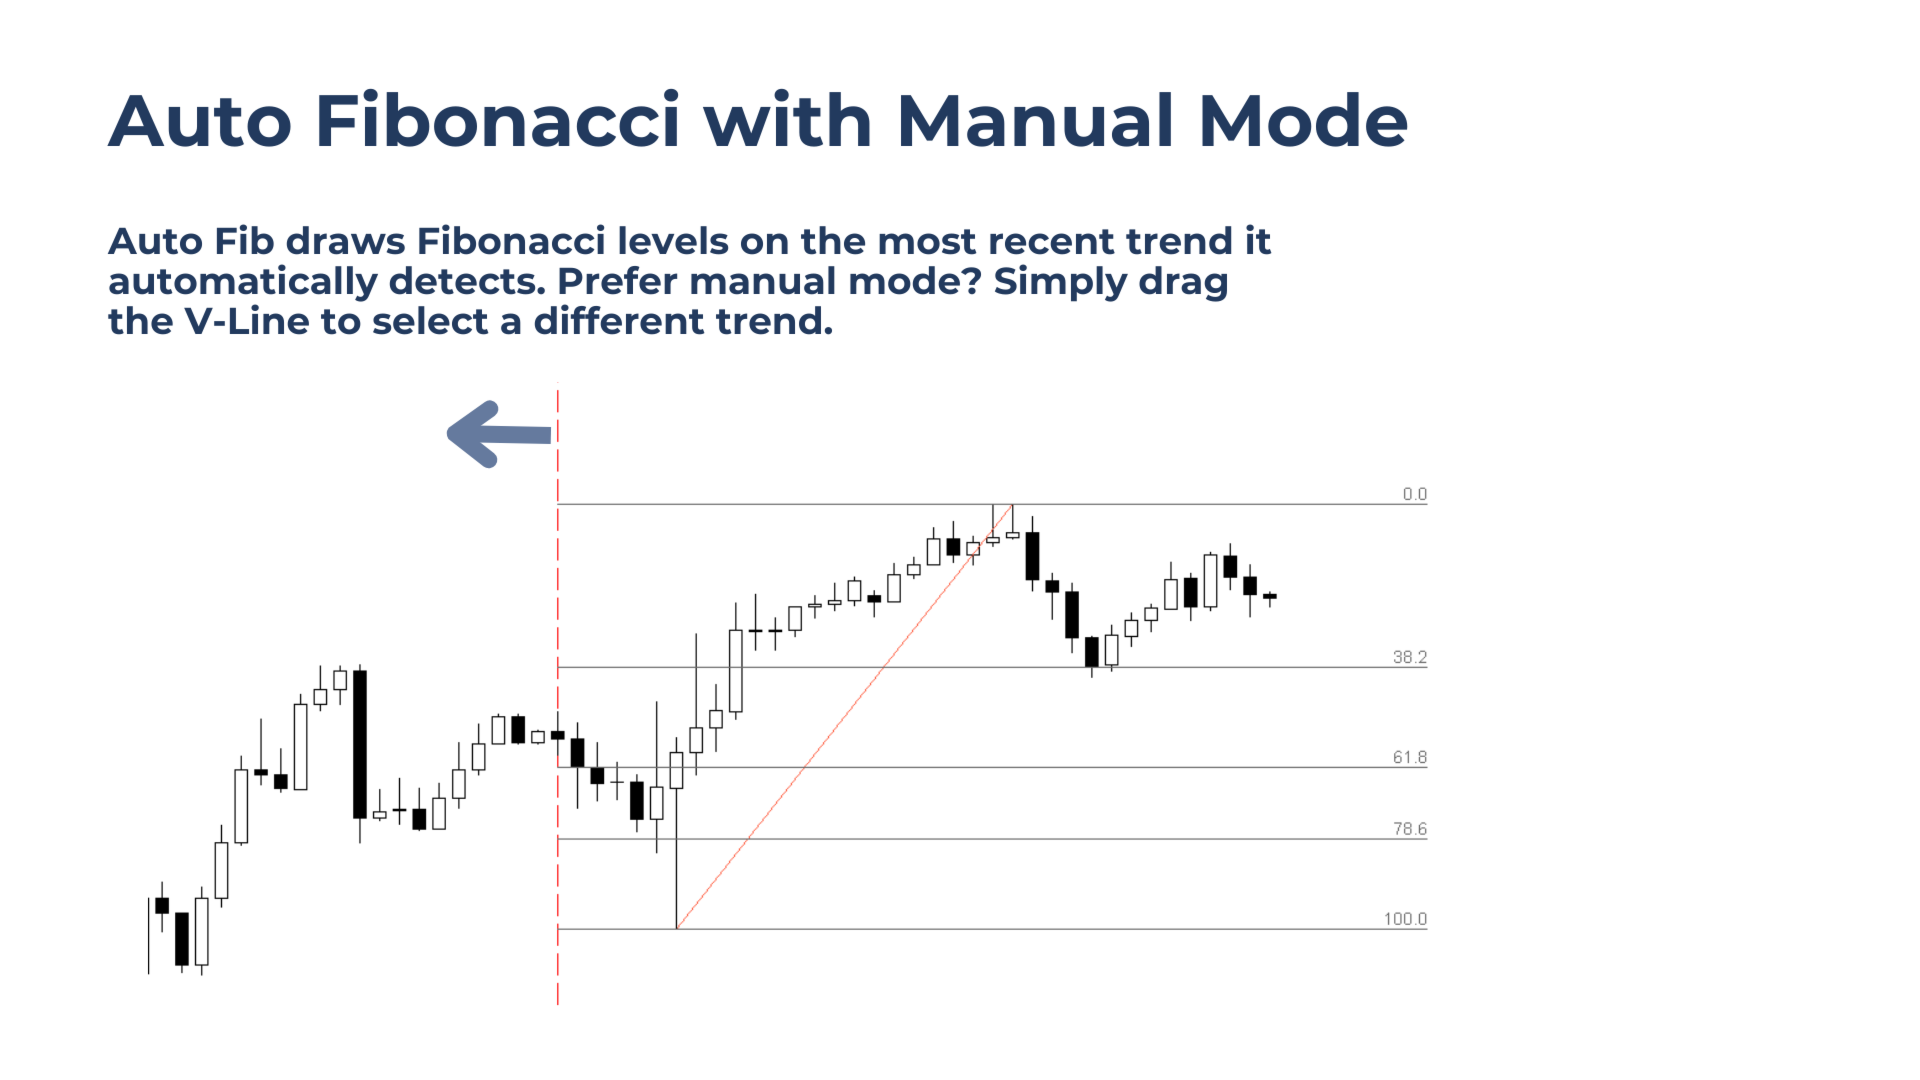
This is where Auto Fib SR comes in. Auto Fib SR automatically draws precise Fibonacci levels on the most recent trend, eliminating the need for repeated manual positioning and adjustment.

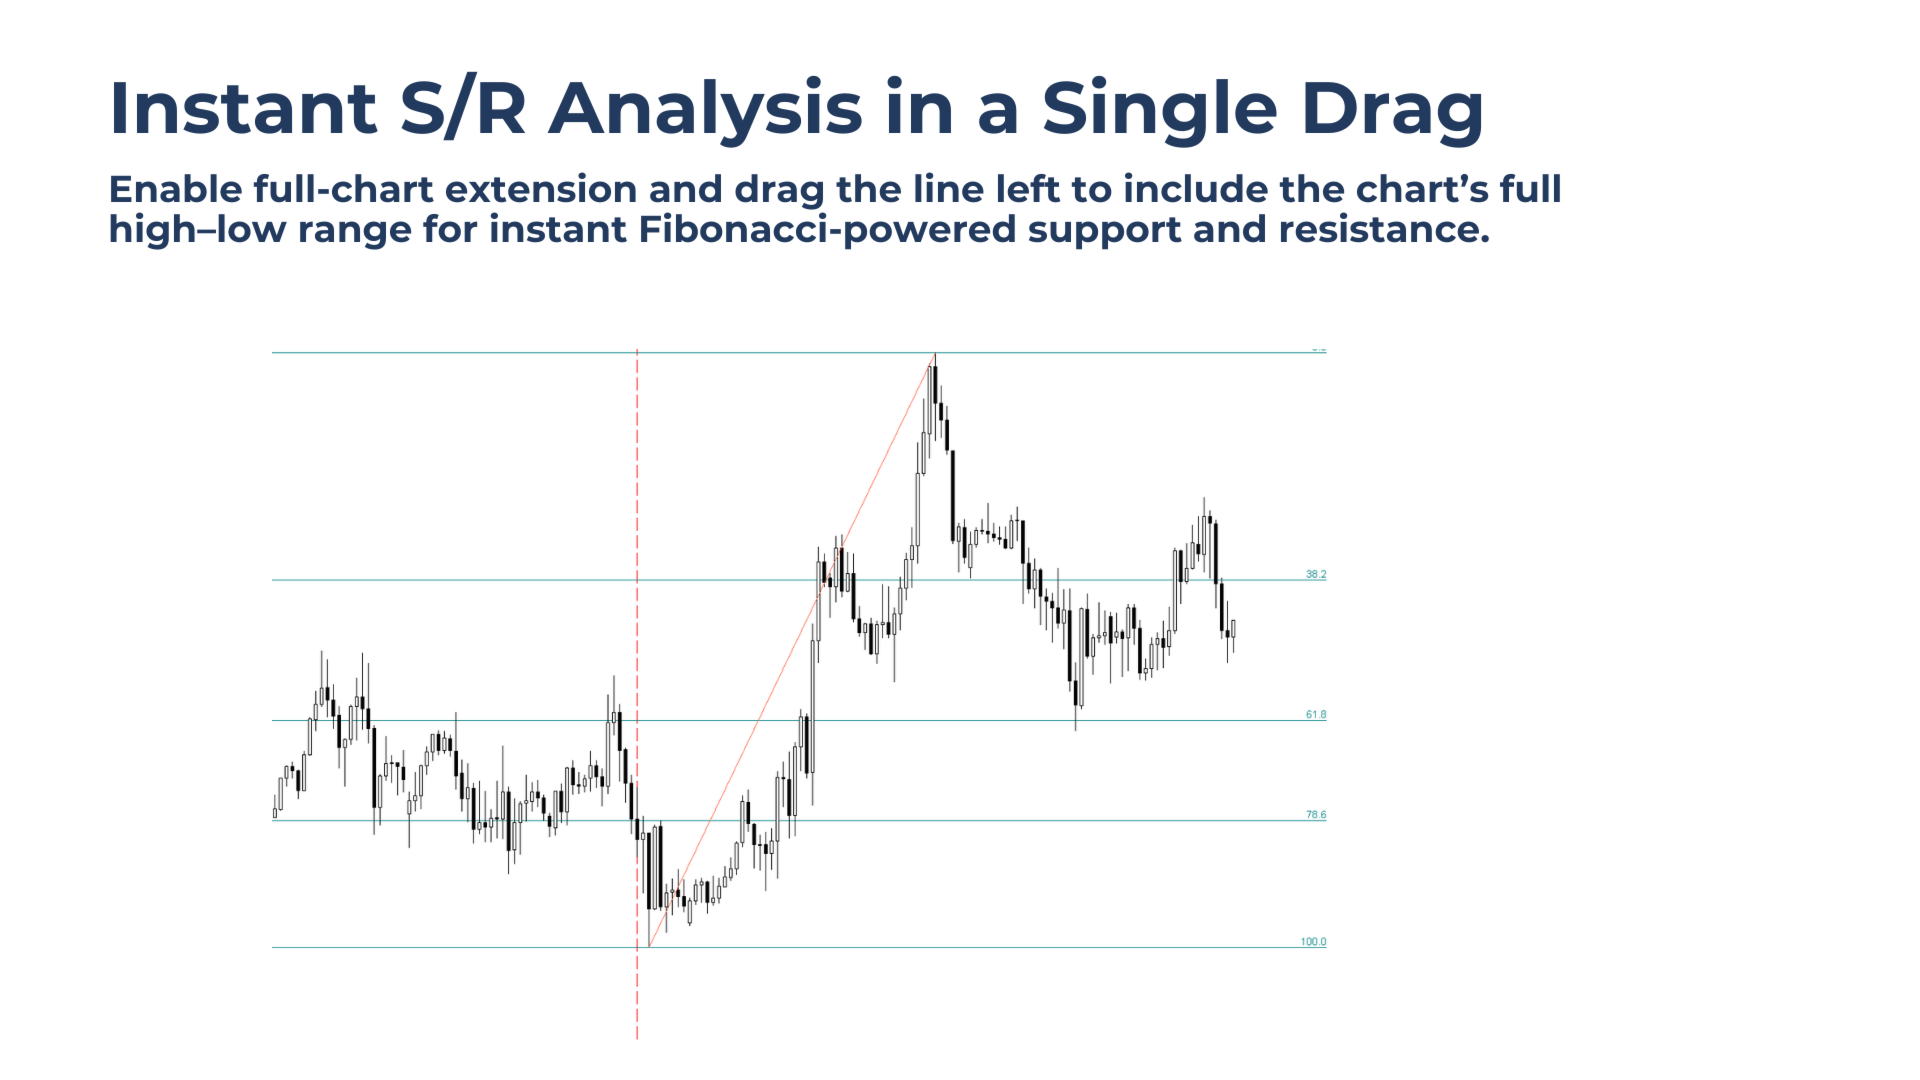
Unlike traditional Auto Fib tools, Auto Fib SR is not locked to a single trend. When analysis is needed on a different price move, the trend can be changed instantly using manual mode with a simple V-Line drag. With full-chart extended levels enabled, Fibonacci ratios can be transformed into a complete chart-wide support and resistance framework, providing higher-level structure and context in seconds.

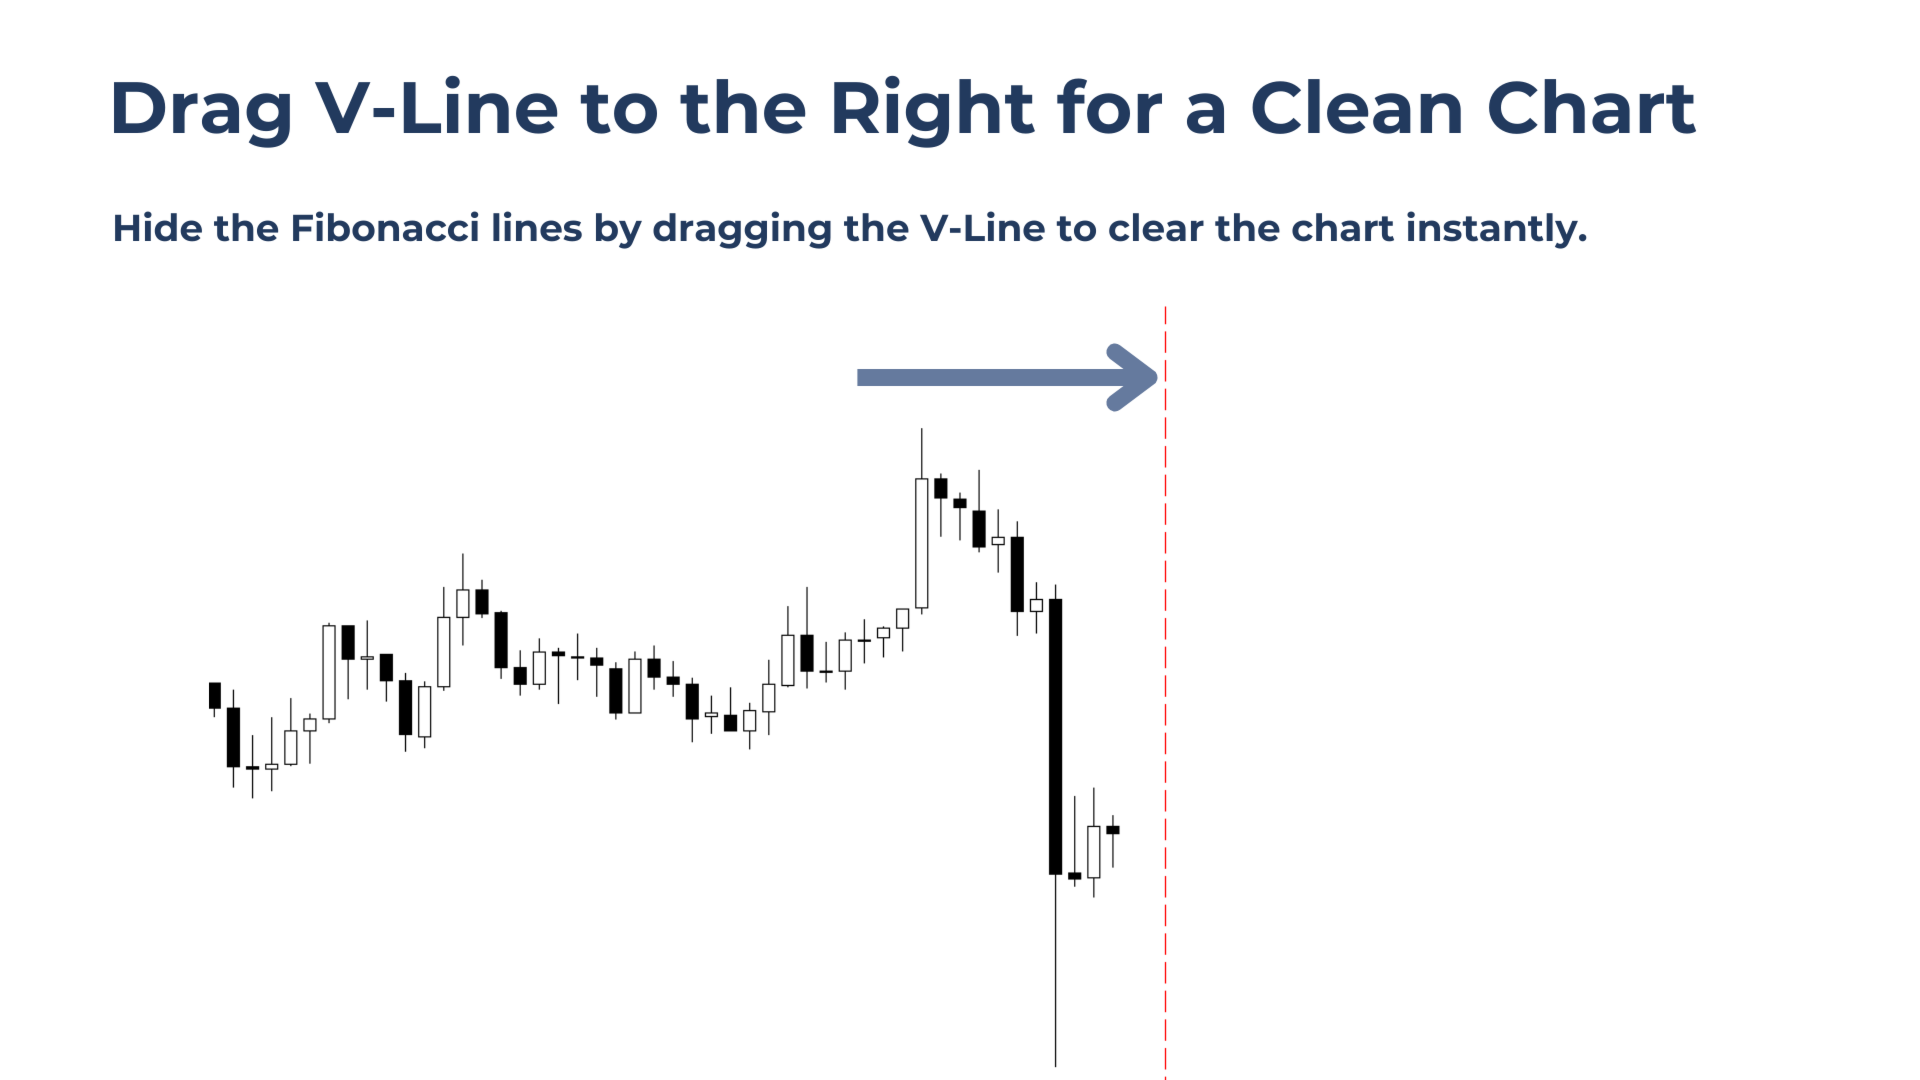
When a clean chart is needed for execution, all levels can be hidden instantly by dragging the V-Line to the right of price, giving full control over both analysis and chart clarity.

Product Update: Auto Fib is now offered as an upgraded paid tool. The current price reflects a temporary launch offer.

Strategy Tester: Auto Fib SR works in the Strategy Tester, but V-Line dragging is disabled. Manual trend selection is available on live charts only.


Who It's For

Auto Fib SR is built for traders who:

  • Rely on Fibonacci retracements but are frustrated by manually positioning and constantly re-adjusting tools as trends extend
  • Want fast, reliable full-chart support and resistance analysis based on Fibonacci theory, using full-width horizontal levels for clear market structure
  • Prefer the peace of mind of a clean chart when it’s time to execute trades, with the ability to hide all Fibonacci levels instantly


    Key Features:

    Automatic trend detection with manual override
    Fibonacci levels are applied automatically to the active trend, removing the need for manual drawing, while manual trend selection via a simple line drag provides full control when analysis is needed on a different move.

    Auto-adjusting Fibonacci levels as trends extend
    Levels update automatically as price extends the trend, eliminating constant re-positioning and ensuring Fibonacci analysis remains accurate in both auto and manual modes.

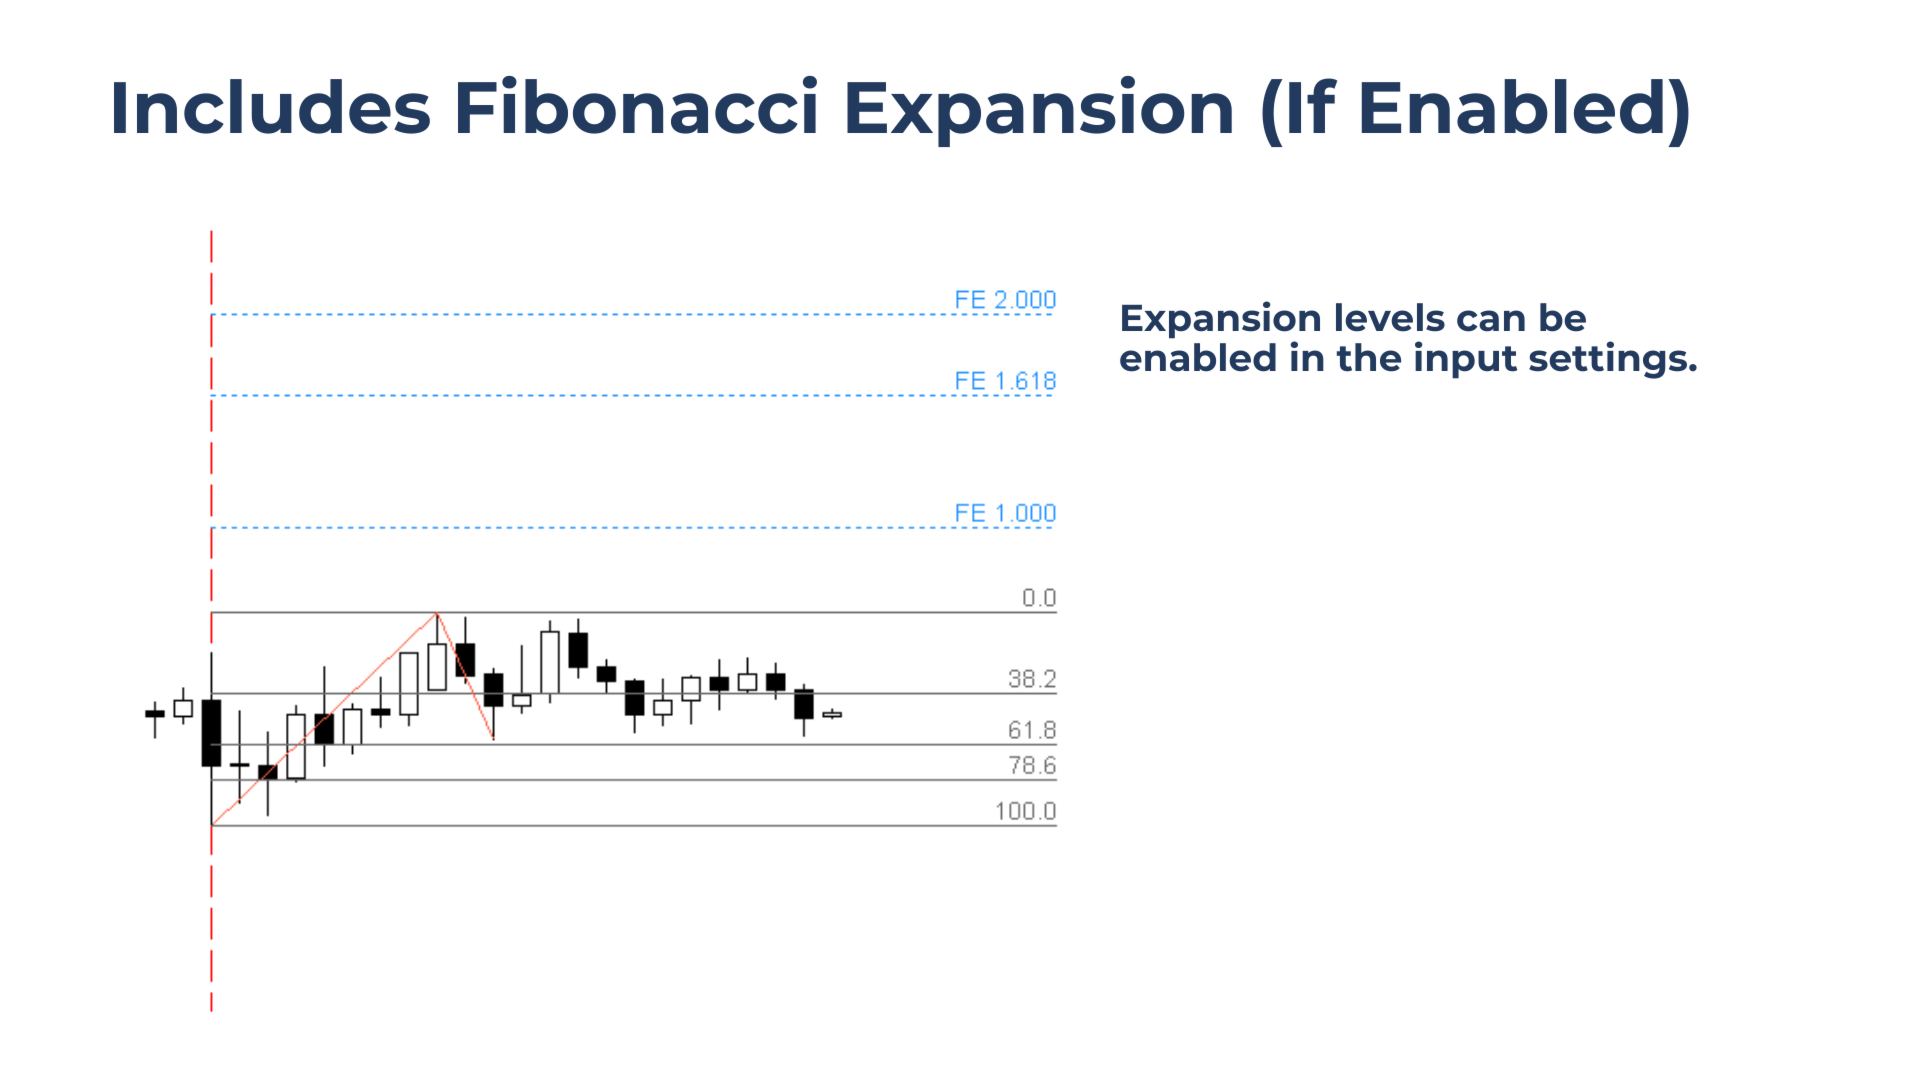
    Fibonacci Expansion levels for target planning
    Optional expansion levels help plan projected targets, measured moves, and continuation areas without adding extra tools to the chart.

    Full-width Fibonacci levels for chart-wide S/R analysis
    Instantly convert Fibonacci levels into a full-chart support and resistance overlay, making higher-timeframe structure and key levels visible at a glance.


    Drag the V-Line To Manually Select A Trend

    By default, Auto Fib SR automatically identifies the most recent trend leg.
    When Fibonacci levels are needed on a different move, simply drag the V-Line to the start of the impulse leg to be measured.

    Note:
    Dragging the V-Line disables Auto Mode. To re-enable Auto Mode, click the Fib Back button.


    Fibonacci Expansion

    The Auto Fibonacci tool now includes Fibonacci Expansion Levels, which can be enabled in the input settings. Perfect for identifying measured-move targets, AB=CD symmetry, trend continuation zones, and institutional projection areas.

    Note:
    Expansion levels are drawn only after price retraces to at least the 0.382 Fibonacci level or deeper, ensuring projections remain as reliable as possible.


    Show/Hide Feature

    Dragging the V-Line to the right of the price action hides all Fibonacci levels. To restore them, simply click the 'Fib Back' button.


    Full-Chart Support & Resistance Levels

    Enabling Full Chart Width in the input settings extends all horizontal Fibonacci levels across the entire chart.

    With this option active, dragging the V-Line instantly transforms Auto Fib SR into a full-chart support and resistance overlay, ideal for higher-level structure analysis.


    推荐产品
    This product is a part of  ON Trade Waves Patterns Harmonic Elliot Wolfe you can test free version on EURJPY from this link  Wolf Waves Indicator 探索 Wolf Waves - 您的终极交易工具! 您是否正在寻找一种强大的工具,能够轻松地在任何时间框架上识别 Wolf Waves?不用再找了!我们的 Wolf Waves 指标可以轻松完成这项任务。以下是为您呈现它的理由: 主要特点: 自动检测: 我们的 Wolf Waves 指标使用复杂的算法自动查找关键点并在您的图表上绘制相应的线条。不再需要手动搜索模式。 用户友好: 无论您是专业交易员还是对 Wolf Waves 还不熟悉,我们的指标都非常易于使用。 精准性: 它非常精确,降低了虚假信号的数量,提高了您的信心。 信息丰富: 该指标不仅限于模式检测。它还提供入场点、止损水平和利润目标等重要交易信息,帮助您做出明智的交易决策。 适用于 EA: 如果您进行自动化交易,此指标可以无缝集成到您
    KT Auto Trendline MT4
    KEENBASE SOFTWARE SOLUTIONS
    KT Auto Trendline draws the upper and lower trendlines automatically using the last two significant swing highs/lows. Trendline anchor points are found by plotting the ZigZag over X number of bars. Features No guesswork requires. It instantly draws the notable trendlines without any uncertainty. Each trendline is extended with its corresponding rays, which helps determine the area of breakout/reversal. It can draw two separate upper and lower trendlines simultaneously. It works on all timeframe
    每日趋势黄牛 (DTS) 该指标是 RPTrade Pro Solutions 系统的一部分。 DTS 是使用价格行为、动态支撑和阻力的每日趋势指标。 它旨在供任何人使用,即使是绝对的交易初学者也可以使用它。 从不重新粉刷。 指示是从接近到接近给出的。 设计为单独使用,无需其他指标。 在一天开始时为您提供趋势和潜在的获利。 它是如何工作的 DTS 正在使用结合价格行为和动态支撑和阻力的突破策略。 分析夜间趋势和波动性以在第二天使用。 通过该分析确定突破限制(蓝色和深橙色线)以及止盈 由于历史数据,可以立即检查策略和设置的“成功”。 历史部分允许立即查看策略中是否存在任何“漏洞”,并最终选择另一个更适合的时间框架或符号。 实时从蜡烛收盘到蜡烛收盘,趋势指标等待信号条件有效,然后通过箭头显示(绿色表示买入,橙色表示卖出)。 红色点划线显示了止盈和最终止损的位置。 交易是一一指示的,永远不会同时进行两笔交易。 大多数交易(80%)在白天完成。 DTS 表示: 对于购物车上所有选定的符号: 在哪里打开您的交易。 获利和止损。 可以捕获的潜在点数。 DTS 作品 如果报价是隔夜提
    BONUS INDICATOR HERE :  https://linktr.ee/ARFXTools Trading Flow Using Fibo Eminence Signal 1️⃣ Wait for the Fibonacci to Auto-Draw The system automatically detects swings (from high to low or vice versa) Once the Fibonacci levels appear, the indicator sends an alert notification “Fibonacci detected! Zone is ready.” 2️⃣ Check the Entry Zone Look at the ENTRY LINE (blue zone) This is the recommended SELL entry area (if the Fibonacci is drawn from top to bottom) Wait for the price to enter
    Every successful trader knows what support and resistance spots are working. And always know that these points need to be kept in mind. They always trade according to this point. The support and resistance point indicator operates in two different modes. The first is the standard support and resistance points we know. The second is Fibonacci levels. This indicator automatically calculates and displays the support and resistance points on the screen. Features You can select the time frame you wa
    Trendlines Chart Patterns Indicator (MT4) Automated Chart Patterns & Breakout Signals for MT4: Trade with Precision! The "Trendlines Chart Patterns Indicator" is an advanced trading tool for MetaTrader 4 (MT4) , meticulously designed to identify high-probability buy and sell signals based on dynamically forming, robust trend lines and popular chart patterns . This powerful forex indicator automates the complex process of identifying patterns like triangles, flags, ranges, ascending/descending tr
    SMC Venom 模型 BPR 指標是針對在智慧貨幣 (SMC) 概念內工作的交易者的專業工具。它會自動辨識價格圖表上的兩種關鍵模式: FVG (公平價值缺口)是三根蠟燭的組合,其中第一根和第三根蠟燭之間存在缺口。它在水平之間形成一個沒有成交量支撐的區域,這通常會導致價格調整。 BPR (平衡價格區間)是兩種 FVG 模式的組合,形成一個「橋樑」 - 當價格以低成交量活動移動時,突破並返回到水平的區域,從而在蠟燭之間產生間隙。 這些模式可協助交易者透過分析圖表上的交易量和價格動態(大型市場參與者和普通參與者之間的互動)來識別關鍵的支撐/阻力位、突破區域和切入點。 此指標以矩形和箭頭的形式可視化模式,也支援靈活的警報設定。 主要特點: 模式顯示模式:選擇顯示 BPR 模式(看漲和看跌)或 FVG 模式(看漲和看跌)。 可以隱藏所有圖表分析模式。 以條數過濾:BPR 結構中 FVG 之間的最小/最大距離。 訊號的附加視覺化: 箭頭有 9 種類型可供選擇(標準、細、分形等)或手動輸入 Wingdings 代碼,其表格可以選擇性地顯示在圖表上。 使用 ATR 配置顏色、尺寸及其相對於價格
    Round Levels mp
    DMITRII GRIDASOV
    适用于 MT4 的外汇指标“整数位”。 - 对于考虑支撑位/阻力位的交易者来说,“整数位”指标是必备的辅助指标。 - 价格非常依赖整数位——价格经常从整数位反弹。 - 对于 4 小时和 1 天的时间框架,步长为 1000 点。 - 对于 1 小时及更短的时间框架(用于日内交易),步长为 500 点。 - 整数位也非常适合配置止盈(位于整数位之前)和止损(位于整数位之后)。 - 这些水平线非常强劲,尤其是在价格横盘整理和平盘期间。 ................................................................................................................. // 优秀的交易机器人和指标可在此处获取: https://www.mql5.com/en/users/def1380/seller 这是仅在 MQL5 网站上提供的原创产品。
    Royal Dutch Skunk
    Sayan Vandenhout
    ROYAL DUTCH SKUNK USES THE TREND WAVE INDICATOR AND IT CAN IDENTIFY THE BEGINNING AND THE END OF A NEW WAVE TREND MOVEMENT. AS AN OSCILLATOR, THE INDICATOR IDENTIFIES THE OVERBOUGHT AND OVERSOLD ZONES. IT WORKS GREAT TO CATCH THE SHORT TERM PRICE REVERSALS AND USES A MARTINGALE STRATEGY TO CLOSE ALL TRADES IN PROFIT. USE DEFAULT SETTINGS ON H1 OR HIGHER TIME FRAME ON ANY PAIR FOR MORE ACCURATE TRADES WHY THIS EA : Smart entries calculated by 6 great strategies The EA can be run on even a $20000
    Edge Finder 10
    Hassan Al-banna Ahmed Mohamed Ahmed Abdullah
    (Strikingly Simple, Powerfully Profitable) Edge Finder i s your all-in-one visual trading assistant, designed to cut through the market noise and highlight high-probability trading opportunities at a glance. How It Works (The Core Idea): Instead of overloading your chart with complex numbers,  Edge Finder uses a unique, color-coded system to paint the market picture clearly. Trend & Momentum Visualization:  The indicator analyzes the market and dynamically colors the price bars. Specific colors
    DayNight moving averages along with support and resistance make a remarkable difference if properly utilized This indicator detects trade direction and sends notification to your mobile phone so that you can  enter/exit a trade without having to be seated in front of desktop computer all day and night. Although you have to execute/send an order yourself, you can setup rules through the setting made available for proper lots size base on the available balance/fund you are trading with. The opport
    EARLY REMINDER: The Starting price is 65 price will rise soon up to 365$ and then 750$ after first 10 copies of sales. Grab this offer now! Introduction Hello, traders! Welcome to the demonstration of the Forex Beast Indicator , a comprehensive tool designed to assist aspiring traders in navigating the complexities of the forex market. This indicator incorporates seven essential components to provide a well-rounded trading experience: Moving Averages Colored Zones Support and Resistance Levels
    这是一个预测蜡烛收盘价的指标。 该指标主要用于 D1 图表。 该指标适用于传统外汇交易和二元期权交易。 该指标可以用作独立的交易系统,也可以作为您现有交易系统的补充。 该指标分析当前蜡烛,计算蜡烛本身内部的某些强度因素,以及前一根蜡烛的参数。 因此,该指标预测市场走势的进一步方向和当前蜡烛的收盘价。 由于这种方法,该指标既适用于短期盘中交易,也适用于中长期交易。 该指标允许您设置指标在分析市场情况期间将产生的潜在信号的数量。 在指标设置中有一个特殊的参数。 此外,该指标可以通过图表上的消息、电子邮件以及推送通知的形式通知新信号。感谢您的关注!交易愉快! 购买后一定要写信给我! 我会给你我的交易指标的建议! 还可以获得奖金!
    Auto Fibo mw
    DMITRII GRIDASOV
    “Auto FIBO” Crypto_Forex 指标 - 是一款出色的交易辅助工具! - 指标自动计算并绘制斐波那契水平线和局部趋势线(红色)。 - 斐波那契水平线指示价格可能反转的关键区域。 - 最重要的水平线是 23.6%、38.2%、50% 和 61.8%。 - 您可以将其用于反转剥头皮交易或区域网格交易。 - 您还可以使用 Auto FIBO 指标来改进您当前的系统。 ................................................................................................................. 点击这里查看高质量的交易机器人和指标! 这是仅在 MQL5 网站上提供的原创产品。
    晨星 PRT 指標採用早盤持平突破原理。此指標顯示早晨持平水平並顯示可能的目標。 指標中增加了額外的斐波那契水平,以及有關設定中指定的目標水平與夜間持平水平相交的聲音警報。 晨星 PRT 指標在夜間結束時建造了一個夜間平坦通道,以及兩個向上和向下的斐波那契價格水準。這些水平可以被視為目標水平和逆轉水平。 晨星 PRT 指標適用於所有時間範圍,但在 M15 間隔上使用它最有效。 The Morning Star PRT indicator uses the morning flat breakout principle. The indicator displays morning flat levels and shows possible targets. An additional Fibonacci level has been added to the indicator, as well as sound alerts about the intersection of both target levels specified in the settings and
    Fibonaccitools
    Aymn Sʿyd Ahmd Hsn Alkwmy
    斐波那契回撤是交易者可以用來繪製支撐線、確定阻力位、下止損單和設定目標價格的流行工具。 斐波納契回撤是通過在股票圖表上取兩個極值點並將垂直距離除以關鍵斐波納契比率 23.6%、38.2%、50%、61.8% 和 100% 來創建的。 斐波那契工具指標將繪製斐波納契工具,例如 回撤、弧線、扇形、擴張、時區。 基於鋸齒形指標" 斐波那契回撤是交易者可以用來繪製支撐線、確定阻力位、下止損單和設定目標價格的流行工具。 斐波納契回撤是通過在股票圖表上取兩個極值點並將垂直距離除以關鍵斐波納契比率 23.6%、38.2%、50%、61.8% 和 100% 來創建的。 斐波那契工具指標將繪製斐波納契工具,例如 回撤、弧線、扇形、擴張、時區。 基於鋸齒形指標"
    Auto Fibo Pro m
    DMITRII GRIDASOV
    “Auto FIBO Pro” Crypto_Forex 指标 - 是交易中的绝佳辅助工具! - 指标自动计算并放置在图表斐波那契水平和局部趋势线(红色)上。 - 斐波那契水平指示价格可能反转的关键区域。 - 最重要的水平是 23.6%、38.2%、50% 和 61.8%。 - 您可以将其用于反转剥头皮或区域网格交易。 - 还有很多机会可以使用 Auto FIBO Pro 指标来改进您当前的系统。 - 它具有信息价差掉期显示 - 它显示所连接的外汇对的当前价差和掉期。 - 显示屏还显示账户余额、净值和保证金。 - 可以将信息价差掉期显示定位在图表的任何角落: 0 - 左上角,1 - 右上角,2 - 左下角,3 - 右下角。 点击这里查看高质量的交易机器人和指标! 这是仅在此 MQL5 网站上提供的原创产品。
    智能供需区域查找器是一款功能强大的 MetaTrader 4 指标,可自动识别并显示任何交易资产的供需区域。它旨在简化您的交易流程,消除了寻找关键水平的猜测,节省您的时间并增强您的信心。 主要功能 自动区域检测:识别任何资产(外汇、股票、商品、加密货币)和时间范围(M1 至 MN)的供需区域。 视觉清晰度:将区域绘制为彩色编码矩形,并带有标签,显示类型、强度和点值。 实时警报:当价格进入某个区域时,通过电子邮件、推送通知、弹出窗口或声音接收通知。 区域大小信息:以点值显示区域大小,以便更好地评估风险回报。 用户友好设置:配置分析深度(BackLimit)。 区域类型和含义 未经测试:价格尚未回落的新区域,非常适合高概率反转。 已验证:区域已多次测试,表明强劲支撑或阻力。 已翻转:区域已切换角色(例如,从供给到需求),预示着反转。 通知系统 电子邮件提醒:价格进入某个区域时,即时发送电子邮件提醒,内容包括资产、时间范围和区域类型(例如,“EURUSD-H1:[需求] 区域已进入”)。 推送通知和声音:即使远离图表也能随时了解最新信息。 可自定义提醒:启用/禁用提醒并设置等待时
    Night ghost
    Dmitriy Kashevich
    Night Ghost - Arrow indicator for binary options. This is a reliable assistant to you in the future! - No redrawing on the chart -Works great on EUR/USD currency pairs! -Indicator accuracy up to 90% (Especially at night) -No long setup required (Perfectly set up for Binary Options) - Not late signals - The appearance of a signal on the current candle -Perfect for M1 period (No More!) - Eye-friendly candle color (Red and Blue) -Installed Alert Working with it: - Blue arrow shows signa
    Fibonacci Auto Drawing
    Makarii Gubaydullin
    根据指定时间范围内的最高价和最低价自动绘制斐波那契水平 多个K线   可以合并:例如,您可以基于10天的最高价和最低价绘制斐波那契水平 我的   #1   工具 : 66+ 功能,包括此指标  |   联系我  如有任何问题  |    MT5版本 帮助识别潜在的反转水平; 在斐波那契水平形成的形态往往更强; 显著   减少   手动绘制   所花费的   时间 ; 设置: 计算基准最高价和最低价的时间范围 计算基准价格的周期数量  当前(浮动)K线可以包含/排除 每个级别可以自定义或禁用(设置为0以关闭) 您还可以禁用整个级别组:分别为主要级别、向上和向下扩展 线条颜色、样式和粗细  可以启用/禁用水位价格 //--------- 我的   #1   工具 : 66+ 功能,包括此指标  |   联系我  如有任何问题  |    MT4版本
    PZ ABCD Retracement
    PZ TRADING SLU
    4 (5)
    该指标找到AB = CD回撤形态。 AB = CD回调模式是一种4点价格结构,其中初始价格区间被部分回调,然后与回调完成后等距移动,这是所有谐波模式的基本基础。 [ 安装指南 | 更新指南 | 故障排除 | 常见问题 | 所有产品 ] 可定制的图案尺寸 可定制的AC和BD比率 可定制的突破时间 可定制的线条,颜色和大小 它根据CD纤维水平显示SL和TP水平 视觉/声音/推送/邮件警报,用于模式和突破 AB = CD Retracements可以扩展和重新绘制很多内容。为了使事情变得更容易,该指标实施了一个转折:它在向交易发出信号之前等待正确方向的Donchian突破。最终结果是带有非常可靠的交易信号的重新粉刷指示器。输入donchian突破时段作为输入。 看涨回撤是蓝色的 空头回撤是红色的 请注意,价格模式(例如AB = CD)可以扩展,指标必须重新绘制以跟随该模式的扩展。如果图案重涂超出了参数中输入的AC / BD / AB = CD比率,则该图案将消失,因为它将不再有效。要交易这些模式,请求助于donchian突破信号。 输入参数 幅度:AB = CD模式的大小 突围
    “戰略剝頭皮”指標在圖表上顯示可能的趨勢反轉點。 該指標突出顯示兩個不同的樞軸點:高點(上方的樞軸點)和低點(下方的樞軸點)。 上樞軸點由向下箭頭指示,當價格達到高位並開始下跌時會出現在圖表上。 當價格觸底並開始上漲時,樞軸低點由向上的箭頭指示並出現在圖表上。 該指標對於正在市場中尋找進入點和退出點的交易者很有用。 它可以幫助交易者識別價格達到極端的時刻並發出可能的趨勢逆轉信號。 該指標可以針對不同的時間間隔和工具進行配置。 它還可以輔以其他指標和交易策略以獲得更準確的信號。 此外,該指標還可以與其他指標和市場分析結合使用,以提高交易效率。 它可以幫助交易者在市場上看到更多的獲利機會,避免潛在的損失。 指標設置: period_signal - 指標週期。 UpperBorder - 市場超買的上邊界,用於賣出信號。 LowerBorder - 市場超賣的下邊界,用於買入信號。 寬度 - 指標在圖表上繪製的箭頭的大小。
    斐波那契折返和扩展画线工具 适用于MT4平台的斐波那契折返和扩展画线工具,适合于使用黄金分割交易的交易者 优点:没有多余的线,没有过长的线,易于观察发现交易的机会 试用版: https://www.mql5.com/zh/market/product/35884 主要功能: 1.可以直接画出多组斐波那契折返,可以看出重要折返点之间的关系; 2.可以画出斐波那契扩展,比率有三种0.618,1,1.618 3.画出的斐波那契折返和扩展均可左右移动,有数值显示,方便观察 4.可通过数字键切换周期 使用指南和功能键: 1.按 [ 或R画折返,按需要画折返,最多云持8组折返; 2.按 ] 或E画扩展; 3.按 \ 删除当前周期下的所有扩展和折返,其余周期的不受影响 4.如何左右移动折返和扩展 (1)点击第一组折返的F5字符,可以左右移动折返; (2)点击COP的字符 ,可以左右移动扩展; 5. (1)点击第一组折返的F5字符,按del 可以删除这组折返; (2)点击COP的字符, 按del 可以删除这组扩展; 6.修改折返和扩展(随着市场的运行,焦点或者反弹点需要修改)
    AI Signal
    Thomas Bradley Butler
    AI Signal is an indicator that is a ready to made scalping system that doesn't repaint Instructions: Load indicator.  Use arrows as entries in trends and stay out of sideways markets.  Trade with the larger trend and trade only active volatile hours Buy blue arrow above yellow and exit at red arrow or at discretion.  Sell red arrow below yellow and exit at blue arrow  or at discretion.  Easy to follow and is based on trends.  The indicator works on all time frames and assets. Use at your own d
    VR Cub
    Vladimir Pastushak
    VR Cub 这是获得高质量切入点的指标。该指标的开发是为了促进数学计算并简化对仓位入场点的搜索。多年来,该指标所针对的交易策略已被证明其有效性。交易策略的简单性是其巨大的优势,即使是新手交易者也能成功进行交易。 VR Cub 计算开仓点以及获利和止损目标水平,这显着提高了效率和易用性。查看使用以下策略进行交易的屏幕截图,了解简单的交易规则。 设置、设置文件、演示版本、说明、问题解决,可以从以下位置获取 [博客] 您可以在以下位置阅读或撰写评论 [关联] 版本为 [MetaTrader 5] 计算入场点的规则 开仓 要计算入场点,您需要将 VR Cub 工具从最后一个高点拉伸到最后一个低点。 如果第一个点在时间上早于第二个点,交易者等待柱线收于中线上方。 如果第一个点在时间上晚于第二个点,交易者等待柱线收于中线下方。 根据上述条件,严格在 柱线收盘 后建仓。 换句话说,如果我们在小时图上进行交易,那么从最高点到最低点的时间距离必须超过24小时,最高点和最低点之间的点数必须大于或等于平均价格变动每天。 维持和改变市场地位 可以有多个未平仓头寸;每个头寸都可以单独修改。 VR Cub
    Back to the Future is a trend indicator. It consists of four parts. 1. Part is the fibo levels that define the minimum and maximum targets. 2. This is a target level that defines the minimum correction targets and trend targets. 3. Dynamic levels correction targets and trend targets.. 4. Trend levels based on trend lines. All parts are included in the indicator menu. the indicator Back to the Future does not repaint. The change of information comes after the calculation of the last 3 bars.
    Royal Wave Pro M4
    Vahidreza Heidar Gholami
    5 (3)
    Royal Wave is a Trend-Power oscillator which has been programmed to locate and signal low-risk entry and exit zones. Its core algorithm statistically analyzes the market and generates trading signals for overbought, oversold and low volatile areas. By using a well-designed alerting system, this indicator makes it easier to make proper decisions regarding where to enter and where to exit trades. Features Trend-Power Algorithm Low risk Entry Zones and Exit Zones Predictions for Overbought and Over
    This indicator was created to detect possible changes in direction of the market. Inside bars points to a certain level of indecision coming into the market. Neither side, buyers and sellers, have been able to push the price further up or down resulting in indecision. We can use this indicator to monitor for inside bar setups and having the indicator signaling the setup to the trader by alert, notification, it provides the trader with a starting point for his/her trading plan. The validation for
    Super support and resistance
    Peter Francois J Thijs
    This support and resistance indicator gives u a)support level b)resistance level c)direction(trend) all in one.The indicator is based on the top 3 best levels there are!Red dots are sell direction and green dots are buy direction,if candles dont break these levels u get in after the 3rd dot,always use higher time frames from h1 up so its more clear where direction is going,also u can set the indicator to your time frame that u are lookin at.
    This is the FXTraderariel-TakeProfit - Stop Loss Indicator . It provides you 3 potential Take Profits and 1 Stop Loss. These potential targets are computed based on several methods . The indicator can be used on every time frame, but we advise to use it on H1, H4 and D1. Especially if you are a novice trader. Pro Traders can also you use it for scalping in smaller time frames (M1, M5 and M15). This indicator is not a complete trading system. It doesn't provide you a Signal nor can predict the m
    该产品的买家也购买
    Gann Made Easy
    Oleg Rodin
    4.82 (148)
    Gann Made Easy 是一个专业且易于使用的外汇交易系统,它基于使用先生理论的最佳交易原则。 W.D.江恩。该指标提供准确的买入和卖出信号,包括止损和获利水平。您甚至可以使用推送通知在旅途中进行交易。 购买后请联系我,免费获取交易提示、奖金和 GANN MADE EASY EA 助手! 您可能已经多次听说过江恩交易方法。通常 Gann 的理论不仅对于新手交易者而且对于那些已经有一定交易经验的人来说都是非常复杂的东西。这是因为江恩的交易方法在理论上并不那么容易应用。我花了几年时间来完善这些知识,并将最好的原则应用到我的外汇指标中。 该指标非常易于应用。您所需要的只是将其附加到您的图表并遵循简单的交易建议。该指标不断进行市场分析工作并寻找交易机会。当它检测到一个好的入口点时,它会为您提供一个箭头信号。该指标还显示止损和获利水平。 换句话说,当您像先生一样进行交易时,该指标会为您提供最佳江恩建议。江恩亲自告诉你此时此刻该做什么。但最好的部分是您不需要了解任何有关江恩交易原则的知识,因为该指标会为您完成整个市场分析工作。
    M1 Sniper
    Oleg Rodin
    4.89 (18)
    M1 SNIPER 是一款易于使用的交易指标系统。它是一个专为 M1 时间框架设计的箭头指标。该指标可以作为独立的系统在 M1 时间框架下进行剥头皮交易,也可以作为您现有交易系统的一部分使用。虽然该交易系统专为 M1 时间框架交易而设计,但它也可以用于其他时间框架。我最初设计此方法是为了交易 XAUUSD 和 BTCUSD。但我发现这种方法在其他市场交易中也同样有用。 指标信号既可以顺势交易,也可以逆势交易。我教授一种特殊的交易技巧,帮助您利用指标信号进行双向交易。该方法基于使用特殊的动态支撑位和阻力位区域。 购买后,您可以立即下载 M1 SNIPER 箭头指标。此外,我还为所有 M1 SNIPER 工具用户免费提供下方屏幕截图所示的 Apollo Dynamic SR 指标!这两个指标的组合可以帮助您更轻松、更准确地利用 M1 时间框架进行交易。 购买后请联系我,免费获取交易提示和奖励指标! 祝您交易成功!
    Game Changer Indicator
    Vasiliy Strukov
    5 (7)
    Game Changer 是一款革命性的趋势指标,适用于任何金融工具,可将您的 MetaTrader 平台升级为强大的趋势分析工具。该指标不会重绘,也不会出现滞后。它适用于任何时间范围,有助于识别趋势,发出潜在反转信号,可用作追踪止损机制,并提供实时警报,以便您快速做出市场反应。无论您是经验丰富的交易员、专业人士,还是寻求优势的初学者,这款工具都能帮助您自信、自律地进行交易,并清晰地了解潜在的趋势动态。 购买后立即联系我,即可获得个人奖励!您可以免费获得我们的强力支撑和趋势扫描指标,请私信我! 请注意,我不在 Telegram 上出售我的 EA 或特殊套件,它们仅适用于 MQL5,我的套件文件也仅在我的博客上提供。 请小心诈骗者 ,不要从其他人那里购买任何套件! 设置 启用趋势变化警报 - 真/假 - 趋势变化时在图表上显示警报 发送推送通知 - 真/假 - 启用手机推送警报通知 发送邮件通知 - 真/假 - 发送趋势变化的邮件通知到电子邮件
    Meravith
    Ivan Stefanov
    5 (1)
    该指标从每个点分析成交量,并计算该成交量的市场疲劳水平。 它由三条线组成: 牛市成交量疲劳线 熊市成交量疲劳线 表示市场趋势的线。该线根据市场是熊市还是牛市变化颜色。 您可以从任何选择的起点分析市场。一旦达到成交量疲劳线,确定一个新的起点来开始下一次分析。 您可以分析任何内容——趋势和修正。一个好的方法是每次当它达到趋势线或形成顶部或底部时移动指标。 趋势线与某一成交量疲劳线之间的距离越大,说明该方向的成交量越大。 趋势线可以作为开单的位置,而疲劳线则用于收集利润。 该系统非常独特,但又极其直观。 市场上没有类似的产品。 使用没有限制。可以在所有市场和所有时间框架中应用。 重要提示:在MetaTrader4测试器中检查时,双击紫色线条,然后左右移动它以分析市场。 如有任何问题,请随时联系我。
    Scalper Inside PRO
    Alexey Minkov
    4.74 (69)
    An exclusive indicator that utilizes an innovative algorithm to swiftly and accurately determine the market trend. The indicator automatically calculates opening, closing, and profit levels, providing detailed trading statistics. With these features, you can choose the most appropriate trading instrument for the current market conditions. Additionally, you can easily integrate your own arrow indicators into Scalper Inside Pro to quickly evaluate their statistics and profitability. Scalper Inside
    目前八折优惠! 对任何新手或专家交易者来说都是最好的解决方案! 这个仪表板软件适用于28种货币对。它基于我们的两个主要指标(高级货币强度28和高级货币冲动)。它对整个外汇市场提供了一个伟大的概述。它显示高级货币强度值,货币运动速度和28个外汇对在所有(9)时间段的信号。想象一下,当你可以使用图表上的单一指标观察整个市场,以确定趋势和或剥头皮的机会时,你的交易将得到改善 我们已经在这个指标中建立了一些功能,使你更容易识别强势和弱势货币,同时识别和确认潜在的交易。该指标以图形方式显示货币的强势或弱势是增加还是减少,以及它在所有时间段的表现。 增加的新功能是动态市场斐波那契水平,它适应当前的市场条件变化,这是一个已经在我们的高级货币强度28和高级货币冲动指标中使用的成熟的加分项。 在交易时,总是将弱势货币和强势货币配对,这个新指标将帮助你做到这一点。 用户手册:点击这里  https://www.mql5.com/en/blogs/post/708783 特点  显示每个时间段的ACS28和GAP-speed(冲动)的货币强度值。 列:颜色代码以7种颜色显示货币强度:强势
    Currency Strength Exotics
    Bernhard Schweigert
    4.88 (33)
    目前8折优惠! 对任何新手或专家交易者来说都是最好的解决方案! 这个指标是专门用来显示任何符号的货币强度,如异国货币对、商品、指数或期货。它是同类产品中的第一个,任何符号都可以添加到第9行,以显示黄金、白银、石油、DAX、US30、MXN、TRY、CNH等的真实货币强度。这是一个独特的、高质量的、负担得起的交易工具,因为我们已经纳入了一些专有的功能和一个新的公式。想象一下,你的交易将如何改善,因为你能够准确地确定新趋势或剥头皮机会的触发点? 用户手册:点击这里   https://www.mql5.com/en/blogs/post/708876 它适用于所有时间框架。你将很快能够看到TREND! 根据新的基础算法设计,它使识别和确认潜在交易变得更加容易。这是因为它以图形方式显示了8种主要货币和一种符号的强弱。 该指标显示了8种主要货币(澳元加元瑞士法郎欧元英镑日元新西兰美元)的强弱线,再加上一个符号! 该指标显示了符号的真实价值。例如:对于XAUUSD(黄金):价格以美元报价。如果黄金在上涨,你怎么能知道是黄金的强势还是美元的弱势?只有当黄金走强时,我们才会进行交易。该指
    Advanced Supply Demand
    Bernhard Schweigert
    4.91 (296)
    现在优惠 33%! 任何新手或专业交易者的最佳解决方案! 该指标是一款独特、高质量、且价格合理的交易工具,因为我们已经整合了许多专有功能和新公式。 依据此更新,您将能够显示双重时间帧区域。 您不仅可以显示一个较高的时间帧,还可以同时显示图表时间帧,加上更高的时间帧:显示嵌套时区。 供需双方所有交易者都会喜欢它。 :) 重要信息披露 高级供需的最大潜力,请访问 https://www.mql5.com/zh/blogs/post/720245   想象您的交易如何得以改善,是因为您能够精准定位入场或目标位吗? 构建于新的底层算法,它可以更轻松地识别出买卖双方之间的潜在失衡。 这是因为它以图形方式展示供需最强劲区域,及其过去的表现(显示旧区域)。 这些功能旨在帮助您更轻松地发现最佳入场区域和价位。 现在您可以针对您的交易品种和时间帧来优化和编辑区域强度! 高级供需指标适用于所有产品和时间帧。 它是一个新的公式,非常新的功能是两个区域强度函数可由用户输入进行调整! 这在交易中是一大优势。 当您学习如何使用专有功能,例如带有价格游离最小 X 因子的区域强度时,您能够判断该区域强劲与否。 供需
    Trend indicator AI
    Ramil Minniakhmetov
    5 (74)
    趋势人工智能指标是一个伟大的工具,将加强交易者的市场分析结合趋势识别与可操作的进入点和逆转警报。 该指标使用户能够自信和精确地驾驭外汇市场的复杂性 除了主要信号,趋势Ai指标识别在回调或回调期间出现的次要入口点,使交易者能够利用既定趋势内的价格修正。 重要优势: *MT4及MT5工程 *明确买入或卖出信号 ·不重绘 *适用于所有资产 小心我不卖EA或设置电报它骗局. 所有设置免费在这里的博客。  重要! 购买后立即与我联系,以获得指示和奖金! 真实的操作监控以及我的其他产品可以在这里找到: https://www.mql5.com/en/users/mechanic/seller&nbsp ; 设置和输入: 建议为所有资源设置默认设置。 第...
    M1 Arrow
    Oleg Rodin
    5 (19)
    M1 Arrow - 基于市场的两个基本原则的盘中策略。 该算法基于使用附加过滤器对交易量和价格波动的分析。该指标的智能算法仅在两个市场因素合二为一时才会发出信号。该指标使用较高时间框架的数据计算 M1 图表上某个范围的波浪。为了确认波浪,该指标使用了成交量分析。 从理论上讲,该指标可以与其他时间框架一起使用,但您需要考虑到该指标最初是为在 M1 上交易而开发的这一事实。 该指标是一个现成的交易系统。交易者所需要的只是跟随信号。此外,该指标可以成为您自己的交易系统的基础。交易仅在分钟图表上进行。 尽管指标使用 MTF 原理,但指标算法尽可能稳定。 购买后,一定要写信给我!我将与您分享我的交易设置和建议!祝您交易成功!感谢您的关注!
    购买此指标即可免费获得我的专业交易管理器。 首先,值得强调的是,这个交易系统是一个非重绘、非重画和非滞后的指标,这使得它非常适合手动和机器人交易。 在线课程,手册和下载预设。 “智能趋势交易系统 MT5”是专为新手和经验丰富的交易者量身定制的综合交易解决方案。它结合了超过 10 个优质指标,具有 7 多个强大的交易策略,使其成为适用于各种市场条件的多功能选择。 趋势跟随策略:提供精确的入场和止损管理,以有效地跟随趋势。 反转策略:识别潜在的趋势反转,使交易者能够利用区域市场的机会。 剃头策略:专为快速准确的日内交易和短期交易而设计。 稳定性:所有指标都不会重绘、不会重画和不会滞后,确保可靠的信号。 定制:支持自定义策略,以满足个人交易偏好。超过 7 种策略和组合可帮助您找到最佳策略。 信号清晰度:提供箭头信号,以指示清晰的入场和退出点。 实时警报:通过交易进出警报使交易者保持了解。 深入分析:提供更高时间框架的趋势分析和实时交易监控。 自适应颜色编码:利用蜡烛颜色编码来显示成交量、趋势和反转蜡烛信号。通过蜡烛颜色分析市场方向。 “智能趋势交易系统 MT5”赋予交易者必要的工具,以便在
    本指标是实践实战交易完善的波浪自动分析的指标 !  案例... 注: 波浪分级用西方叫法不习惯,因受到缠论(缠中说禅)命名方式习惯的影响,我是将基础波浪命名为 笔 ,将二级波段命名为 段 ,同时具有趋势方向的段命名为 主趋段 (以后笔记中都是这种命名方式,先告知大家),但是算法上和缠论关系不大切勿混淆.反映的是本人分析盘面总结的 千变万化纷繁复杂的运行规律 . 对波段进行了标准化定义,不再是不同人不同的浪  ,   对人为干扰的画法进行了排除,在严格分析进场起到了关键的作用 . 使用这个指标,等于将交易界面提升美感,抛弃最原始的K线交易带你进入新的交易层次.如果不是为了交易,在宣传上也将使客户观感提升层次. 指标内容: 1. 基础波浪 (笔) : 首先我们找出了价格波动过程中的基础波动拐点,当然他的有序性低,为下一步的计算提供基础. 2. 二级波段( 段 ) :在基础波浪的基础上,通过算法分析得到层级更明显的二级波段,二级波段为波浪提供了分析基础 3. 波浪( 浪 ): 有着更清晰的趋势,更清晰直观的方向.分析一个波浪是否延续,需要看二级波段的形态,分析二级的构成,可以得出波浪后
    PRO Renko System
    Oleg Rodin
    5 (29)
    PRO Renko Arrow Based System for trading renko charts.  准确的信号交易任何外汇工具. 另外,我将免费提供系统的附加模块! PRO Renko系统是RENKO图表上高度准确的交易系统。该系统是通用的。 该交易系统可应用于各种交易工具。 该系统有效地中和了所谓的市场噪音,打开了获得准确反转信号的通道。 该指标易于使用,只有一个参数负责产生信号。 您可以很容易地使算法适应您感兴趣的交易工具和renko酒吧的大小。 我很乐意通过提供任何咨询支持来帮助所有客户有效地使用该指标。 祝您交易成功!购买后,立即写信给我! 我将与您分享我的建议和我的renko发电机。 另外,我将免费提供系统的附加模块!
    FX Power MT4 NG
    Daniel Stein
    4.95 (20)
    FX Power:分析货币强度,助您做出更明智的交易决策 概述 FX Power 是一款专业工具,帮助您全面了解主要货币和黄金在任何市场条件下的真实强度。通过识别强势货币用于买入,弱势货币用于卖出, FX Power 简化了交易决策,并帮助您发现高概率的交易机会。不论您是想跟随趋势还是通过极端的 Delta 值预测反转,这款工具都能完美适应您的交易风格。别再盲目交易——用 FX Power 让您的交易更加智慧。 1. 为什么 FX Power 对交易者极具价值 实时货币和黄金强度分析 • FX Power 实时计算并显示主要货币和黄金的相对强度,助您全面了解市场动态。 • 监控领先或落后资产,轻松识别值得交易的货币对。 全面的多时间框架视图 • 跟踪短期、中期和长期时间框架的货币和黄金强度,以便将您的交易策略与市场趋势保持一致。 • 无论是快进快出的短线交易还是更长期的投资策略, FX Power 都能为您提供所需的信息。 Delta 动态分析用于趋势和反转 • 极端 Delta 值常常预示反转机会,而平缓的 Delta 变化则确认趋势延续。 • 使用 Delta 分析,轻
    SMC Easy Signal
    Mohamed Hassan
    4.73 (15)
    3 copies left at $65, next price is $120 SMC Easy Signal was built to remove the confusion around the smart money concept by turning structural shifts like BOS (Break of Structure) and CHoCH (Change of Character) into simple buy and sell trading signals. It simplifies market structure trading by automatically identifying breakouts and reversals as they happen, allowing traders to focus on execution rather than analysis. Whether the market is continuing its trend or preparing to reverse, the i
    Looking for a powerful yet lightweight swing detector that accurately identifies market structure turning points? Want clear, reliable buy and sell signals that work across any timeframe and any instrument? Buy Sell Arrow MT Swing is built exactly for that — precision swing detection made simple and effective. This indicator identifies Higher Highs (HH) , Higher Lows (HL) , Lower Highs (LH) , and Lower Lows (LL) with remarkable clarity. It is designed to help traders easily visualize market str
    Dynamic Forex28 Navigator
    Bernhard Schweigert
    4.43 (7)
    Dynamic Forex28 Navigator - 下一代外汇交易工具。 当前 49% 折扣。 Dynamic Forex28 Navigator 是我们长期流行的指标的演变,将三种功能合二为一: 高级货币强度 28 指标 (695 条评论)+ 高级货币 IMPULSE 带警报 (520 条评论)+ CS28 组合信号(奖励)。 有关指标的详细信息 https://www.mql5.com/en/blogs/post/758844 下一代强度指标提供什么? 您喜欢的原始指标的一切,现在通过新功能和更高的精度进行了增强。 主要特点: 专有货币强度公式。  所有时间范围内的平滑和准确的强度线。 非常适合识别趋势和精确进入。 动态市场斐波那契水平(市场斐波那契)。  此指标独有的独特功能。 斐波那契应用于货币强度,而不是价格图表。 适应实时市场活动以获得准确的反转区域。 实时市场动量。  第 9 行显示市场是活跃还是被动。 对于定时交易至关重要。 全面的警报和显示。  每种货币最强的买入和卖出动量。 ​​28 对的双重动量买入和卖出。 超买/超卖警告外部范围和止损。 反转
    ACB Breakout Arrows
    KEENBASE SOFTWARE SOLUTIONS
    4.15 (34)
    ACB Breakout Arrows 指标通过识别一种特殊的突破形态,为交易者提供关键的入场信号。该指标持续扫描图表中某一方向上趋于稳定的动能,并在主要行情启动之前给出准确的进场信号。  点击此处获取多品种、多周期扫描仪 - ACB Breakout Arrows MT4 专用扫描仪 主要功能 指标自动提供止损和止盈位置。 配备 MTF 多周期扫描仪面板,可跟踪所有时间周期的突破信号。 适用于日内交易者、波段交易者和剥头皮交易者。 采用优化算法,提高信号准确性。 提供特殊目标线,用于设置快速平仓点或无损平移位(Quick Profit Line)。 包括胜率、成功率、平均收益等表现分析指标。 不重绘,信号一旦出现即保持不变。 交易确认 -  建议结合使用 ACB Trade Filter 指标 以过滤低质量信号。 强买入: 上箭头 + 绿色柱状图 + 多头趋势。 强卖出: 下箭头 + 红色柱状图 + 空头趋势。 避免交易 :当柱状图为灰色且趋势为震荡时。 (可选) -  建议使用 KT  支撑与阻力位指标  来避免在关键支撑/阻力区域附近开仓。此类交易可能迅速转为亏损,造成不必
    Currency Strength Wizard
    Oleg Rodin
    4.84 (55)
    货币强度向导是一个非常强大的指标,为您提供成功交易的一体化解决方案。该指标使用多个时间范围内所有货币的数据来计算这个或那个外汇对的力量。此数据以易于使用的货币指数和货币电力线的形式表示,您可以使用它们来查看这种或那种货币的力量。 您所需要的只是将指标附加到您要交易的图表上,该指标将向您显示您交易的货币的真实强度。该指标还向您显示买卖量压力的极值,您可以在顺势交易时利用这些压力。该指标还显示了基于斐波那契的可能目标。该指标可用于各种交易时间范围。该指标支持各种货币对的交易。 该指标为您提供所有类型的警报,包括推送通知。 购买后请联系我。我将与您分享我的交易技巧,并免费为您提供丰厚的红利指标! 祝您交易愉快,获利丰厚!
    Advanced Currency Strength28 Indicator
    Bernhard Schweigert
    4.91 (657)
    目前26%的折扣 任何新手或专家交易者的最佳解决方案! 这个指标是一个独特的、高质量的、可负担得起的交易工具,因为我们纳入了一些专有的功能和一个新的公式。只需一个图表,你就可以读出28个外汇对的货币强度!想象一下,你的交易将如何得到改善,因为你的交易是在你的手中进行的。想象一下,你的交易将如何改善,因为你能够准确地确定新趋势或剥头皮机会的触发点? 用户手册:点击这里  https://www.mql5.com/en/blogs/post/697384 这是第一本,原版的! 不要买一个毫无价值的崇拜者的克隆品。 特别的 子窗口中的箭头显示强劲的货币势头GAP将指导你的交易! 当基础货币或报价货币处于超卖/超买区域(外盘斐波那契水平)时,在个人图表的主窗口中出现警告信号。 当货币力量从外围区间回落时,回撤/反转警报。 十字星模式的特别警报 可选择多个时间框架,以快速查看趋势! 货币强度线在所有的时间框架中都非常平稳,当使用较高的时间框架来识别总体趋势,然后使用较短的时间框架来确定精确的入口时,效果非常好。你可以根据自己的意愿选择任何时间框架。每个时间框架都由其自身进行了优化。
    Trend Screener
    STE S.S.COMPANY
    4.79 (95)
    趋势指标,趋势交易和过滤的突破性独特解决方案,所有重要趋势功能都内置在一个工具中! 它是 100% 非重绘多时间框架和多货币指标,可用于所有符号/工具:外汇、商品、加密货币、指数、股票。 限时优惠:支撑和阻力筛选指标仅售 50美元,终身有效。(原价 250 美元)(优惠延长) 趋势筛选器是有效的指标趋势跟踪指标,它在图表中提供带有点的箭头趋势信号。 趋势分析器指标中可用的功能: 1.趋势扫描仪。 2. 具有最大利润分析的趋势线。 3.趋势货币强度计。 4. 带有警报的趋势反转点。 5. 带有警报的强趋势点。 6. 趋势箭头 每日分析示例,每日信号表现...等与我们的趋势筛选指标,可以在这里找到: 点击这里 限时优惠:Trend Screener Indicator 仅售 50 美元且终身可用。原价 125$) 通过访问我们的 MQL5 博客,您可以找到我们所有的高级指标以及分析示例、每日信号表现...等。 : 点击这里 我们的趋势系统由 2 个指标组成: 1. Trend Screener Indicator:显示趋势仪表盘、图表中的趋势线、入场点...等。 2. Trend
    Smc Blast Signal
    Mohit Dhariwal
    SMC Blast Signal with FVG, BOS and trend Breakout The SMC Blast Signal  is a  Precise trading system for Meta Trader 4 that uses Smart Money Concepts (SMC) , including Fair Value Gaps (FVG) and Break of Structure (BOS) , to identify high-probability trades. It incorporates a Trend Filter using a higher timeframe moving average, ensuring trades align with the prevailing market trend. TREND SIGNAL-FVG DETECTION-BOS DETECTION-TRADE CONFIRMED-Precise Signal entries on m15  Best TF-M15 AND ABOVE Be
    Day Trader Master
    Oleg Rodin
    5 (15)
    Day Trader Master 是一个完整的日间交易者交易系统。该系统由两个指标组成。一个指标是买入和卖出的箭头信号。这是你得到的箭头指示器。我将免费为您提供第二个指标。第二个指标是专门设计用于与这些箭头结合使用的趋势指标。 指标不重复也不迟到! 使用这个系统非常简单。您只需按照当前趋势方向的箭头信号,显示为双色线。蓝色是买入趋势。红色是一种销售趋势。蓝色箭头是买入信号。红色箭头是卖出信号。您需要箭头的颜色和信号的方向来匹配趋势线的颜色。 箭头指标主要是为 M5 和 M15 时间间隔的日内交易而创建的。但从技术上讲,该系统可以用于其他时间间隔。 指示器配备带有推送消息功能的弹出警报。 购买后一定要写信给我!我将为您提供与系统交易的个人建议,以及我的趋势指标。此外,还有丰厚的奖励等着您!
    Market Structure Break Out
    Ashkan Hazegh Nikrou
    5 (8)
    Market Structure Break Out(MSB) 是一款为 MT4 和 MT5 平台 设计的高级工具,帮助交易者以结构的角度观察市场走势。它通过箭头和警报提示,标示出趋势方向和反转方向的关键 交易信号 。 其一大亮点功能是能够绘制 持续的供需区域 ,让交易者清晰了解关键价格区域。此外, 实时回测功能 使用户能够在图表上直接查看该指标在历史中的表现,增强了信号的透明度与可信度。 领取您的免费EA: 获取免费的 Market Structure Breakout EA ,它可以根据突破箭头自动开仓,使用固定手数,并可自定义止损和止盈水平。 如何领取: 点击此处下载 EA 。请注意,此 EA 仅在您已购买 Market Structure Break Out 指标 后才能使用。 MT5 版本的产品在此: https ://www .mql5 .com /en /market /product /124690 该指标正在持续更新。 我们努力提供基于市场结构的高精度进场和出场点。当前版本为1.6,以下是最新的更新内容,欢迎加入我们: 买卖目标: 清晰了解买入和卖出仓位的最佳止
    特别优惠 : ALL TOOLS ,仅 $35 一个! 新工具   将以   $30   在   第一周   或   前 3 笔购买 销售!  Trading Tools Channel on MQL5 : 加入我的 MQL5 频道获取最新动态 Volumatic Support/Resistance Levels Scanner 是一款支撑/阻力指标,为价格结构加入成交量背景。通过显示交易活动在近期转折点附近的聚集情况,它帮助用户了解买入或卖出兴趣最活跃的位置。 查看 MT5 版本:  Volumatic Support Resistance Levels MT5 Scanner 查看更多产品:  All P roducts 1 · 概览 该指标从最近的高点和低点绘制价格区间,并为每个区间叠加成交量直方图。直方图厚度会随当前市场活动而扩展或收缩,使用户能够衡量市场对特定价格水平的关注度。 2 · 关键概念 价格区间 — 在最近价格转折点绘制的水平带。 成交量直方图 — 根据区间附近成交量百分位变化宽度的填充带。 高成交量标记 — 当区间成交量超过用户设定阈值时出现的圆圈。 Bars
    Entry Points Pro
    Yury Orlov
    4.62 (172)
    这是一款 MT4 的趋势指标,可提供准确的入场交易信号,且无重绘或延迟。 它可应用在任何金融资产:外汇、加密货币、贵金属、股票、指数。 最好的结果出现在 M15+ 的时间帧内。 指标的 MT5 版本 重要! 购买后请联系我,以便获取详细指南和奖励。 视频 (6:22) - 一个信号赢取的利润等于指标价格的三倍。 视频 (4:44) - 它如何在测试器中工作,我的提示和技巧。 视频 (1:44) - 有关它如何处理加密货币和指数的几句话。 大多数交易者在 Entry Points Pro 指标的帮助下,在第一个交易周内就改善了他们的交易结果。 Entry Points Pro 指标的益处 入场信号无重绘或延迟 如果信号出现,并得到确认(如果信号所在烛条已收盘),则它不会再消失;不像是重绘指标,它会导致重大的财产损失,因为它们可以在显示信号后再将其删除。 无差错开仓 指标算法可令您找到入场交易(买入或卖出资产)的理想时机,从而提高每位交易者的成功率。 Entry Points Pro 可操作任何资产 它允许您在 MT4 平台上交易任何经纪商提供的加密货币、股票、金属、指数、商品
    Hidden Cycles
    Lev Vladimirovic Marushkin
    5 (1)
    Black Friday Sale – Limited Time! Grab Hidden Cycles for only $129 (regular price $179 ). This is your chance to boost your strategy with a powerful, easy-to-use cycle-based trading tool. Offer ends soon — don’t miss it! Based on Universal Laws — NOT Some Guy’s Algorithm: Let the market adjust to the Hidden Cycles Geometry — not the other way around. Most indicators are based on a man-made formula. They often lag, fail over time, or need constant re-optimization.  Hidden Cycles is different.
    Adaptive Volatility Range
    Stanislav Konin
    5 (3)
    Adaptive Volatility Range [AVR] is a powerful tool for identifying key trend reversal points. AVR accurately reflects the Average True Range (ATR) of volatility, taking into account the Volume-Weighted Average Price (VWAP). The indicator adapts to any market volatility by calculating the average volatility over a specific period, ensuring a stable rate of profitable trades. You receive not just an indicator but a professional automated trading system , AVR-EA . Advantages: Automated Trading Sys
    Advanced Currency IMPULSE with ALERT
    Bernhard Schweigert
    4.91 (489)
    目前31%的折扣!! 对任何新手或专家交易者来说都是最好的解决方案! 这个指标是一个独特的、高质量的、负担得起的交易工具,因为我们已经纳入了一些专有的功能和一个秘密的公式。只需一张图表,它就能给出所有28种货币对的警报。想象一下,你的交易将如何改善,因为你能够准确地确定新趋势或剥头皮机会的触发点 建立在新的基础算法上,它使识别和确认潜在交易变得更加容易。这是因为它以图形方式显示了一种货币的强势或弱势是否正在加速,并测量了这种加速的速度--把它想象成你汽车中的速度表。当你加速时,事情显然会发生得更快,这在外汇市场上也是一样的,即如果你配对的货币正在向相反的方向加速,你就会发现一个潜在的有利可图的交易。 货币动量的垂直线和箭头将指导你的交易! 动态的市场斐波那契23水平被用作警报触发器,将适应市场活动。如果冲动触及黄色触发线,您将在MetaTrader或您的电子邮件或推送警报中收到警报。然后你就知道作为一个交易员应该做什么。货币对和方向已经给出。只要点击警报按钮,就可以切换到该货币对或打开一个新的图表,以便进一步分析。警报级别可以通过用户输入来改变,可以选择3个敏感度级别。 尽
    Binary Trader Master 是一个基于箭头的指标,可预测蜡烛的收盘价。它仅在一根蜡烛内进行分析。当蜡烛打开时,需要一些时间来进行分析并预测蜡烛的收盘价。然后它产生一个信号。该指标还允许您应用可用于分析的时间限制,这意味着您实际上可以告诉指标允许在蜡烛内进行分析的时间。该指标监控蜡烛中的特殊交易量模式。该分析实际上预测了当前 (0) 蜡烛的收盘价。由于此类蜡烛通常具有强劲的成交量,因此这些信号也具有良好的获利潜力,也可用于外汇交易。二元和外汇交易者都可以从该指标中受益。 由于指标与单个蜡烛的主体一起使用,因此指标仅在实时或视觉策略测试模式下提供信号! 信号不要重绘! 购买后请联系我!我会为您提供交易说明,免费赠送您丰厚的红利!
    作者的更多信息
    Instant Pitchfork for MT4
    Part-time Day Trader
    Most traders want to use Andrews’ Pitchfork, but manually plotting the three anchor points is slow, inconsistent, and easy to get wrong. This is one of the main reasons pitchforks are underused, despite being one of the most effective tools for defining structure, channels, and reaction zones. Instant Pitchfork solves this. With one anchor point and a single click, it draws a perfectly aligned Andrews’, Schiff, or Modified Schiff pitchfork — following the correct rules from swing to swing to sw
    Draggable Candle Timer MT5
    Part-time Day Trader
    5 (4)
    The Draggable Candle Timer is a clean, minimal, and fully customizable tool that displays the live countdown to the next candle close. Designed for flexibility, it can be dragged and repositioned anywhere on the chart, ensuring it never interferes with your analysis.  The timer runs on the system clock, so without the glitches or delays common in other candle timers that run on the Market Watch clock. To move the timer: Double-click to select it, then drag it by the upper-left anchor point to y
    FREE
    Identify the exact price zones targeted by banks during stop-hunts — where retail stop-losses typically cluster. The Bank Levels Tracker for MT5 plots these institutional zones directly on the chart in real time. Retail stops often sit just beyond clear swing highs and lows — areas frequently exploited by Smart Money through stop-runs. When price reaches one of these “bank levels,” the indicator issues an instant alert. All levels are price-bound and never repaint. Once triggered, they remain v
    MT4 Sessions Indicator
    Part-time Day Trader
    5 (3)
    The MT4 Sessions Indicator indicator highlights trading sessions directly on the chart by displaying them with colored candles. It helps traders quickly see when price action occurred during specific market sessions or times of day. It’s especially useful for traders who work with volume profile, supply & demand zones, or level-based strategies, where the timing of a move is just as important as the price level. By visually separating sessions, it becomes easier to spot patterns, compare sessi
    FREE
    Smart Trend Zones MT4
    Part-time Day Trader
    VP Trend Zones lets trend traders track institutional activity through a clear support and resistance heatmap built from volume profile, showing exactly where price has already accepted value and is therefore most likely to react again. Unlike standard volume profile indicators that rely on side-mounted volume bars, VP Trend Zones places important levels directly on the chart, making support and resistance instantly visible and far easier to read. By analyzing volume inside the active trend, VP
    Identify the exact price zones targeted by banks during stop-hunts — where retail stop-losses typically cluster. The Bank Levels Tracker for MT5 plots these institutional zones directly on the chart in real time. Retail stops often sit just beyond clear swing highs and lows — areas frequently exploited by Smart Money through stop-runs. When price reaches one of these “bank levels,” the indicator issues an instant alert. All levels are price-bound and never repaint. Once triggered, they remain vi
    Instant Pitchfork for MT5
    Part-time Day Trader
    Most traders want to use Andrews’ Pitchfork, but manually plotting the three anchor points is slow, inconsistent, and easy to get wrong. This is one of the main reasons pitchforks are underused, despite being one of the most effective tools for defining structure, channels, and reaction zones. Instant Pitchfork solves this. With one anchor point and a single click, it draws a perfectly aligned Andrews’, Schiff, or Modified Schiff pitchfork — following the correct rules from swing to swing to sw
    Auto Fib SR
    Part-time Day Trader
    Fibonacci ratios are a widely used and proven method for identifying support and resistance levels—both within individual trends and across the entire chart. However, using the standard MetaTrader Fibonacci tool is often time-consuming and frustrating. Levels must be positioned manually from wick to wick, and as the trend extends, the tool requires constant re-adjustment to remain accurate. This is where Auto Fib SR for MT5 comes in.  Auto Fib SR automatically draws precise Fibonacci levels on
    Volume Zones
    Part-time Day Trader
    Short-term price movement is largely driven by institutional trading activity. Volume Profile is a proven method for identifying where price has attracted real interest—and where reactions are most likely to occur. Volume Zones transforms volume profile into a clear, full-chart support and resistance heatmap, making it easy to spot and mark the most important price levels at a glance—much faster and clearer than traditional volume bars displayed at the side of the chart. With optional one-click
    Smart Trend Zones
    Part-time Day Trader
    VP Trend Zones MT5 lets trend traders track institutional activity through a clear support and resistance heatmap built from volume profile, showing exactly where price has already accepted value and is therefore most likely to react again. Unlike standard volume profile indicators that rely on side-mounted volume bars, VP Trend Zones places important levels directly on the chart, making support and resistance instantly visible and far easier to read. By analyzing volume inside the active trend
    筛选:
    无评论
    回复评论