Strategic scalping

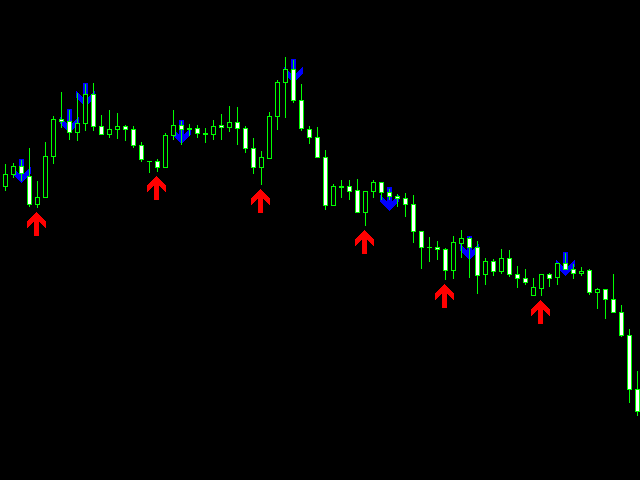
“戰略剝頭皮”指標在圖表上顯示可能的趨勢反轉點。 該指標突出顯示兩個不同的樞軸點:高點(上方的樞軸點)和低點(下方的樞軸點)。
上樞軸點由向下箭頭指示,當價格達到高位並開始下跌時會出現在圖表上。 當價格觸底並開始上漲時,樞軸低點由向上的箭頭指示並出現在圖表上。
該指標對於正在市場中尋找進入點和退出點的交易者很有用。 它可以幫助交易者識別價格達到極端的時刻並發出可能的趨勢逆轉信號。
該指標可以針對不同的時間間隔和工具進行配置。 它還可以輔以其他指標和交易策略以獲得更準確的信號。
此外,該指標還可以與其他指標和市場分析結合使用,以提高交易效率。 它可以幫助交易者在市場上看到更多的獲利機會,避免潛在的損失。

指標設置:
  • period_signal - 指標週期。
  • UpperBorder - 市場超買的上邊界,用於賣出信號。
  • LowerBorder - 市場超賣的下邊界,用於買入信號。
  • 寬度 - 指標在圖表上繪製的箭頭的大小。
推荐产品
Cosmic Diviner Big Deals System
Olena Kondratenko
4.2 (5)
This is a unique multi-currency trading strategy developed for trading on H1 timeframe, which allows you to determine the global market entry points and obtain the maximum profit for each transaction. The market entry point is calculated using a variety of author equations and algorithms. We recommend using the indicator simultaneously on several trading instruments . A huge advantage of Big Deals System is an information panel in which the user can see the current information on potential entry
Smart Trendlines
Suvashish Halder
5 (1)
Smart Trendlines – No.1 Trendlines Indicator Smart Trendlines is a precision tool that automatically draws trendlines based on every valid pivot point, helping traders identify key support and resistance zones. It continuously adjusts as new market pivots form, providing a live and accurate reflection of price structure. Whether you’re tracking trends, preparing for reversals, or anticipating breakouts — this indicator keeps you one step ahead. It works seamlessly across all assets including For
FiboZag
Andriy Sydoruk
Indicator FiboZag - transfer the indicator to the chart and the Fibonacci levels will be built automatically on the last ZigZag turn. The main advantage lies in the correct construction of Fibonacci levels and markup of price levels. Simple, visual and effective use. The indicator is not redrawn and does not lag. Works on all currency pairs and on all timeframes.
KT Auto Trendline MT4
KEENBASE SOFTWARE SOLUTIONS
KT Auto Trendline draws the upper and lower trendlines automatically using the last two significant swing highs/lows. Trendline anchor points are found by plotting the ZigZag over X number of bars. Features No guesswork requires. It instantly draws the notable trendlines without any uncertainty. Each trendline is extended with its corresponding rays, which helps determine the area of breakout/reversal. It can draw two separate upper and lower trendlines simultaneously. It works on all timeframe
Set TP and SL like Financial Institutions Traders' TP expectations do not often occur and their SL often hits when they only rely on primitive indicators like pivot-points and Fibonacci or classic support or resistance areas. There are a variety of indicators for support/resistance levels, whereas they are seldom accurate enough. Classical support/resistance indicators, often present miss levels and are not noteworthy based on current market volatility dynamic. Fibonacci is good but not enough
Pivot Points MT4
KEENBASE SOFTWARE SOLUTIONS
KT Pivot Points 会根据最新市场数据自动在图表上绘制每日、每周和每月的枢轴点位。这是外汇市场中广泛使用的技术分析工具之一,用于识别潜在的支撑和阻力区域。 功能特点 当价格触及枢轴点时发送提醒。  每种枢轴点类型都支持全面自定义。   无须复杂设置即可显示日线、周线和月线的枢轴点位。 占用 CPU 资源极少,计算速度快。 可与图表上的其他指标兼容使用。 什么是枢轴点 枢轴点是通过上一交易日(或交易周期)的最高价、最低价和收盘价计算出的平均值。  通过计算得出的枢轴点可以预测未来的支撑和阻力位,帮助判断价格在这些关键水平附近的走势。 通常认为,如果价格高于枢轴点,市场情绪偏多;反之,则偏空。 枢轴点计算公式 我们使用前一天、一周或一个月的最高价、最低价和收盘价来计算枢轴点水平。 P = (H + L + C) / 3 R1 = P + (P − L) = 2×P − L S1 = P − (H − P) = 2×P − H R2 = P + (H − L) S2 = P − (H − L) R3 = H + 2×(P − L) = R1 + (H − L) S3 =
CRT Candle Range Theory HTF MT4.   Ultimate CRT Indicator: Advanced ICT Concepts and Malaysian SnR Trading System Discounted   Price   $50  !!     Secure your lifetime access   now   before it switches to   subscription-only ! Master the Market Maker's Footprints with the Most Advanced Candle Range Theory Indicator Unlock the true power of   Smart Money Concepts (SMC)   and trade precisely like the institutions with the   Ultimate CRT Indicator . Built exclusively for serious traders, this indic
The Auto Super Pivot indicator is an indicator designed to calculate support points and resistance points for pivot points. this indicator has the ability to calculate standard pivot, fibonacci, camarilla, woodie and demark pivot points. It also allows you to use all time zones with the time frame feature. Another feature of the indicator is the auto time slice feature. This feature allows automatic calculations without having to set any time zone. Features 6 different pivot calculation modes A
Raymond Cloudy Day Indicator for MT4 – Pivot-Based Reversal and Trend Levels Raymond Cloudy Day Indicator is a pivot-based level indicator for MetaTrader 4 (MT4). It was developed by Ngo The Hung based on Raymond’s original idea and is designed to give a structured view of potential reversal zones, trend extensions and support/resistance levels directly on the chart. The default settings are optimised for XAUUSD on the H1 timeframe, but the indicator can be tested and adjusted for other symbols
Super support and resistance
Peter Francois J Thijs
This support and resistance indicator gives u a)support level b)resistance level c)direction(trend) all in one.The indicator is based on the top 3 best levels there are!Red dots are sell direction and green dots are buy direction,if candles dont break these levels u get in after the 3rd dot,always use higher time frames from h1 up so its more clear where direction is going,also u can set the indicator to your time frame that u are lookin at.
This indicator is designed based on Mr.   WD   Gann's square of nine methods. Using this indicator, we can enter the desired   pivot   price and, based on the coefficient we assign to it, extract 8   support and resistance   numbers with 8 angles of 45, 90, 135, 180, 225, 270, 315, and 360. Calculates 8   support and resistance   points and draws   support and resistance   lines. The coefficient is to triple the number of executions. To select   pivot points   in which a price is a large nu
Introduction to Support Resistance Indicator Support and Resistance are the important price levels to watch out during intraday market. These price levels are often tested before development of new trend or often stop the existing trend causing trend reversal at this point. Highly precise support and resistance are indispensable for experienced traders. Many typical trading strategies like breakout or trend reversal can be played well around these support and resistance levels. The Precision Sup
Classic Fractals indicator for MT4, with additional Trendlines connecting the latest couples of fractals ( fractals are showing highest high, and lowest low on each period) Rules for trendlines: -if new top fractal is below the last one = new resistance line -if new bot fractal is above the last one = new support line -Trendlines can be hidden -Fractals can be hidden Fractal Period = can be both even or uneven number, as it is setting for half (one side) of the bars sequence for findin
Point Implant
Nadiya Mirosh
What are "pivot points"? Pivot point analysis is often used in conjunction with the calculation of support and resistance levels, as is the case with trend line analysis. Pivot point analysis calculates the first support and resistance levels using the trading range width between the pivot point and the previous day's high or low price. The second support and resistance levels are calculated using the entire width between the previous day's high and low prices. Looking for a quality pivot poin
support resistance levels indicator mt4: 此工具是一个多时间框架指标,能够在图表上识别和绘制支持和阻力线以及斐波那契水平,其准确性与人眼相同。TW 外汇支持和阻力水平具有复杂的算法,可以扫描图表以识别先前的价格稳定和反弹水平,并记录触碰次数。 您是否厌倦了手动绘制支持和阻力水平以及斐波那契回撤? 查看此产品的功能;您会感到惊讶。 产品特点: 1. 次要和主要水平:您可以根据自己的喜好自定义次要和主要水平,并使用高级算法删除额外水平。 2. 水平触碰次数:TW 支持阻力水平与突破 mt4,计算并提供每个水平在过去被触碰的次数,使您能够评估每个水平的强度。 3. 斐波那契水平:最后一波的斐波那契水平动态绘制,这使您能够检查这些水平与静态支持和阻力水平计算器获得的值之间的对齐。 4. 开发者缓冲区:该产品包括开发交易策略所需的缓冲区。 5. 适用于所有货币和时间框架:您可以将 TW 支持和阻力水平用于黄金、欧元、英镑、美元等。 6. 简单且可定制的用户界面:该产品的用户界面非常简单且可定制,允许您根据自己的喜好个性化或禁用颜色和项
TrendControl
Ivan Simonika
TrendControl is an arrow indicator of technical analysis for determining a trend, which can adjust to the price, is a graphical plot calculated using mathematical formulas, the initial data for which is a price chart. The indicator shows the direction of the trend, takes into account the minimum and maximum values ​​of the extreme candles on the chart, then brings them to the average and compares them with the past data. The principle of operation of the indicator is to automatically determine
The new update makes this indicator a complete tool for studying, analyzing and operating probabilistic patterns. It includes: On-chart Multi-asset percentage monitor. Configurable martingales. Twenty-one pre-configured patterns , including Mhi patterns and C3. An advanced pattern editor to store up to 5 custom patterns. Backtest mode to test results with loss reports. Trend filter. Hit operational filter. Martingale Cycles option. Various types of strategies and alerts. Confluence between patte
Price Magnets
Ivan Simonika
Price Magnet — Price Density and Attraction Levels Indicator Price Magnet is a professional analytical tool designed to identify key support and resistance levels based on statistical Price Density. The indicator analyzes a specified historical period and detects price levels where the market spent the most time. These zones act as “magnets,” attracting price action or forming a structural base for potential reversals. Unlike traditional Volume Profile tools, Price Magnet focuses on price-time d
BoS CHoCH FVG
Usiola Oluwadamilol Olagundoye
4.67 (3)
Next Arrival : Flip or Die Trading Arena. Flip a trading account:  https://flipordie.com/chapter-1-thirteen-doublings-double-a-trading-account/ The Break of Structure (BoS) and Change of Character indicator with Fair Value Gap (FVG) filter is a specialized tool designed to enhance trading strategies by pinpointing high-probability trading opportunities on price charts. By integrating the BoS and Change of Character concepts with the FVG formation, this indicator provides traders with a robust f
FREE
Bos CHoCH 4
Usiola Oluwadamilol Olagundoye
Next Arrival : Flip or Die Trading Arena. Flip a trading account:  https://flipordie.com/chapter-1-thirteen-doublings-double-a-trading-account/ The Break of Structure (BoS) and Change of Character indicator is a powerful tool designed to identify significant turning points in price movements on financial charts within the MetaTrader 4 platform. By analyzing price action, this indicator highlights instances where the market shifts from a trend to a potential reversal or consolidation phase. Util
FREE
Supply Demand Zone Pro Indicator works with all products and timeframes. It is using a new calculation method, and now you can select the desired zone on any timeframe! Strongest Zones are already enabled by default This is a great advantage in trading.This indicator has a built in backtester enabled by default, just move the chart. Supply and Demand ? Supply is a price zone where sellers outnumbered buyers and drove the price lower. Demand is a price zone where buyers outnumbers sellers and dr
EARLY REMINDER: The Starting price is 65 price will rise soon up to 365$ and then 750$ after first 10 copies of sales. Grab this offer now! Introduction Hello, traders! Welcome to the demonstration of the Forex Beast Indicator , a comprehensive tool designed to assist aspiring traders in navigating the complexities of the forex market. This indicator incorporates seven essential components to provide a well-rounded trading experience: Moving Averages Colored Zones Support and Resistance Levels
VJ Pivot Levels
Vijayaratna Kumar Boda
4.25 (4)
Introduction: Whatever trading method you use, it is important to know the Pivot levels to take the key attention for your entries & exits. This indicator has been made using the standard classic formula for Auto drawing the Pivot levels. Also based on the previous day trading range, the probable expected today trading range has been highlighted in a different color for your reference. Output of the Indicator: This Indicator gives the Pivot level Different resistance Levels Different Support le
SuperRSI
Andriy Sydoruk
The SuperRSI indicator is an advanced index of internal strength. The indicator shows not the relative strength of the trading instruments being compared, but the internal strength of a single instrument, therefore, it is the “Internal Strength Index”. This is an advanced form of the SuperRSI indicator. It converts the signal so that low-frequency components are delayed much more than high-frequency components. In general, the data of the last bar have more weight than previous data, like an exp
Fibonacci Wave Bands
Luc Michael Botes
Fibonacci Wave Bands Indicator The Fibonacci Wave Bands indicator utilizes Fibonacci ratios to create dynamic bands around a central moving average. These bands are derived from key Fibonacci ratios (typically 38.2%, 50%, 61.8%) and adapt to market volatility, offering insights into potential support and resistance zones. Key Features: Fibonacci Levels: The indicator plots multiple bands above and below a central moving average based on Fibonacci ratios. Dynamic Support and Resistance: Bands ser
Fibonacci Auto Levels
Mohamed yehia Osman
Possible Price reversals levels - based on  Fibonacci + Support +  Resistance Levels Auto levels drawn based on input index (Bars Count )  ---->>> Price Over 50% Fibo line ---> UP TREND ---> BUY when price drop near Support Lines  ---->>> Price Down 50% Fibo line ---> DOWN TREND ---> SELL when price goes up  near Resistance Lines  --->>> The more close price levels ----> the more possibility for price reversals --->>> are you a scalper --> try it on M1 charts with big index like 5000 bars  or
Beast Super Signal
Florian Zuercher
4.73 (89)
正在寻找可以帮助您轻松识别有利可图的交易机会的强大外汇交易指标? Beast Super Signal 就是您的不二之选。 这个易于使用的基于趋势的指标持续监控市场状况,寻找新的发展趋势或跳入现有趋势。当所有内部策略一致且彼此 100% 融合时,Beast Super Signal 会发出买入或卖出信号,无需额外确认。当您收到信号箭头警报时,只需买入或卖出。 购买后给我留言,让我加入我的私人 VIP 群组! (仅限购买完整产品)。 购买后给我发消息以获取最新的优化设置文件。 此处提供 MT5 版本。 在此处 获取 Beast Super Signal EA。 查看评论部分以查看最新结果! Beast Super Signal 根据您偏好的 1:1、1:2 或 1:3 风险回报率建议入场价、止损和获利水平,让您放心交易。这个 Beast Super Signal 是 100% 不可重新绘制的,这意味着它永远不会重新计算或重新绘制,每次都能为您提供可靠的信号。 Beast Super Signal 指标适用于所有时间范围,包括货币对、指数、商品和加密货币对。 Beast Su
Retracement Watcher
Christian Ricard
This indicator watch the Fibonacci retracement for levels and timeframes selected by the trader. In the workload of day trading, having your eyes on all the timeframes to validate some information, for Fibonacci traders, is really time consuming and requires constant focus.  With this in mind, this tool allows you to have your attention on other trading details while this one monitors the retracements of each timeframe in real time. In the charts, this indicator data (retracement %, age of the r
ON Trade Pivoteer
Abdullah Alrai
4 (1)
Introducing the Pivot Point Selector Indicator: Your Ultimate Tool for Custom Pivot Levels Are you ready to take your trading to the next level? Say hello to the Pivot Point Selector Indicator, a game-changing tool that puts you in control of your pivot levels. This innovative indicator empowers you to choose three specific points that will determine the pivot level calculations, giving you unparalleled customization and precision in your trading strategy. Key Features and Benefits: Custom Pivo
FREE
Auto Fibo Pro m
DMITRII GRIDASOV
“Auto FIBO Pro” Crypto_Forex 指标 - 是交易中的绝佳辅助工具! - 指标自动计算并放置在图表斐波那契水平和局部趋势线(红色)上。 - 斐波那契水平指示价格可能反转的关键区域。 - 最重要的水平是 23.6%、38.2%、50% 和 61.8%。 - 您可以将其用于反转剥头皮或区域网格交易。 - 还有很多机会可以使用 Auto FIBO Pro 指标来改进您当前的系统。 - 它具有信息价差掉期显示 - 它显示所连接的外汇对的当前价差和掉期。 - 显示屏还显示账户余额、净值和保证金。 - 可以将信息价差掉期显示定位在图表的任何角落: 0 - 左上角,1 - 右上角,2 - 左下角,3 - 右下角。 点击这里查看高质量的交易机器人和指标! 这是仅在此 MQL5 网站上提供的原创产品。
该产品的买家也购买
Scalper Inside PRO
Alexey Minkov
4.74 (69)
Scalper Inside PRO – Since 2020. An exclusive indicator that utilizes an innovative algorithm to swiftly and accurately determine the market trend. The indicator automatically calculates opening, closing, and profit levels, providing detailed trading statistics. With these features, you can choose the most appropriate trading instrument for the current market conditions. Additionally, you can easily integrate your own arrow indicators into Scalper Inside Pro to quickly evaluate their statistics
PRO Renko System
Oleg Rodin
5 (30)
PRO Renko Arrow Based System for trading renko charts.  准确的信号交易任何外汇工具. 另外,我将免费提供系统的附加模块! PRO Renko系统是RENKO图表上高度准确的交易系统。该系统是通用的。 该交易系统可应用于各种交易工具。 该系统有效地中和了所谓的市场噪音,打开了获得准确反转信号的通道。 该指标易于使用,只有一个参数负责产生信号。 您可以很容易地使算法适应您感兴趣的交易工具和renko酒吧的大小。 我很乐意通过提供任何咨询支持来帮助所有客户有效地使用该指标。 祝您交易成功!购买后,立即写信给我! 我将与您分享我的建议和我的renko发电机。 另外,我将免费提供系统的附加模块!
Quantum Breakout Indicator PRO
Bogdan Ion Puscasu
4.96 (26)
介绍     Quantum Breakout PRO   ,突破性的 MQL5 指标,正在改变您交易突破区域的方式!   Quantum Breakout PRO 由拥有超过 13 年交易经验的经验丰富的交易者团队开发,旨在通过其创新和动态的突破区域策略将您的交易之旅推向新的高度。 量子突破指标将为您提供带有 5 个利润目标区域的突破区域的信号箭头,以及基于突破框的止损建议。 它既适合新手交易者,也适合专业交易者。 量子 EA 通道:       点击这里 MT5版本:   点击这里 重要的!购买后请私信我领取安装手册。 建议: 时间范围:M15 货币对:GBPJPY、EURJPY、USDJPY、NZDUSD、XAUUSD 账户类型:ECN、Raw 或 Razor,点差极低 经纪商时间:GMT +3 经纪商:IC Markets、Pepperstone with Raw 和 Razor 的点差最低 规格: 不重漆! 最多 5 个建议利润目标区域 建议止损水平 可定制的盒子。您可以设置自己的 Box Time Start 和 Box Time End。 接触 如果您
购买此指标即可免费获得我的专业交易管理器。 首先,值得强调的是,这个交易系统是一个非重绘、非重画和非滞后的指标,这使得它非常适合手动和机器人交易。 在线课程,手册和下载预设。 “智能趋势交易系统 MT5”是专为新手和经验丰富的交易者量身定制的综合交易解决方案。它结合了超过 10 个优质指标,具有 7 多个强大的交易策略,使其成为适用于各种市场条件的多功能选择。 趋势跟随策略:提供精确的入场和止损管理,以有效地跟随趋势。 反转策略:识别潜在的趋势反转,使交易者能够利用区域市场的机会。 剃头策略:专为快速准确的日内交易和短期交易而设计。 稳定性:所有指标都不会重绘、不会重画和不会滞后,确保可靠的信号。 定制:支持自定义策略,以满足个人交易偏好。超过 7 种策略和组合可帮助您找到最佳策略。 信号清晰度:提供箭头信号,以指示清晰的入场和退出点。 实时警报:通过交易进出警报使交易者保持了解。 深入分析:提供更高时间框架的趋势分析和实时交易监控。 自适应颜色编码:利用蜡烛颜色编码来显示成交量、趋势和反转蜡烛信号。通过蜡烛颜色分析市场方向。 “智能趋势交易系统 MT5”赋予交易者必要的工具,以便在
PZ Harmonacci Patterns
PZ TRADING SLU
3.17 (6)
可以说,这是您可以为MetaTrader平台找到的最完整的谐波价格形成自动识别指标。它检测19种不同的模式,像您一样认真对待斐波那契投影,显示潜在的反转区域(PRZ),并找到合适的止损和获利水平。 [ 安装指南 | 更新指南 | 故障排除 | 常见问题 | 所有产品 ] 它检测19种不同的谐波价格形态 它绘制了主要,衍生和互补的斐波那契投影(PRZ) 它评估过去的价格走势并显示每个过去的形态 该指标分析其自身的质量和性能 它显示合适的止损和获利水平 它使用突破来表明合适的交易 它在图表上绘制所有样式比率 它实现了电子邮件/声音/视觉警报 受斯科特·M·卡尼(Scott M. Carney)的书的启发,该指标旨在满足最纯粹和最熟练的交易者的需求。但是,它采取了一种使交易更容易的方式:在向交易发出信号之前,它会等待Donchian朝正确方向突破,从而使交易信号非常可靠。 斐波那契投影与向量无关 它实现了电子邮件/声音/推送警报 它绘制了ABCD投影 重要提示: 为了符合 Scott M. Carney先生 的商标申诉,某些图案名称已重命名为不言自明的替代方式, Scott M.
Please send me Direct message on MQL5 CHAT after purchasing the Indicator for Training and Installation Support There are some additional files that is important to use with the Indicator . So be sure to contact me after purchasing the Indicator So that I can add you for training and support . If you find any difficulty with installation then send me Direct message here So that I can connect with you via Anydesk or Teamview for the product installation. " Smart Order Block Indicator " to find m
GoldRush Trend Arrow Signal
Kirk Lee Holloway
5 (2)
GoldRush 趨勢箭頭信號 GoldRush 趨勢箭頭信號 指標為 XAU/USD 中的高速、短期短線交易者提供精確、實時的趨勢分析。 專為1分鐘時間框架設計,此工具顯示方向箭頭以明確顯示入場點,使短線交易者能在波動市場中自信操作。 該指標包含主要和次要警示箭頭。主要信號為白色和黑色方向箭頭,用於指示趨勢方向的轉變;次要信號為藍色和紅色箭頭,用於確認主要箭頭指示的方向並提示潛在交易入場點。 注意:當趨勢方向發生變化後僅出現一個主要警報箭頭時,請注意可能會出現多個次要藍/紅箭頭。次要信號將在滿足信號標準的任何蠟燭圖後出現,因此在長期趨勢移動中,螢幕上將顯示大量次要箭頭(如附帶的截圖所示)。您可在設置中開啟或關閉任一箭頭類型。 以下是我使用此指標進行交易的方式: - 對於買入入場,我會耐心等待白箭頭在蠟燭收盤時出現,並在下一根可用蠟燭收盤時出現藍箭頭時進行買入交易。 - 對於賣出入場,我會耐心等待黑箭頭在蠟燭收盤時出現,並在下一根可用蠟燭收盤時出現紅箭頭時進行賣出交易。 - 獲利了結/止損設置由使用者自行負責,但我個人使用最低R:R為1:2,並發現這在倫敦/紐約開盤等
Dynamic Scalper System
Vitalyi Belyh
5 (1)
“ Dynamic Scalper System ”指标专为在趋势波内进行剥头皮交易而设计。 已在主要货币对和黄金上进行测试,并可与其他交易工具兼容。 提供顺势短线建仓信号,并提供额外的价格变动支持。 指标原理: 大箭头决定趋势方向。 在趋势波内,我们采用一种生成小箭头形式的剥头皮交易信号的算法。 红色箭头代表看涨方向,蓝色箭头代表看跌方向。 敏感的价格变动线会沿着趋势方向绘制,并与小箭头信号协同作用。 信号运作方式如下:当线在适当时刻出现时,将形成入场信号;在出现线时,持仓;线完成后,平仓。 建议的操作时间范围为M1 - H4。 箭头在当前K线上方形成,如果下一根K线已开仓,则不会重新绘制上一根K线上方的箭头。 输入参数 Trend Wave Period - 趋势方向(大箭头)的周期,改变趋势波的时间间隔。值 1 表示趋势方向的最长持续时间,参数值越大,持续时间越短。 Scalper Arrows Period - 信号箭头(小箭头)的计算周期,改变入场信号的生成频率。值 3 表示最频繁的生成频率,参数值越大,箭头频率越低,准确度越高。 这些参数可以根据不同的时间范
PZ Trend Trading
PZ TRADING SLU
4.8 (5)
许多盈利交易者不仅知道如何识别市场趋势,而且也能把握趋势建立后的交易机会。 Pz 趋势交易 指标设计用来在趋势行情中尽可能的赚取利润。 已建立的趋势提供了一揽子交易机会,但大多数趋势交易指标完全忽视了它们,让交易者在趋势行情时完全不知道该如何做!一般趋势指标只通知有关的趋势变化,但根本不足以得到卓越的回报. Pz 趋势交易 指标比一般趋势指标显示多达 20 倍的交易 , 因为它注重所谓的市场时机。它不仅显示当前的市场趋势,也有回调,内柱线的突破和调整。它令您在趋势回调之后介入,安全的柱线内突破金字塔加仓,以及发现潜在的反转,和已知的调整。 趋势改变 一个趋势改变在市场方向变化时发生。趋势变化在图表上用带数字的彩色圆圈显示。蓝色 (1) 信号为上涨开始, 而红色 (1) 信号为下跌开始。趋势变化并非评估当前价格动作的结果, 它意味着交易设置是不定时地。如果您正确使用本指标, 在趋势变化时, 您将将已经入场 (参看下面的调整)。 回调 但凡趋势在运动中,行情上下抖动,盈利者收割利润,且其它参与者入场。趋势回调代表好的买入机会,通常是由主力获利离场导致。如果行情在回调后回归上行, 指标将
GOLD Impulse with Alert
Bernhard Schweigert
4.67 (12)
这个指标是我们2个产品 Advanced Currency IMPULSE with ALERT  +   Currency Strength Exotics 的一个超级组合。 它适用于所有时间框架,并以图形方式显示8种主要货币和一种符号的强势或弱势冲动! 该指标专门用于显示任何符号的货币强度加速,如黄金、异国货币对、商品、指数或期货。这是它的第一个指标,任何符号都可以被添加到第9行,以显示黄金、白银、石油、DAX、US30、MXN、TRY、CNH等的真实货币强度加速(冲动或速度)。 建立在新的基础算法上,它使识别和确认潜在的交易更加容易。这是因为它以图形方式显示了一种货币的强势或弱势是否正在加速,并测量了这种加速的速度--把它想象成你汽车中的速度表。当你加速时,事情显然会发生得更快,这在外汇市场上也是一样的,即如果你配对的货币正在向相反的方向加速,你就会发现一个潜在的有利可图的交易。 动态市场斐波那契28水平被用作警报触发器,将适应市场活动。如果冲动击中黄色触发线,你将收到警报。然后你就知道作为一个交易员应该做什么。货币对和方向已经给出。只需点击警报按钮,就可以切换到该货
Advanced Supply Demand
Bernhard Schweigert
4.91 (300)
现在优惠 40%! 任何新手或专业交易者的最佳解决方案! 该指标是一款独特、高质量、且价格合理的交易工具,因为我们已经整合了许多专有功能和新公式。 依据此更新,您将能够显示双重时间帧区域。 您不仅可以显示一个较高的时间帧,还可以同时显示图表时间帧,加上更高的时间帧:显示嵌套时区。 供需双方所有交易者都会喜欢它。 :) 重要信息披露 高级供需的最大潜力,请访问 https://www.mql5.com/zh/blogs/post/720245   想象您的交易如何得以改善,是因为您能够精准定位入场或目标位吗? 构建于新的底层算法,它可以更轻松地识别出买卖双方之间的潜在失衡。 这是因为它以图形方式展示供需最强劲区域,及其过去的表现(显示旧区域)。 这些功能旨在帮助您更轻松地发现最佳入场区域和价位。 现在您可以针对您的交易品种和时间帧来优化和编辑区域强度! 高级供需指标适用于所有产品和时间帧。 它是一个新的公式,非常新的功能是两个区域强度函数可由用户输入进行调整! 这在交易中是一大优势。 当您学习如何使用专有功能,例如带有价格游离最小 X 因子的区域强度时,您能够判断该区域强劲与否。 供需
PZ Turning Points MT4
PZ TRADING SLU
1 (1)
该指标检查不同时期分形的价格结构,以确定市场中可能的反转点,从而为已经具有基本或技术估值模型的仓位交易者提供时机。与它的弟弟 Reversal Fractals不同 ,该指标不会因为所选时期而错过反转,并且会以之字形方式找到反转分形,而忽略那些没有足够动量来引发持续价格波动的反转。 [ 安装指南 | 更新指南 | 故障排除 | 常见问题 | 所有产品 ] 转折点可以开始长期趋势 指示器不重涂 它实现了各种警报 可自定义的颜色和尺寸 该指示符是无功或滞后信号,因为分形是奇数个条形的地层,是中间地带中最高或最低的条形,并且指示符在分形中的所有条形都闭合时绘制。但是,具有预先设定的方向偏差的交易者会发现该指标非常有用,可以提早进入切入点。 该指标既不是下探信号指标,也不是完整的交易系统。请不要这样评价或审查它。 输入参数 最小分形数:分形上的最小条形数。必须为奇数,例如3、5、7、9、11、13,... 最大分形:分形上的最大条形数量。必须为奇数,例如3、5、7、9、11、13 ... 最大历史柱数:指标加载时评估的过去柱数。 颜色:自定义箭头和线条的颜色和大小。 警报:启用或禁用各
PZ Support Resistance
PZ TRADING SLU
3.33 (3)
厌倦了绘制支撑线和阻力线? 支撑阻力 是一个多时间指标,可以自动检测并绘制图表中的支撑线和阻力线,并具有非常有趣的变化:随着时间的推移测试价格水平及其重要性的提高,线变得越来越粗。 [ 安装指南 | 更新指南 | 故障排除 | 常见问题 | 所有产品 ] 一夜之间增强您的技术分析 无需浏览图表即可检测重要的价格水平 一目了然地识别所有价格水平的相对优势 每次交易最多可节省半小时的绘图线 指标显示所有价格水平的期限 指示器不重涂 过去和现在的价格水平因接近程度而崩溃,并根据当前的市场行为进行了调整。在动作发生的地方绘制了线条,而不一定在峰值处绘制了线条。 价格水平随着时间的推移而被拒绝,变得越来越暗 定期清除不重要的价格水平以避免噪音 可自定义的时间范围选择和崩溃因子 它实现了电子邮件/声音/推送警报的突破 输入参数 指标设置:指标将从当前时间段读取价格,但您可以选择另一个。例如,您可以在H4图表中显示D1支撑线和阻力线。您还可以使用 价格水平密度 参数选择在图表上显示多少价格水平。 颜色设置:根据重要性输入所需的支撑线和阻力线颜色。 标签设置:(可选)可以在指示器中显示用于
They say history repeats itself. What if you could prove it in real-time? The Propfolio Ghost Pattern is an advanced algorithmic pattern-matching engine. It empowers you to select any current price action structure on your chart and instantly scan thousands of historical candles to find the exact moment in the past where the market did the exact same thing. Once it finds the highest probability match, it projects the historical outcome into the future as "Ghost Candles"—giving you a highly calcu
Atomic Analyst
Issam Kassas
5 (5)
首先值得强调的是,该交易指标是非重绘、非延迟的指标,这使其成为手动和机器人交易的理想选择。 用户手册:设置、输入和策略。 Atomic Analyst是一种PA价格行动指标,利用价格的力量和动量来寻找市场上更好的机会。配备了高级过滤器,可帮助去除噪音和假信号,并提高交易潜力。使用多层复杂的指标,Atomic Analyst扫描图表,并将复杂的数学计算转化为任何初学者都能理解并用来做出一致交易决策的简单信号和颜色。 “Atomic Analyst”是专为新手和经验丰富的交易者量身定制的综合交易解决方案。它将高级指标和一流功能融合为一体的交易策略,使其成为所有类型交易者的多功能选择。 日内交易和剥头皮策略:专为快速准确的日内交易和短期交易而设计。 日内和摆动交易策略:可用作追求价格大幅波动的日内和摆动交易者的可靠工具。 多货币和市场:凭借其可靠的精度,在不同的工具和市场上运作。 多个时间框架:可在多个时间框架上使用,性能良好。 稳定性:所有指标均不重绘、不重绘和不滞后,确保可靠的信号。 信号清晰度:提供箭头信号,用于清晰的入场和出场点。 实时警报:通过交易入场、SL和TP警报通知交易者
目前有26%的折扣!! 这个指标是我们两个主要指标( Advanced Currency Strength 28   &  Advanced Currency IMPULSE with ALERT )的一个超级组合。它显示了28个外汇对的TICK-UNITS货币强度值和警报信号。可以使用11种不同的Tick-Units。它们是1、2、3、4、5、6、10、12、15、20和30秒。子窗口中的Tick-Unit栏将被显示并向左移动,当在一秒钟的定时器中至少有一个Tick。 只用一个图表,你就可以剥28个外汇货币对的头皮!想象一下,你的剥头皮将如何提高。想象一下,你的剥头皮将如何改善,因为你能够准确地确定剥头皮机会的触发点? 这是市场上第一个在比1分钟更短的时间内工作的货币强度指标! 它是为那些希望快速进出并从市场中切出小点数的快速剥头皮者准备的。 用户手册:点击这里 https://www.mql5.com/en/blogs/post/727178 特点。 为28个货币对提供嘀嗒单位的卖出/买入警报,有一个按钮可以快速打开目标图表。 在3种敏感模式中选择一种(慢-中-快
KURAMA GOLD SIGNAL PRO(MT4版)— 7层过滤器、自动TP/SL、品质评分搭载 XAUUSD完整交易系统 不重绘。不重画。不延迟。每个信号永久固定。所见即所得。 福利:购买买断版许可证可免费获得 AI Zone Radar(价值$59)+ 完整PDF手册。购买后请给我发消息。 AI Zone Radar: https://www.mql5.com/en/market/product/175834 交易员的信赖:已被活跃的黄金交易员社区使用。因精度和易用性获得赞誉。 你的问题 — 以及解决方案 你知道黄金每天波动$30-50。你知道这里有钱可赚。但是: - 入场过早,价格反向$10后才朝你的方向走 - 每次MA触碰都入场,结果一半都失败 - 没有TP/SL系统,所以持仓太久或离场太早 - 在死寂时段交易,然后想为什么什么都不顺 KURAMA GOLD SIGNAL PRO解决了这一切。不是用一个过滤器,而是七个。 工作原理 — 3步 1. 图表上出现箭头信号 2. 在面板上查看TP价格、SL价格、品质评分、风险回报比 3. 下单并等待 无
购买后请联系我,获取基于此指标的奖励EA。 Self Optimizing Double MA Strategy 是一款专业级别的交易工具,旨在消除参数猜测。它由内置的自动优化引擎驱动,通过在后台模拟数千种参数组合,不断适应不断变化的市场条件,从而保持统计上的优势。 该指标不依赖于静态、过时的设置,而是动态更新其内部逻辑,为当前的时间周期和交易品种寻找最赚钱的配置。 核心功能 内置自动优化:系统会根据您选择的更新频率,定期重新计算快速 MA、慢速 MA 和 RSI 的周期,确保您的设置始终与当前的市场节奏保持一致。 MA 发散过滤器:一项核心的趋势强度指标,仅在移动平均线积极发散时才确认信号的有效性。这可以防止在均线收敛或平缓的盘整市场中产生虚假的入场信号。 时序评分引擎:内部模拟器在图表上绘制任何实时信号之前,会根据您的具体目标(例如最大化利润因子或最小化回撤)对历史信号进行评估。 动态 ATR 区域:根据实时市场波动率,自动计算并在图表上直观地投射出止盈和止损区域。 实时绩效仪表板:直接在您的图表上跟踪并显示实时的系统指标,包括历史胜率、平均回撤以及产生的总点数。 完美支持 EA
Advanced Currency Strength28 Indicator
Bernhard Schweigert
4.91 (657)
目前40%的折扣 任何新手或专家交易者的最佳解决方案! 这个指标是一个独特的、高质量的、可负担得起的交易工具,因为我们纳入了一些专有的功能和一个新的公式。只需一个图表,你就可以读出28个外汇对的货币强度!想象一下,你的交易将如何得到改善,因为你的交易是在你的手中进行的。想象一下,你的交易将如何改善,因为你能够准确地确定新趋势或剥头皮机会的触发点? 用户手册:点击这里  https://www.mql5.com/en/blogs/post/697384 这是第一本,原版的! 不要买一个毫无价值的崇拜者的克隆品。 特别的 子窗口中的箭头显示强劲的货币势头GAP将指导你的交易! 当基础货币或报价货币处于超卖/超买区域(外盘斐波那契水平)时,在个人图表的主窗口中出现警告信号。 当货币力量从外围区间回落时,回撤/反转警报。 十字星模式的特别警报 可选择多个时间框架,以快速查看趋势! 货币强度线在所有的时间框架中都非常平稳,当使用较高的时间框架来识别总体趋势,然后使用较短的时间框架来确定精确的入口时,效果非常好。你可以根据自己的意愿选择任何时间框架。每个时间框架都由其自身进行了优化。
Cyclic Impulse
Vitalyi Belyh
构建图表并识别周期性价格变动的技术指标。 可以在任何图表上工作。 几种类型的通知。 图表本身还有额外的箭头。 无需重新绘制历史记录,只需关闭蜡烛即可。 建议使用 M5 及以上的 TF。 易于使用和配置参数。 当使用 2 个具有不同参数的指标时,您可以单独使用它们,而无需其他指标。 有 2 个输入参数 周期性和信号持续时间 这两个参数处理图表结构的处理。 Cyclicity 调节反转周期的变化频率,平滑周期。 Signal duration 为最小数字,检测价格变动中的脉冲,最大长期趋势变动。    ---------------------------------------------------------------------------------------
KuKl
IGOR KIRIANEN
The indicator is built on a non-standard Zig Zag, it draws accumulations after which if the price leaves this zone and a test of this zone occurs, then a sound signal is given and an arrow appears - after the test candle closes.The indicator does not redraw its signals, it is very easy to use, there are only three settings 1- this is the zig zag parameter 2- this is the minimum price exit from the zone 3- this is the maximum price exit from the zone. The lower the parameter for Zig Zag, the more
Delta Fusion Pro
Francesco Secchi
5 (2)
Delta Fusion Pro – 高级订单流分析,专为日内交易设计 Delta Fusion Pro 是一款专业的 MetaTrader 4 指标,能够揭示市场中的主动订单流,实时显示机构压力的强度和方向。与传统的成交量指标不同,它分析买盘(Ask)与卖盘(Bid)之间的成交量差值(Delta),用于提前预测反转、确认趋势并识别专业兴趣区域。 主要特点 智能自动调节系统 根据以下条件自动调整所有参数: 交易品种类型(外汇、加密货币、指数、大宗商品、股票) 操作周期 市场波动率(ATR) 最近平均成交量 无需手动配置,适合新手交易者——指标自动完成校准! 核心功能 净Delta与累计Delta 计算主动买盘/卖盘成交量差值,支持自定义 EMA 平滑 实时显示方向性压力 可自定义直方图颜色(买入/卖出) 价格/成交量背离 自动检测常规与隐藏背离 强度分类:强/中/弱 高级过滤:成交量确认、趋势、时间距离 图形信号(彩色箭头) 市场失衡 识别显著的买盘/卖盘比例失衡(可配置比率) 最小成交量阈值验证 图表显示彩色点(多头/空头) Infusion Volume 检测异常成交量峰值(
Advanced Currency IMPULSE with ALERT
Bernhard Schweigert
4.9 (490)
目前40%的折扣!! 对任何新手或专家交易者来说都是最好的解决方案! 这个指标是一个独特的、高质量的、负担得起的交易工具,因为我们已经纳入了一些专有的功能和一个秘密的公式。只需一张图表,它就能给出所有28种货币对的警报。想象一下,你的交易将如何改善,因为你能够准确地确定新趋势或剥头皮机会的触发点 建立在新的基础算法上,它使识别和确认潜在交易变得更加容易。这是因为它以图形方式显示了一种货币的强势或弱势是否正在加速,并测量了这种加速的速度--把它想象成你汽车中的速度表。当你加速时,事情显然会发生得更快,这在外汇市场上也是一样的,即如果你配对的货币正在向相反的方向加速,你就会发现一个潜在的有利可图的交易。 货币动量的垂直线和箭头将指导你的交易! 动态的市场斐波那契23水平被用作警报触发器,将适应市场活动。如果冲动触及黄色触发线,您将在MetaTrader或您的电子邮件或推送警报中收到警报。然后你就知道作为一个交易员应该做什么。货币对和方向已经给出。只要点击警报按钮,就可以切换到该货币对或打开一个新的图表,以便进一步分析。警报级别可以通过用户输入来改变,可以选择3个敏感度级别。 尽
Bull versus Bear
Mohamed Hassan
4.5 (18)
Send us a message after your purchase to receive more information on how to get your  BONUS  for FREE  that works in great combination with Bull vs Bear ! Bull versus Bear is an easy-to-use Forex indicator that gives traders clear and accurate signals based on clear trend retests . Forget about lagging indicators or staring at charts for hours because  Bull vs Bear provides real-time entries with no lag and no repaint, so you can trade with confidence. Bull vs Bear  helps you enter trades during
Gold PL MTF 4
Sergei Linskii
Gold PL MTF - 這是一項優秀的股票技術指標。指標演算法分析資產價格的走勢,並使用斐波那契方法(黃金分割)自動反映指定時間範圍(TF)的重要樞軸水準。 此指標完美地描述所選時間範圍(日、週、月、年)的價格軌跡,確定趨勢的開始和修正的開始,並可能發展為相反的趨勢。 此指標也顯示不同時間範圍內目前未使用的樞軸水平,作為價格磁鐵。這使得您能夠快速評估市場狀況並做出進入和/或退出交易的決定。每筆交易的潛力平均為50至1000點。 此指標可讓您評估不同時間範圍內價格變動的可能方向,並顯示最可能的目標和價格變動的潛力。 指標的優點: 1. 指標產生高精度訊號。 2. 樞軸水平不會消失,也不會重新繪製。只有當趨勢強勁時,FP 緩衝區的確認箭頭訊號才能重建。 3.您可以在任何經紀商的MetaTrader 4交易平台上進行交易。 4. 您可以交易任何資產(貨幣、金屬、加密貨幣、股票、指數等)。 5. 建議中長期交易的時間範圍為 H1-H4。 6. 可以在指標設定中更改單獨的參數(TF,顏色等),以便每個交易者可以輕鬆地為自己自訂指標。 7. 此指標可作為您交易系統的優秀主要補充,也可
Gold Venamax MT4
Sergei Linskii
3 (2)
Gold Venamax   - 這是最好的股票技術指標。 此指標演算法分析資產的價格變動並反映波動性和潛在的進入區域。 指標特點: 這是一個帶有 Magic 和兩個趨勢箭頭塊的超級指標,可實現舒適且有利可圖的交易。 圖表上顯示用於切換方塊的紅色按鈕。 Magic 在指標設定中進行設置,以便您可以將指標安裝在顯示不同區塊的兩個圖表上。 Gold Venamax 可以放置在具有不同箭頭緩衝區(GV 和 SD)的兩個圖表上。 為此,您需要在設定中選擇不同的 Magic,例如,一個具有 Magic = 999,另一個具有 Magic = 666。接下來,您可以使用圖表上的紅色按鈕選擇箭頭緩衝區。 指標設定中的每個箭頭緩衝區(GV и SD)都有一個單獨的箭頭過濾器,以實現舒適且有利可圖的交易(UseFiltrGV = true; 和 UseFiltrSD = true;)。 進入的最佳訊號 = 遵循兩個緩衝區的訊號箭頭(GV 和 SD)+ 所有三個 MA 線(紅色或藍色)的方向 + TMA 通道邊界(下或上) 。 TMA 通道邊界(下限或上限)也可用於鎖定利潤和/或以較短的停損位進行逆
RFI levels PRO
Roman Podpora
5 (1)
该指标能够准确显示反转点和价格回落区域。     行业领军人物 。您能洞察新趋势的形成,并以最高的精准度做出决策,掌控每一笔交易。 与……结合时,展现其最大潜力     趋势线专业版   指标  VERSION MT5 该指标显示的内容: 新趋势开始时的反转结构和反转水平及其激活。 显示屏   获利了结   和   止损   风险回报比最低的水平     RR 1:2       。 具有智能减值逻辑的止损。 显示指定指标中两种趋势类型的反转形态。 指标: 根据     趋势线     (全球趋势变化) 潮流专业版     (趋势快速变化) 简单有效   扫描器   实时趋势(新增)。 多时间框架工具筛选。 展示   利润   在 LOGIC AI 信号之后。 以下列出今日走势积极的金融工具。(RB键) 能够为终端启用通知(警报)功能,并向移动设备推送通知。 逻辑人工智能     — 利用人工智能寻找最佳切入点。 只有在启用 MTF(多时间框架分析)模式时,该功能才可用。 兼容性。 当与趋势线指标结合使用时,该指标能发挥其最大潜力。 这     RFI LEVELS PRO    
Currency Strength Wizard
Oleg Rodin
4.85 (59)
货币强度向导是一个非常强大的指标,为您提供成功交易的一体化解决方案。该指标使用多个时间范围内所有货币的数据来计算这个或那个外汇对的力量。此数据以易于使用的货币指数和货币电力线的形式表示,您可以使用它们来查看这种或那种货币的力量。 您所需要的只是将指标附加到您要交易的图表上,该指标将向您显示您交易的货币的真实强度。该指标还向您显示买卖量压力的极值,您可以在顺势交易时利用这些压力。该指标还显示了基于斐波那契的可能目标。该指标可用于各种交易时间范围。该指标支持各种货币对的交易。 该指标为您提供所有类型的警报,包括推送通知。 购买后请联系我。我将与您分享我的交易技巧,并免费为您提供丰厚的红利指标! 祝您交易愉快,获利丰厚!
Smart Price Action Concepts
Issam Kassas
4.77 (13)
首先,值得强调的是,这个交易工具是非重绘、非重画和非滞后的指标,非常适合专业交易。 在线课程,用户手册和演示。 智能价格行动概念指标是一个非常强大的工具,既适用于新手,也适用于经验丰富的交易者。它将超过20个有用的指标合并到一个指标中,结合了高级交易思想,如内圈交易员分析和智能资金概念交易策略。该指标侧重于智能资金概念,提供有关大型机构交易方式的见解,帮助预测它们的动向。 它在流动性分析方面尤其擅长,有助于理解机构的交易方式。它擅长预测市场趋势,并仔细分析价格波动。通过将您的交易与机构策略对齐,您可以更准确地预测市场走向。该指标多才多艺,擅长分析市场结构,识别重要的订单区块,并识别各种模式。 它擅长识别BOS和CHoCH等模式,理解动量的转变,并突出显示供需强劲的关键区域。它还擅长发现强大的不平衡,并分析价格创造更高高点或更低低点的模式。如果您使用斐波那契回撤工具,该指标可以满足您的需求。它还可以识别相等的高点和低点,分析不同的时间框架,并通过仪表板显示数据。 对于使用更高级策略的交易者,该指标提供了工具,如公平价值差指标和优惠和折扣区域的识别。它特别关注高时间框架订单区块,并
NAM Divergences
NAM TECH GROUP, CORP.
5 (1)
MT4多時限發散和超買/超賣檢測指標。 特徵 -在圖表控制面板上完全可自定義,提供完整的交互。 -隨時隨地隱藏和顯示控制面板。 -有關非大寫差異的實時信息。 -有關超買/超賣情況的實時信息。 -有關規則差異的實時信息。 -有關隱藏分歧的實時信息。 -可用於發散檢測的振盪器:AO,RSI,CCI,MACD,STOCH,RMI,TDI,RSIOMA。 -通知服務(屏幕警報|推送通知)。 概括 使用差異交易有助於發現趨勢減弱或勢頭逆轉。有時,您甚至可以將其用作趨勢持續的信號。我們的工具在一個非常舒適和直觀的控制面板中同時提供所有時間範圍的差異檢測,並具有顯示和隱藏的可能性,以使您的圖表盡可能保持清潔。 您會在選擇的歷史時期實時看到超買和超賣情況,定期背離,隱藏背離和無資本背離。 對於沒有大寫字母的差異,我們會在屏幕上顯示MT4通知,並將通知推送到您的手機!
作者的更多信息
Entry Point M5 — 完整的交易系统 Entry Point M5 是一款强大的指标,被设计成一个功能完善的交易系统,适用于任何货币对。它能够分析价格结构,识别市场反转的关键时刻和新的趋势动能。该指标可以自动适应不同的市场阶段——无论是强趋势行情还是横盘震荡——都能提供清晰直观的交易信号,无需额外的过滤器或辅助工具。 使用这个系统的交易方式非常简单。当 绿色箭头 出现时,开立 买单(Buy) ;当 红色箭头 出现在图表上时,关闭所有买单并开立 卖单(Sell) ;当下一次绿色箭头出现时,关闭所有卖单并重新开立买单。这样,指标就形成了一个完整的交易系统,无需主观判断,只需严格遵循信号。 Entry Point M5 可用于任何货币对和大多数时间周期,包括 M1、M5、M15、H1 及更高周期。凭借内部的自适应公式,指标能够根据不同品种的波动性和价格尺度自动调整参数。 逻辑与工作原理 Entry Point M5 的核心是一个复杂的市场高低点(Pivot 点)识别系统,结合了智能假信号过滤机制以及价格偏离平均值的分析。算法综合了多种技术分析方法,从而最大程度减少虚假信号,只捕捉
XL arrow
Andrey Kozak
XL Arrow is a signal indicator that displays market entry points. The red arrow and the DOWN signal at the right corner indicate it is time to sell, while the blue arrow and the UP signal indicate it is time to buy. Settings PeriodSlower - indicator slowing period. PeriodFaster - indicator acceleration period. Recommendations trading pairs: EURUSD, GBPUSD and USDJPY timeframes: M5 - H4
Quantum
Andrey Kozak
The Quantum Expert Advisor is designed for trading EURUSD H1 . The trading algorithm lies in placing pending orders at the peaks of currency fluctuations, after a preliminary analysis of the market conditions. Trading is fully automated. Lot size is calculated automatically based on the lot percentage. Parameters MaxRisk - percentage of the deposit, used for the automatic calculation of the lot. LongWave - long wave of price fluctuation. ShortWave - short wave of price fluctuation. Level contro
BoxetFx
Andrey Kozak
The BoxetFx Expert Advisor analyzes the market using multiple trading strategies. Once the optimal signals for opening trades are obtained, the EA automatically determines the order volume as a percentage pf the deposit. Next, a pending order is placed in the direction of the expected price movement. When the deal reaches an optimal profit or loss level, it is automatically closed. Multiple analytical centers of information processing allow the EA to diversify the possible risks of the trader by
Medok
Andrey Kozak
The Medok indicator shows the market entry and exit points on the chart using arrows and resistance lines. The indicator is very easy to use. Buy when a blue arrow appears and sell when a red arrow appears. After an order is opened, it is recommended to close a buy position when the price reaches the lower resistance level or to close a sell position when the price reaches the upper resistance level. Recommended values for EURUSD H1 Periods - 2; Acceleration - 0.02. Recommended values for EURU
TOP Xios
Andrey Kozak
TOP Xios is a ready-made trading system, which provides the trader with signals for opening and closing deals. The information panel in the right corner of the screen shows the total number of signals, the number of points in profit or loss and the percentage of valid and false signals. Working with this indicator is very simple. As soon as a blue arrow appears, open a buy deal and wait for a red cross to appear, which indicates the necessity to close the deal. When a red arrow appears, open a s
Buy Market Scanner is a ready-made trading system, which shows the moments when it is necessary to open or close deals. Buy arrows appear on the zero bar without delay and redrawing. The same applies to signals for closing orders. They appear on the zero bar and are not redrawn. The number of profit or loss in points for a certain time period is displayed in the top right corner of the indicator. The indicator works best on the EURUSD currency pair with the H1 timeframe. Operation Principles In
DayWay
Andrey Kozak
The DayWay indicator shows the current trend direction on the chart as a colored line. The best timeframes for operation are M5 and higher. Works on all currency pairs. Suitable for any scalping strategies. Quite easy to use. Recommendations on usage When a blue line appears, wait for a candle to close and open a buy order. When a red line appears, wait for the current candle to close and open a sell order. Parameters Periods - period of the indicator.
Forex Gump
Andrey Kozak
2.4 (5)
Forex Gump is a fully finished semi-automatic trading system. In the form of arrows, signals are displayed on the screen for opening and closing deals. All you need is to follow the instructions of the indicator. When the indicator shows a blue arrow, you need to open a buy order. When the indicator shows a red arrow, you need to open a sell order. Close orders when the indicator draws a yellow cross. In order to get the most effective result, we recommend using the timeframes H1, H4, D1. There
Leo Trend
Andrey Kozak
Leo Trend is a signal indicator that shows the market entry points, as well as the trend direction and flat on the chart in the form of arrows and lines. Leo Trend will be useful both for beginners creating a trading strategy, and for professionals to integrate into ready-made trading systems. Leo Trend works without redrawing and without significant delays. The operation of the indicator is demonstrated in the video. In addition, you can test this indicator in the strategy tester free of charge
Nizma
Andrey Kozak
NIZMA is a ready-made trading system, that is the most efficient on the EURUSD, AUDUSD and GBPUSD currency pairs. The best timeframes are M5 and higher. The system shows the market entry points in the form of arrows, and also displays the information on the strength and direction of the trend. The signals are easy to interpret. It is suitable for both novice and professional traders. With the properly selected settings, it gives the minimum number of false signals. In tests, this number did not
XPointer
Andrey Kozak
5 (3)
XPointer is a completely ready trading system. It shows the trader when to open and close a trade. It works on all currency pairs and all time frames. Very easy to use and does not require additional indicators for its operation. Even a beginner trader can start working with XPointer. But it will also be useful for professional traders to confirm the opening of orders. Features of the XPointer indicator It does not redraw its values. It works on all currency pairs and all time frames. It has al
Lobster
Andrey Kozak
Lobster is a ready-made trading system with a flexible market analysis algorithm. It performs most of the work for a trader. All you have to do is open and close orders following the indicator signals. The indicator will be very useful for both beginners and professionals. It is able to work with other indicators and independently. Features No signal repainting; Any pair; Any timeframe; Flexible market analysis system. How to trade When the blue arrow appears, open a buy order; When the blue c
Gets
Andrey Kozak
Gets is a smart trading system with complex market analysis mechanism. The operation principle of Gets is based on neural networks and diversified collection of information from various market analyzers. Then the system analyzes the statistical databases to create a general idea of the current market situation and the further price movement. The information is displayed on the screen in a simple and intuitive way - in the form of buy and sell arrows. Also, the information on the current trend st
Scalper Zoom
Andrey Kozak
Scalper Zoom is a new trading system designed to facilitate the process of Forex trading both for beginners and professionals. The Scalper Zoom indicator uses an adaptive method of operation and analyzes the market using multiple trading algorithms, while selecting the most efficient one for the given currency pair and timeframe. Working with this indicator is very simple. When a red vertical line appears, open a sell order. Close it when a blue vertical line appears. Follow the opposite steps f
Brabux
Andrey Kozak
Brabux is a ready-made mechanical trading system. It works on all currency pairs and timeframes automatically adjusting to them. It also selects the most efficient trading parameters for receiving a necessary profit. In the indicator parameters, specify the trading period used for calculations and the least acceptable profit in points. Next, the system automatically selects the necessary trading parameters. Trading data is displayed on the info panel. After setting the indicator on the chart and
CoolLine
Andrey Kozak
CoolLine is a signal indicator displaying on a chart points for opening and closing trade positions. The indicator signals are not redrawn. It draws arrows on the zero bar Open[0]. It works on all currency pairs and all time frames. Indicator Advantages Precisely shows the opening and closing points on the chart Does not redraw signals Works on all currency pairs and timeframes Very easy to use; suitable even for beginners Has a very flexible system of settings Can send push and email notificat
Market Scanner Elite is a new generation of indicators of the Market Scanner series. The Elite version features an improved market analysis algorithm, with a better identification of the entry points and filtering of the false signals. The logic of market analysis and calculation of effective entry points applied in this product are significantly different from those applied in Market Scanner . This indicator cannot be called a big brother, as it is a completely new product with innovative analy
The Master Figures indicator analyzed the market for the most common chart patterns. The first pattern is called Pin bar . This pattern can rightly be considered one of the most widespread. This pattern looks like a candle with a small body and large tail (wick). Once you see it on the chart, open a position against the wick. It is better to use the resistance lines for closing. Master Figures shows this pattern in the form of circles. A position should be opened when a new candle appears after
Forex Gump Pro
Andrey Kozak
4 (5)
Attention! Friends, since there have been many scammers on the Internet recently selling indicators called ForexGump, we decided to warn you that only on our page is the LICENSE AUTHOR'S VERSION of the INDICATOR sold! We do not sell this indicator on other sites at a price lower than this! All indicators are sold cheaper - fakes! And even more often sold demo versions that stop working in a week! Therefore, in order not to risk your money, buy this indicator only on this site! Forex Gump Pro is
Market Trend
Andrey Kozak
Market Trend - a comprehensive system for determining the trend direction. Analyzes the market using a formula which considers the values of multiple technical indicators and other trading strategies. IT determines not only the current trend direction, but also its movement strength. The indicator is intuitive and very easy to use. The information on the current trend direction and its movement strength are displayed on the chart. If the indicator shows "UP!" then an uptrend is currently present
Aggressive intraday scalper is a mechanical system for intraday scalping, which displays trade opening and closing signals as arrows on the chart. When a signal emerges, the indicator sends email and push notifications. So, you don't have to stay by the monitor analyzing the market and waiting for a signal. Aggressive intraday scalper will do it for you. The system has been developed for those traders who do not have their own trading system and who would love to quickly start trading using the
Jerus Line Scalper is an indicator for scalping on EURUSD, GBPUSD, AUDUSD, USDJPY and USDCAD pairs. Recommended pairs: M5, M15, M30 and H1. The trading strategy is as follows: as soon as the arrow appears, open an order in the direction of the arrow and set take profit to +10 points. Set stop loss at the indicator's stop line. Stop line is displayed in red or blue depending on the indicator signal. Also, the Martingale system can be applied in the system. If a trade is closed at a loss, the next
DotaScalping
Andrey Kozak
DotaScalping is a semi-automated trading system for scalping. The indicator shows recommended moments for opening Buy/Sell trades as dots on the chart. Signals are generated based on the algorithm for price amplitude smoothing. The indicator tries to accurately calculate the moments of the maximum peak price values ​​and produces signals based on the smoothed correlation. The indicator determines the High and Low price values and generates signals based on the trend direction. The indicator is v
ForexGumpUltra
Andrey Kozak
3.25 (4)
ForexGumpUltra is a new and more advanced indicator of the ForexGump series. This indicator easily determines the price direction on any currency pair and any timeframe. The indicator draws its signals on the zero bar and does not redraw them (see the video). In the 34th second of the video it can be seen that this indicator uses new filters to determine the changes in price movement direction without delay, despite the market noise present at the moment (see the video on the 34th second). Once
Forex Gump Scalping
Andrey Kozak
5 (2)
Attention! Friends, since there have been many scammers on the Internet recently selling indicators called ForexGump, we decided to warn you that only on our page is the LICENSE AUTHOR'S VERSION of the INDICATOR sold! We do not sell this indicator on other sites at a price lower than this! All indicators are sold cheaper - fakes! And even more often sold demo versions that stop working in a week! Therefore, in order not to risk your money, buy this indicator only on this site! Forex Gump Scalpin
Bomb Scalper
Andrey Kozak
Bomb Scalper is a ready-made mechanical trading system that analyzes the market using 12 market signals, as well as candle patterns, providing signals for opening and closing trades. On the screenshot below, you can see how the system draws the blue arrow for buying and the red one for selling. Order close signal is shown as the yellow arrow. Besides, during a closing signal, the indicator calculates potential profit/loss. How the indicator works After launching, Bomb Scalper navigates through
Striker
Andrey Kozak
Stiker is a robot capable of trading in automatic or semi-automatic mode . If auto=true in the robot settings, the robot automatically opens and closes orders on its own when a signal appears. If auto=false, the robot analyzes the market and shows signals on the screen, while a trader manually confirms opening or closing orders by clicking the Open Buy and Close Order buttons. This is done to enable traders make trading decisions themselves. This reduces the trading risk. Striker is a smart syst
If you do not yet have your trading strategy, you can take advantage of our ready-made trading strategy, which is most effective for EURUSD H1 currency pair. The indicator "Ready Made Scalping System" automatically analyzes the market and shows the trader when to open and close orders. You just need to follow his instructions. When the arrow appears - open the order, when a square appears with a tick - close the warrant. For convenience of the trader, the indicator when signals appear sends a m
Amok
Andrey Kozak
Amok is a fully automatic trading system that was developed for trading on the EURUSD currency pair, H1 timeframe on micro accounts. Nevertheless, as practice shows, this trading system works well in other currency pairs. Principle of work of the trading robot Amok In the algorithm of the robot, there are more than 7 different trading strategies. This was done to ensure that the robot could work more stably in different market conditions. The program part of the robot uses 12 different indicato
筛选:
无评论
回复评论