DFG Chart

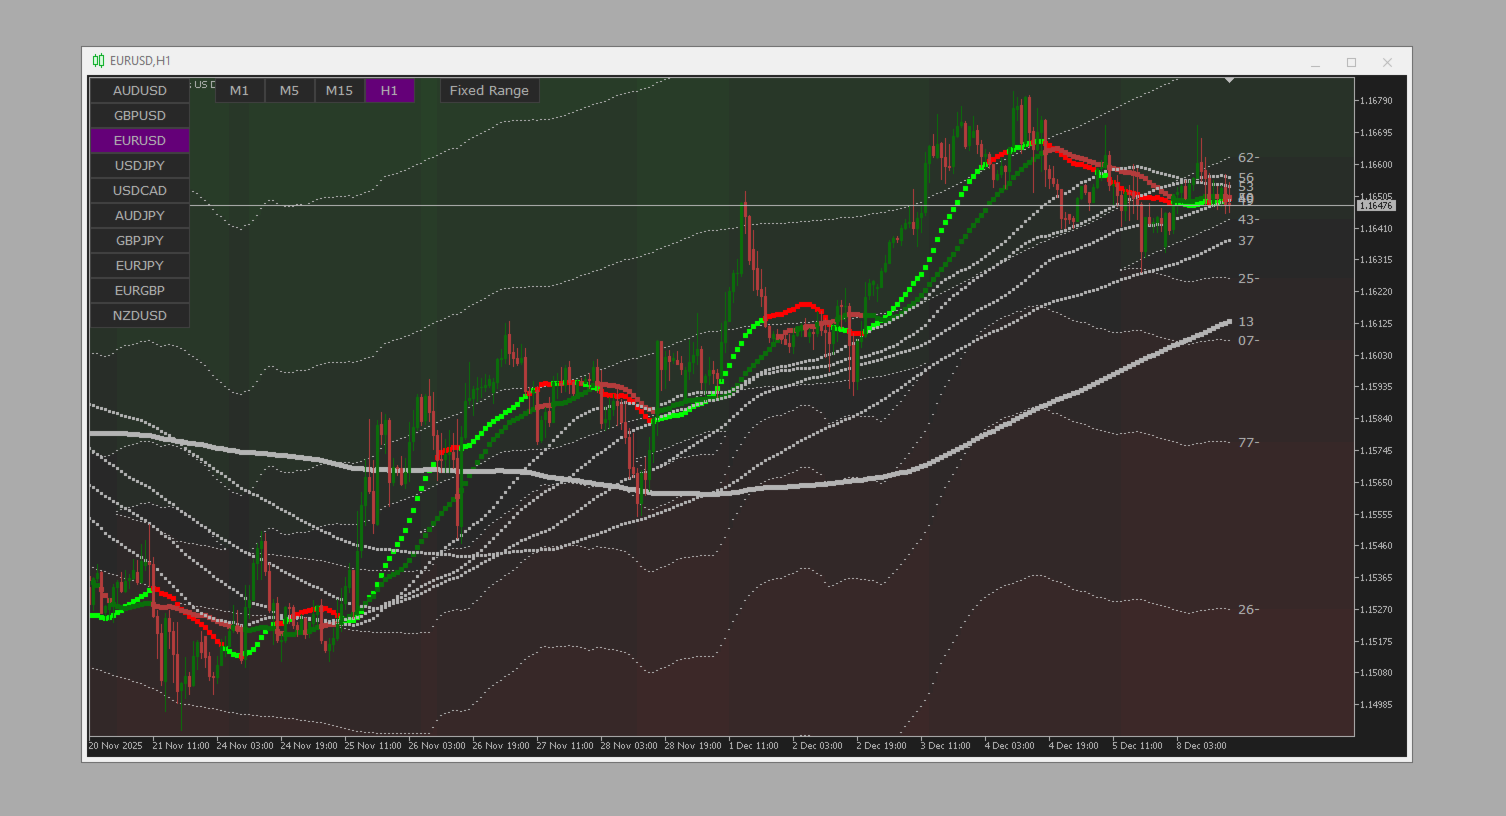
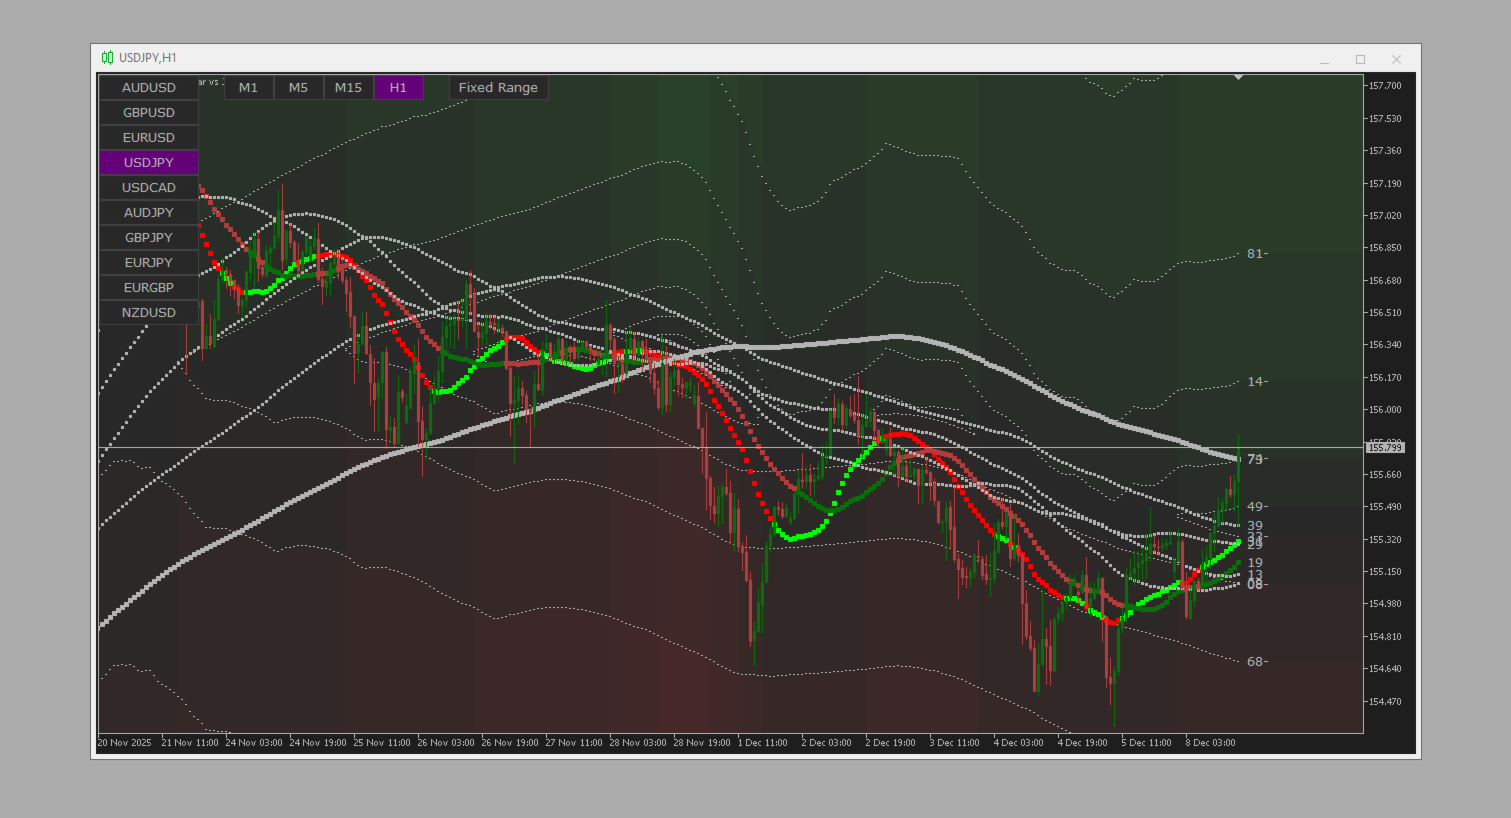
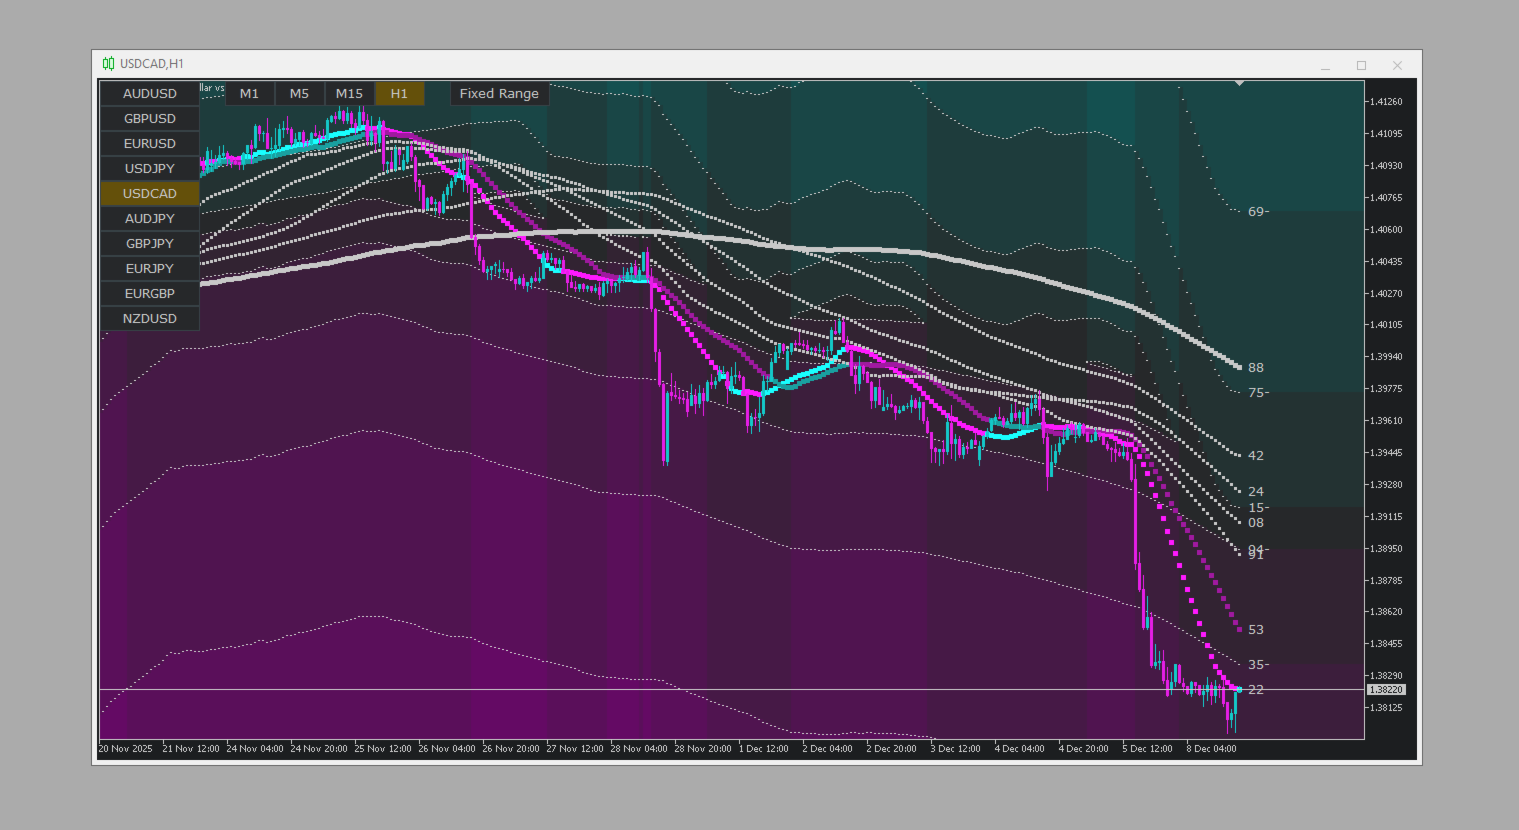
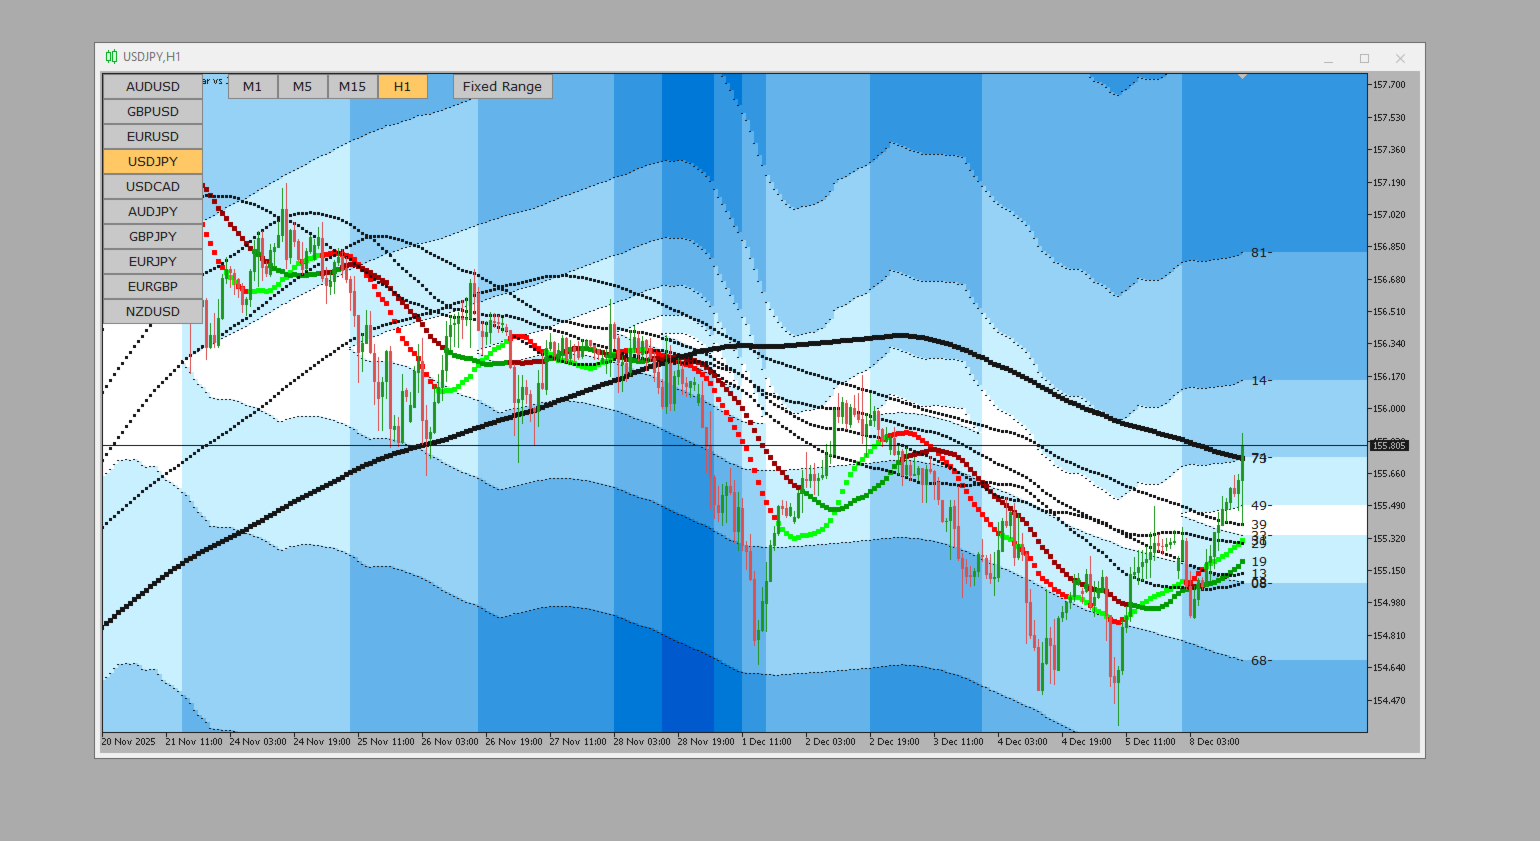
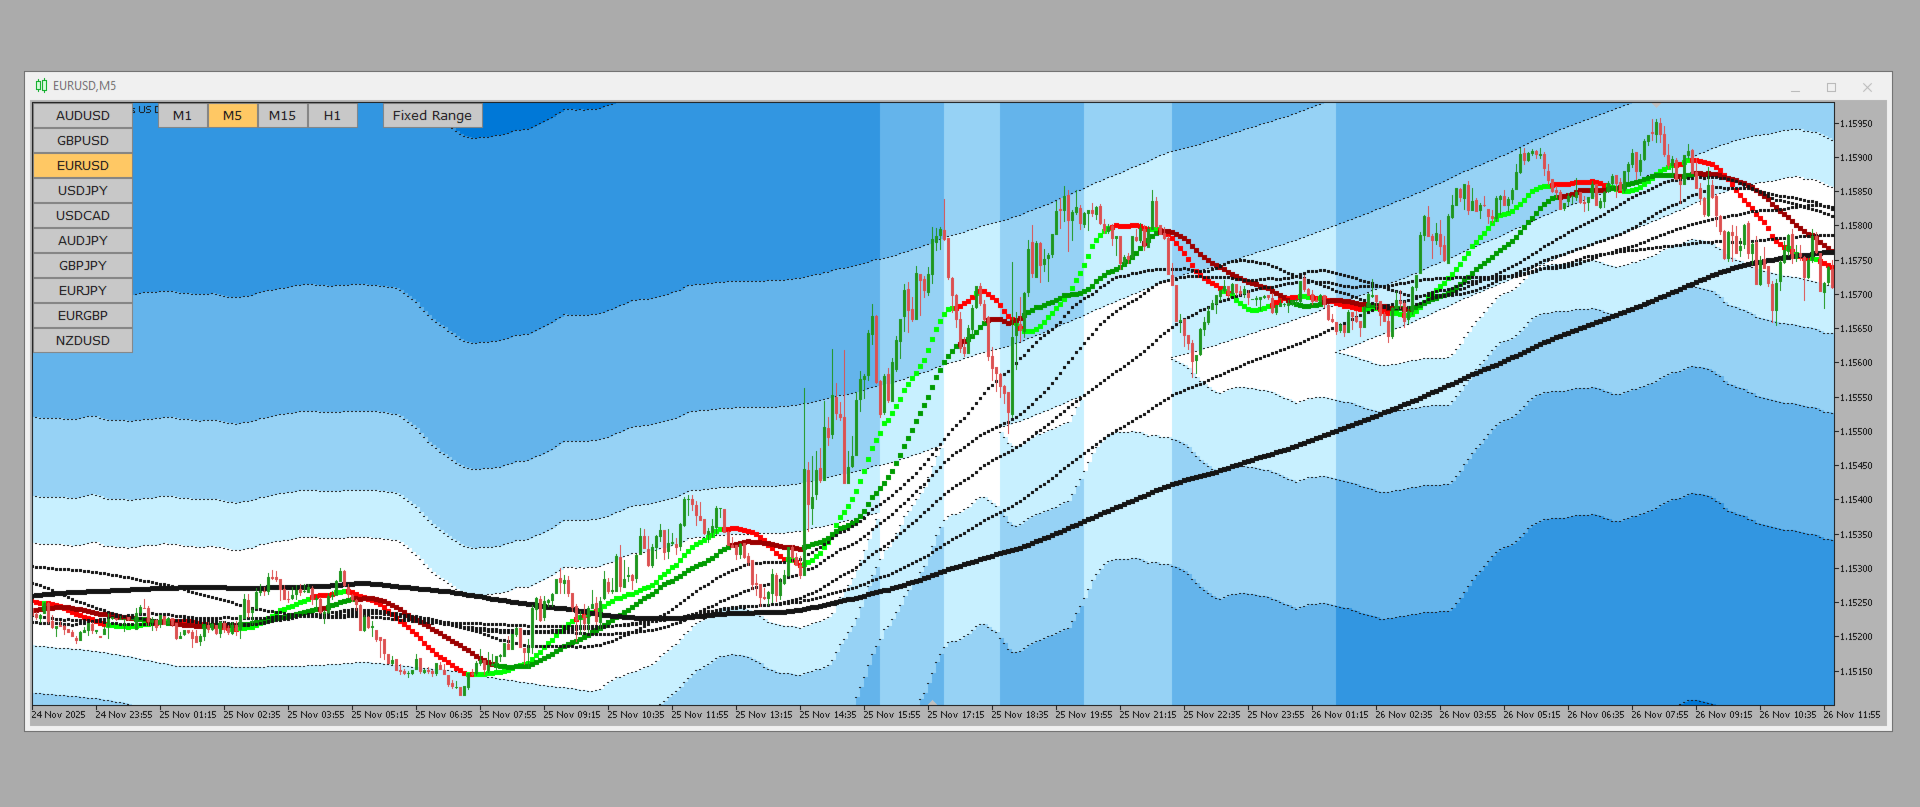
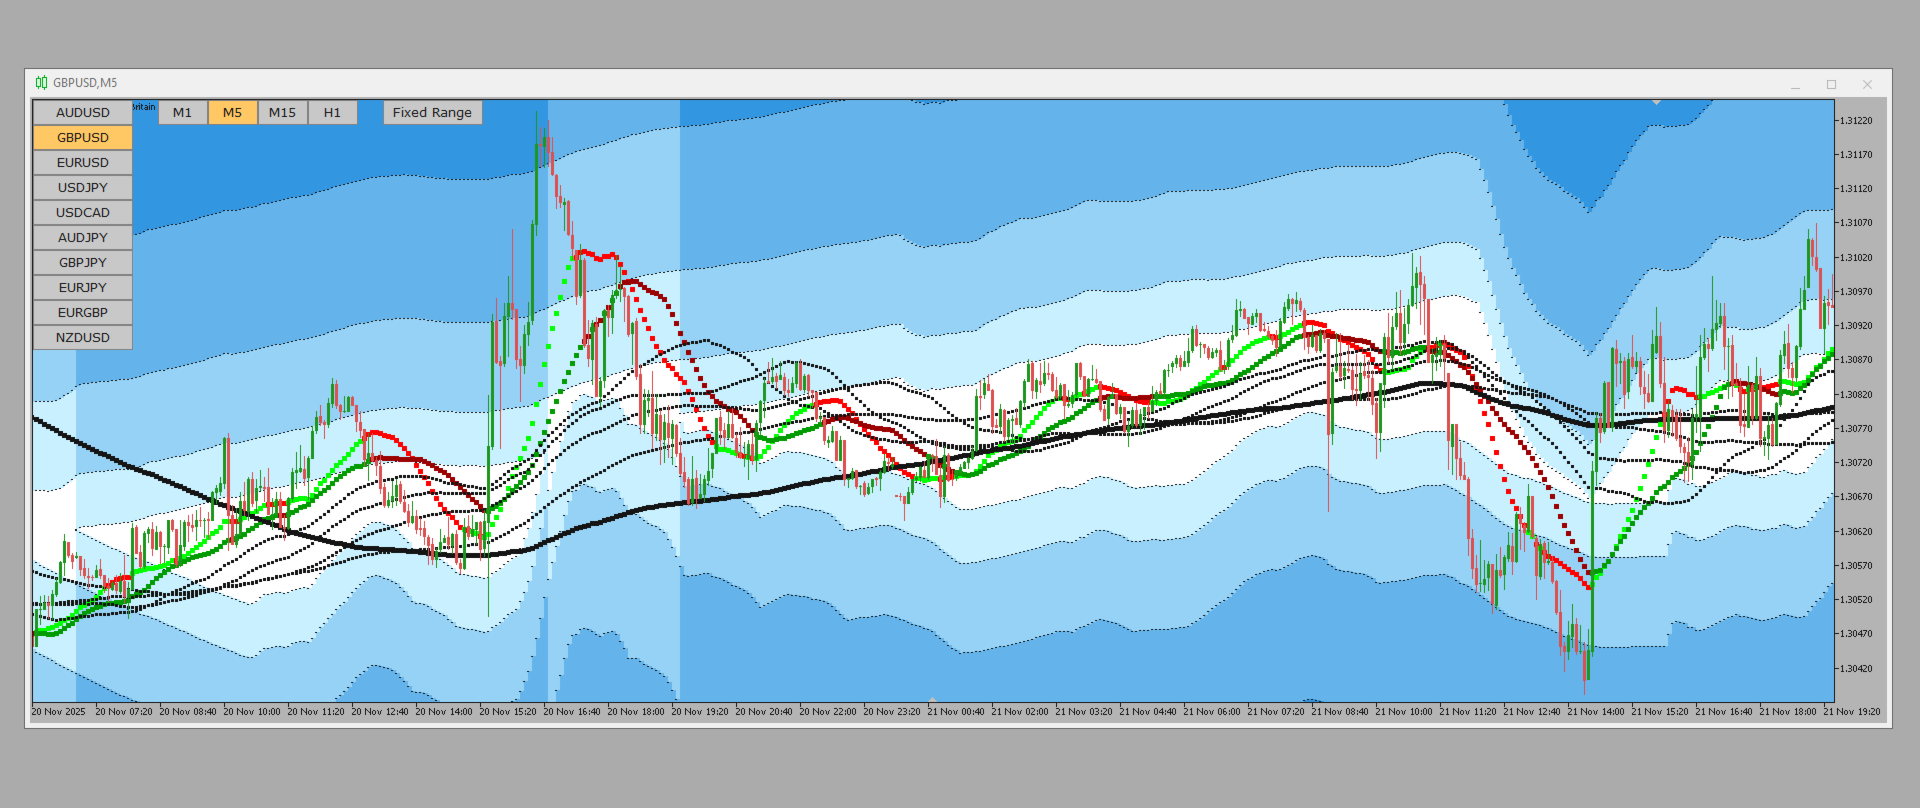
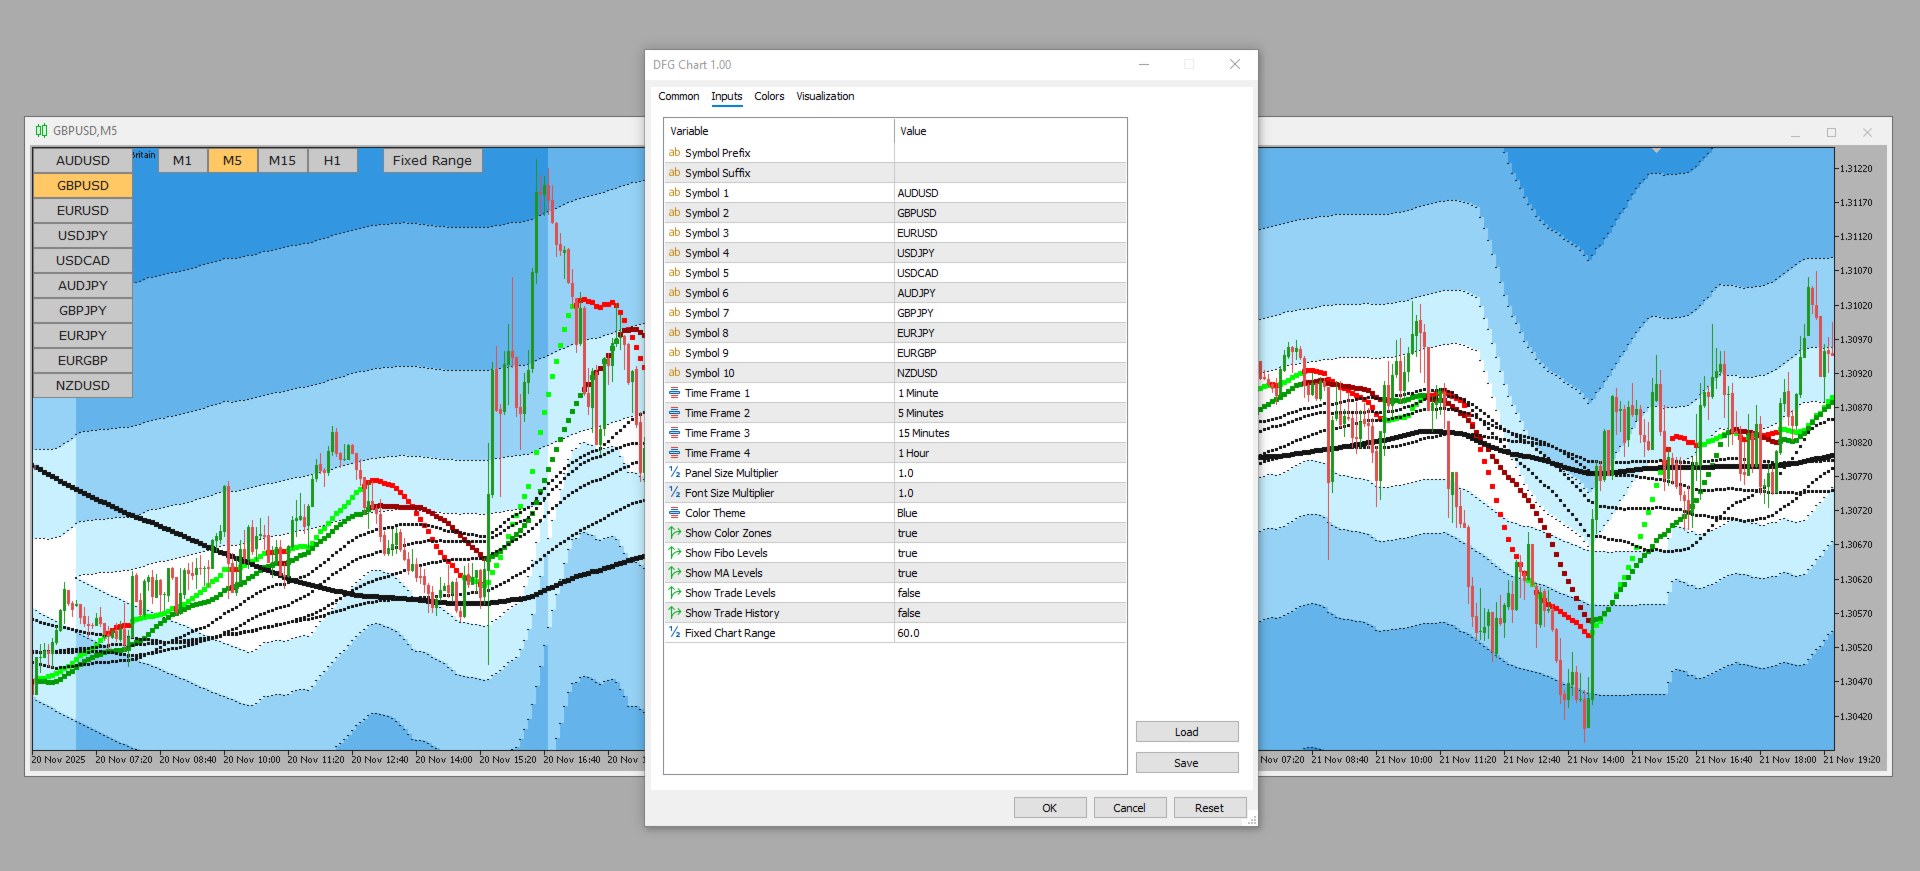
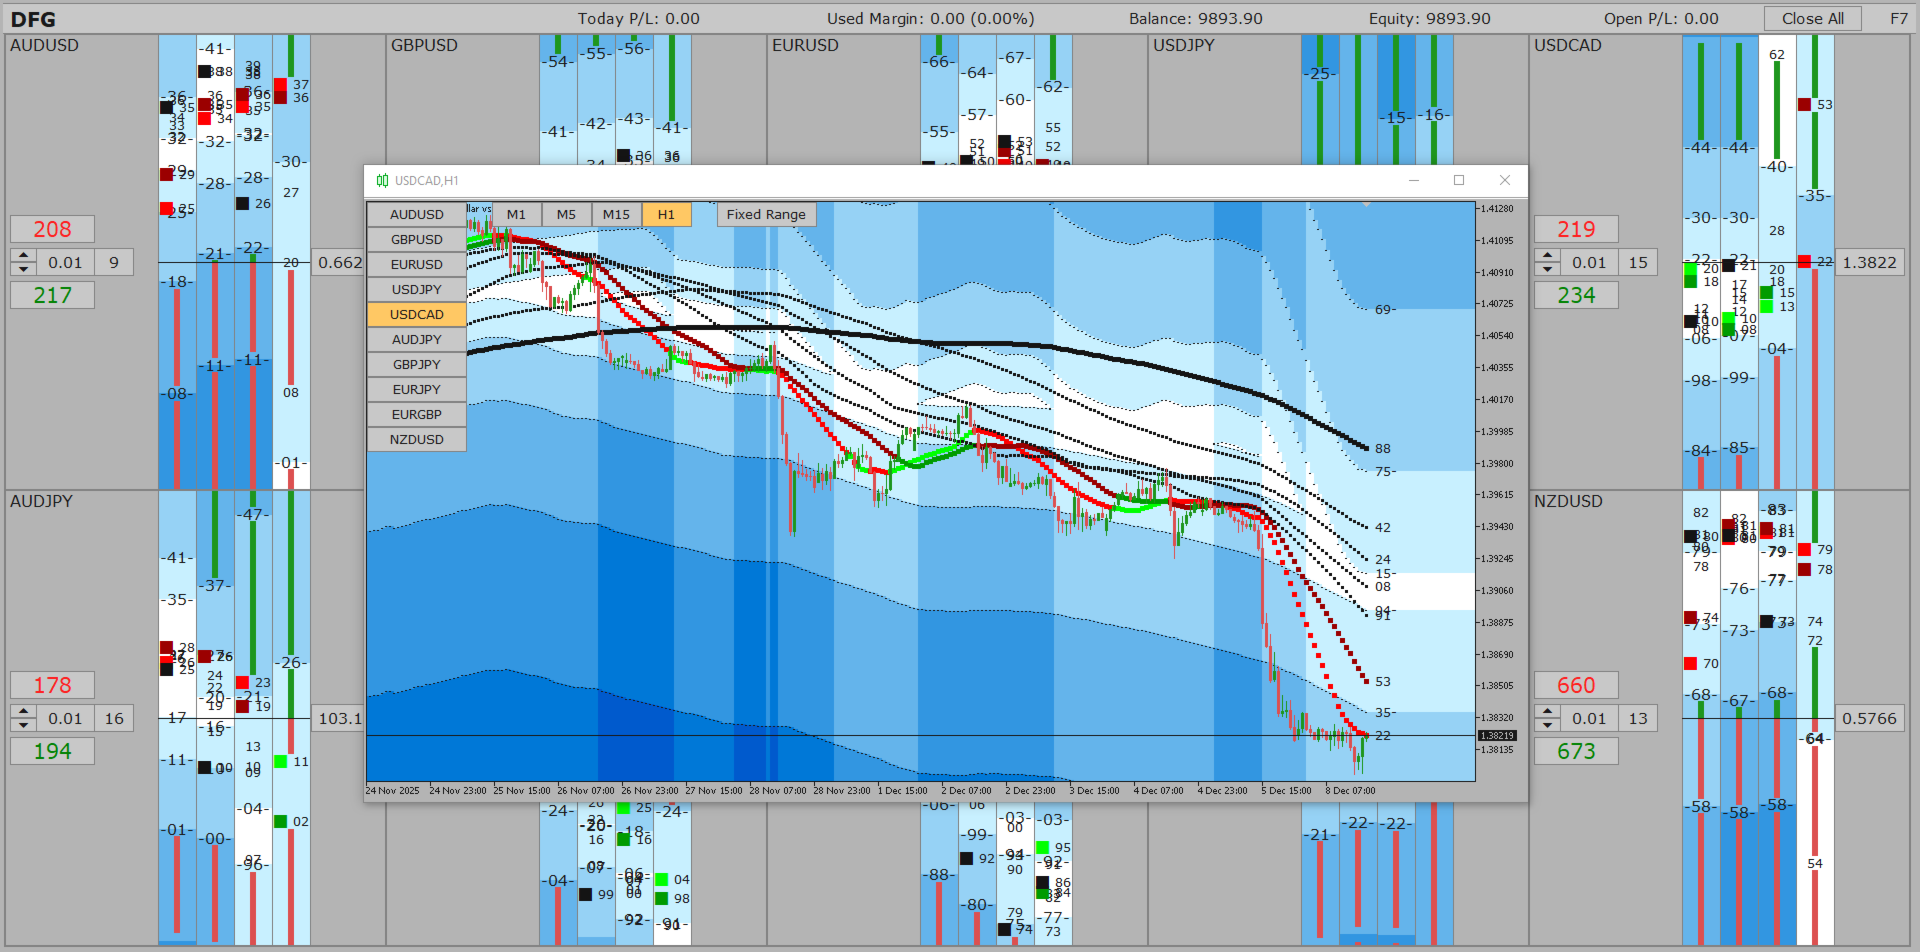
The DFG Chart Indicator displays the historical DFG levels used in the DFG dashboard. These levels are generated dynamically using moving averages and Fibonacci ratios. The Fibonacci Bands automatically adjust to reflect changes in the price range and trend direction. The indicator also features buttons for selecting chart symbol and timeframe, along with a wide range of customization options.

Key Features

  • Dynamic DFG Levels
    Automatically calculated using moving averages and Fibonacci ratios.

  • Historical Level Visualization
    Displays the history of DFG levels as shown in the DFG dashboard.

  • Adaptive Fibonacci Bands
    Fibonacci bands adjust automatically based on changes in the price range and trend direction.

  • Symbol & Timeframe Selector
    Built-in buttons allow quick switching between chart symbols and timeframes.

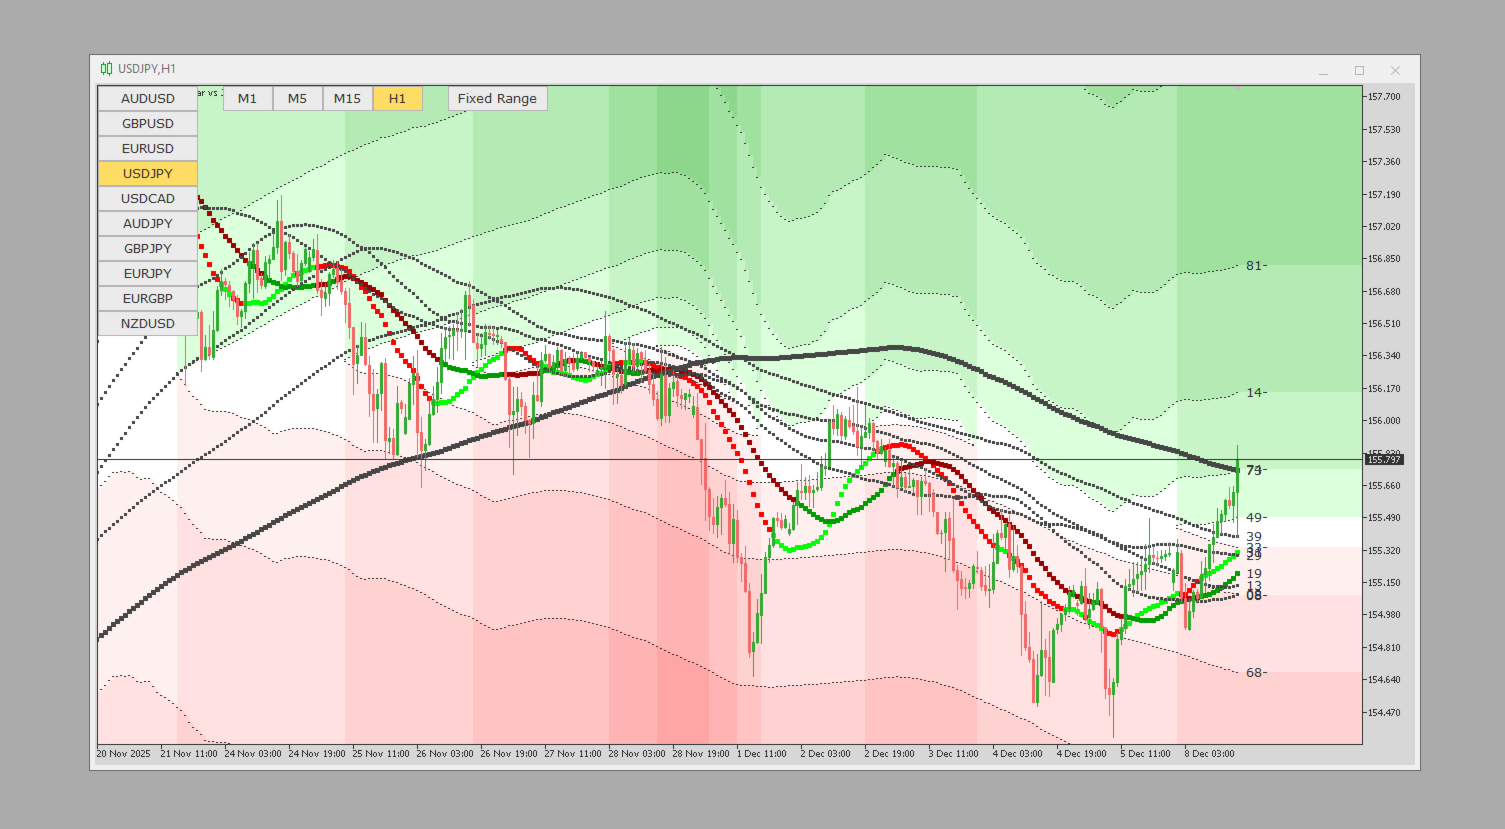
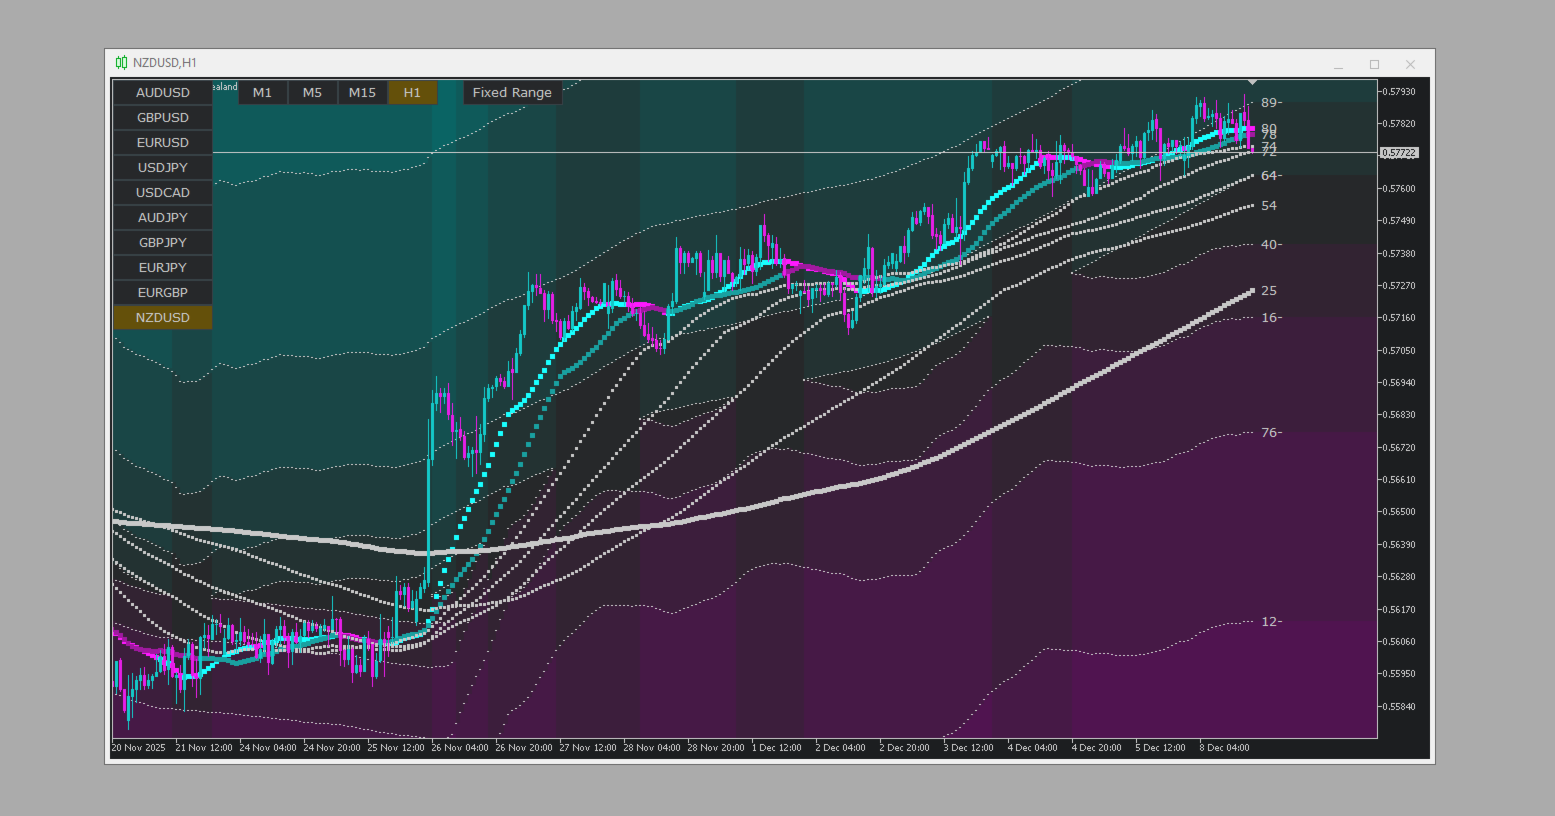
  • Customization Options
    Numerous settings for tailoring the indicator’s appearance. The settings and color themes of DFG Chart match those of the DFG Dashboard.


推荐产品
This indicator is a **Pivot-Confluence Zone Identifier** that focuses exclusively on identifying key support and resistance levels where price clusters align with classic pivot points. Here's what it does: ## Core Functionality **Pivot Confluence Detection**:  - Only displays price zones that align with classic pivot point levels (R1, R2, R3, S1, S2, S3) - **Excludes the main pivot point** - focuses only on support and resistance levels - Uses a configurable pip range to detect confluence nea
FREE
AVT Pro
Noor Alam
Features:  1. Buy arrows= when Up trend start. 2.Sell arrows = when Down trend start  3.Alert System= when Signal appear then Mt5 itself Pop up a alert Box. 4. You can get notifications on your phone real time through Mt5 app. Note: this indicator will work on trending market. So try to trade volatile market. Best Pair: Only trade in New York session  NASDAQ (US100) S&P ( US500) Dow Jones (US30) Note : Don't Trade Forex pair.
FREE
The   DailyWeeklyMarkers   indicator helps traders visualize trading weeks by clearly marking the start of each day and week on the chart. It draws vertical separator lines for each day (including weekends if enabled) and highlights the beginning of new trading weeks with double lines for better clarity. This makes it easier to analyze price action within daily and weekly contexts. Who Is This Indicator For? Swing Traders   – Helps identify weekly opening gaps and key levels. Day Traders   – Vis
FREE
Analysis Professor
Israr Hussain Shah
FiboPivot Dashboard - Professional Pivot Point Indicator What It Does FiboPivot Dashboard is a powerful technical analysis tool that automatically calculates and displays Fibonacci-based pivot points on your chart. It identifies key support and resistance levels based on the previous day's price action, helping traders anticipate potential price reversal points and breakout levels.   How to Use 1. **Install & Apply**: Simply attach the indicator to any chart (time frames below D1) 2. **
FREE
Pivot Classic, Woodie, Camarilla, Fibonacci and Demark Floor/Classic Pivot points, or simply pivots, are useful for identifying potential support/resistance levels, trading ranges, trend reversals, and market sentiment by examining an asset's high, low, and closing values. The Floor/Classic Pivot Points can be calculated as follows. Pivot Point (P) = (High + Low + Close)/3 S1 = P * 2 - High S2 = P - (High - Low) S3 = Low – 2*(High - P) R1 = P * 2 - Low R2 = P + (High - Low) R3 = High + 2*(P - Lo
FREE
The CPR (Central Pivot Range) Indicator is a powerful technical analysis tool designed to identify key support and resistance levels on your MetaTrader 5 charts. It calculates the Central Pivot (CP) as the average of the previous day's high, low, and close prices, providing a central reference point. Calculates and plots 11 pivot levels (CP, BC, TC, S1-S4, R1-R4) Adjustable lookback period (default: 5 days) Option to show or hide price labels with customizable size and offset Fully customizable
FREE
Pivots Lines
Abakou Nazaire Ayelenou
5 (1)
FREE
前一版本指标的发展 ZigZag WaveSize MT4 ZigZag WaveSize - 修改后的标准锯齿指标,增加了波浪长度、水平和不同警报逻辑的信息 一般改进: 为MetaTrader 5适配代码 优化了图形对象的操作 新特性: 极值处的水平线 选择水平类型:水平线/射线/线段 液性水平滤波器(未被价格突破) 突破缓冲区:设置对错误突破的敏感度 标签设置和功能:数量、外观、删除旧标签 结构突破警报(BoS) 移动性质变化警报(ChoCH) 优化: 修正更新极值的逻辑 动态更新新对象 减少新柱出现时的负载 集中的标签系统 修复: 修复了数组越界问题 正确的标签定位 删除了重复的参数 将ZigZag WaveSize指标作为您交易系统的补充使用   也可以尝试我在市场上的其他产品  https://www.mql5.com/ru/users/capitalplus/seller 如果您喜欢该指标,请对其进行评分并留下评论,这对我来说非常重要! 祝您交易获利丰厚!
FREE
The   Pivot Point indicator   automatically calculates and displays the pivot point line and support and resistance levels. Pivot can be calculated according to the Classic, Floor, Fibonacci, Woodie, Camarilla or DeMark formula. It is also possible to select the period for calculating the indicator. A trader can choose from daily, weekly, monthly, or user-defined periods. Types of pivots Classic Floor Fibonacci Woodie Camarilla DeMark Main features The indicator shows the current and historic
FREE
Cybertrade Keltner Channels
Emanuel Andriato
4.75 (4)
Cybertrade Keltner Channels - MT5 Created by Chester Keltner, this is a volatility indicator used by technical analysis. It is possible to follow the trend of financial asset prices and generate support and resistance patterns. In addition, envelopes are a way of tracking volatility in order to identify opportunities to buy and sell these assets. It works on periods longer than the period visible on the chart. All values ​​are available in the form of buffers to simplify possible automations.
FREE
Auto Fibo Retracement MT5
Nguyen Tuan Son
5 (10)
Auto Fibonacci Retracement Indicator — Flexible and Reliable This isn’t just another Auto Fibonacci Retracement indicator. It’s one of the most flexible and dependable tools available . If you find it useful, please consider leaving a review or comment — your feedback means a lot! Check out my other helpful tools below: Smart Alert Manager   - Set up advanced alerts and send them to Mobile, Telegram, Discord, Webhook... Timeframes Trend Scanner    - Scan the trend of assets in difference timefr
FREE
Hunttern ZigZag MT5
Hassan Gh Fakhraei
5 (1)
Hunt markets with Hunttern ZigZag . Easy to use with one parameter    You can use it for the following:       -Classic patterns       -Heads and shoulders       -Harmonic patterns       -Elliott Wave       -Support and resistance       -Supply and Demand Single parameter:      -Period (1-120) Features:        -Candle time        -Single parameter        -Light mode template This is version 1 of Hunttern ZigZag. We are very happy to receive feedback from you.
FREE
Detailed Description: The   Pivot Point Classic Indicator   is designed for traders who rely on classic pivot points and midpoints levels for their trading strategies. By automatically calculating and plotting these levels, the indicator provides a clear, visual representation of critical price areas where the market may reverse or break out. Key Features: Automatic Pivot Point Calculations : Automatically calculates pivot points, three support (S1, S2, S3) and resistance (R1, R2, R3) levels bas
FREE
Free automatic Fibonacci is an indicator that automatically plots a Fibonacci retracement based on the number of bars you select on the BarsToScan setting in the indicator. The Fibonacci is automatically updated in real time as new highest and lowest values appears amongst the selected bars. You can select which level values to be displayed in the indicator settings. You can also select the color of the levels thus enabling the trader to be able to attach the indicator several times with differe
FREE
Pivot Points Buy Zones
Nils R M Peleman
4.8 (5)
Detailed Description: The   Pivot Points Indicator   is designed for traders who rely on pivot points, midpoints and support/resistance levels for their trading strategies. By automatically calculating and plotting these levels (based on   the   previous period's high, low, and close prices) , the indicator provides a clear, visual representation of critical price areas where the market may reverse or break out.The tool is particularly useful for day traders and swing traders looking to base th
FREE
Pivot Point Fibo RSJ
JETINVEST
4.4 (20)
枢轴点斐波那契 RSJ 是一个指标,它使用斐波那契汇率追踪当天的支撑线和阻力线。 这个壮观的指标使用斐波那契汇率通过枢轴点创建多达 7 个支撑位和阻力位。 价格如何尊重该支撑和阻力的每个水平真是太棒了,在那里可以感知操作的可能进入/退出点。 特征 多达 7 个支撑位和 7 个阻力位 单独设置级别的颜色 输入 枢轴类型 Pivot Fibo RSJ1 = Fibo ratio 1 计算 Pivot Fibo RSJ2 = Fibo ratio 2 计算 Pivot Fibo RSJ3 = Fibo ratio 3 计算 Pivot Fibo Classic = 经典枢轴计算 最低枢轴级别 旋转 3 个级别 旋转 4 个级别 旋转 5 个级别 枢轴 6 个级别 旋转 7 个级别 如果您仍有疑问,请通过直接消息与我联系: https://www.mql5.com/zh/users/robsjunqueira/
FREE
Pivot Points Levels
Fillipe Dos Santos
Pivot Points Levels Description The Pivot Points Levels indicator is an advanced and comprehensive tool for technical analysis based on support and resistance levels calculated from pivot points. This free indicator combines 6 different calculation methods with support for multiple timeframes, offering a robust solution for identifying key price reversal and continuation areas. Key Features 6 Calculation Methods : Traditional, Fibonacci, Woodie, Classic, DeMark (DM), and Camarilla Multi-Timefram
FREE
Time Spaced Moving Averages
Flavio Javier Jarabeck
5 (3)
The concept is simple: Plotting Price behavior within several periods of time. Some Symbols behave very well during the trading day - with this I mean Intraday trading - and this behavior ends up plotting effectively well with the proposed Exponential Moving Averages in this indicator... Obviously that this behavior could not be seen in all Symbols, but you can give it a try... Just drop this indicator in a chart and you will see for yourself... This indicator is intended for "Feeling the Trend"
FREE
Camarilla Swing Trade Indicator is an Indicator. Support and resistance points are calculated from the High Low Close of the previous TF Week's price. What are Camarilla Pivot Points? 1.Camarilla Pivot Points is a modified version of the classic Pivot Point. 2.Camarilla Pivot Points was launched in 1989 by Nick Scott, a successful bond trader. 3.The basic idea behind Camarilla Pivot Points is that price tends to revert to its mean until it doesn't. 4.Camarilla Pivot Points is a mathematical pr
FREE
Seasonal Cycle
Pablo Filipe Soares De Almeida
Seasonal MT5 指标 通过 Seasonal MT5 指标,发现市场季节性分析的强大潜力。该指标专为日线级别而设计,利用历史价格数据识别和可视化周期性价格模式,帮助交易者发现可预测的市场节奏。适用于外汇、股票和大宗商品交易,是基于数据的量化辅助工具。 主要功能: 基于历史每日价格数据绘制季节性趋势线,揭示市场的周期性波动。 显示一条连接季节性高低点的直线,用于趋势参考。 绘制每月分割线以分析月内季节性变化。 可自定义垂直线标记当前交易日位置。 在独立窗口中对数据进行归一化显示,保证图像清晰。 输入参数: Number of Years(默认:10):设定用于分析的历史周期。 Adjust Scale(默认:false):聚焦特定月份进行局部分析。 Expand Scale(月)(默认:3):定义缩放的月份范围(1–12)。 Invert Indicator(默认:false):反转季节性曲线以进行反向分析。 Shift(默认:0):调整时间位移(以天为单位)。 Apply to(默认:Close):选择用于计算的价格类型(收盘价或开收平均价)。 Vertical Line(默
AliPivot Points
Alexandra Voicu
AliPivot Points is a Meta Trader 5 Indicator that draws you the latest pivot points. You can choose from timeframes ranging from 1 Minute to 1 Month. Calculation methods for pivot points includes: Classic Pivot Points Camarilla Pivot Points Fibonacci Pivot Points Woodie Pivot Points You can personalize the line colors, style, and width to suit your preference. The indicator displays values on the right side of the chart. AliPivot Points values can also be utilized by developers for creating Expe
FREE
Valable ZigZag MT5
Sergey Ermolov
4.61 (18)
MT4 版本  | Trend Monitor VZ指標  |   Owl Smart Levels 指標  |  Owl Smart Levels策略  |  FAQ 艾略特波浪理论是对金融市场过程的解释,它依赖于价格图表上波浪的视觉模型。 Valable ZigZag指标显示市场的波浪结构,可用于做出交易决策。 Valable ZigZag指标更稳定,不像经典的ZigZag指标那样经常改变方向,误导交易者。 这是通过在指标波的构造中使用分形来实现的. Telegram 聊天: @it_trader_chat 新的 Expert Advisor Prop Master   - 在您的交易终端中进行测试 https://www.mql5.com/zh/market/product/115375 Valable ZigZag主要是一个趋势指标。 它设定了交易者应该交易的主要方向,但它也可以作为进入市场的指标。 例如。 在H4时间帧图表上安装指标,最后一波的方向将显示趋势的方向。 选择趋势交易方向后,切换到H1时间框架,并在针对所选趋势的最后一个峰值的细分处进入市场(见图2)。 Va
FREE
RSI abcd
Francisco Gomes Da Silva
3 (1)
RSI ABCD形态查找器:技术策略 1. 指标工作原理 结合 经典RSI 与自动检测 ABCD谐波形态 。 主要组件 标准RSI (可调周期) 高低点标记 (箭头) ABCD形态 (绿/红线) 超买(70)和超卖(30)过滤器 2. MT5设置 period = 14 ; // RSI周期 size = 4 ; // 最大形态尺寸 OverBought = 70 ; // 超买水平 OverSold = 30 ; // 超卖水平 Filter = USE_FILTER_ YES ; // 确认过滤器 3. 交易策略 3.1. 买入信号(看涨ABCD) 条件: RSI形成: 低点( A ) → 高点( B ) → 更高低点( C ) D 高于超卖区(30)但低于 C 确认:绿色连线A-B-C-D 目标: TP1: B-C的61.8% TP2: B-C的100% 止损: 低于 D 3.2. 卖出信号(看跌ABCD) 条件: RSI形成: 高点( A ) → 低点( B ) → 更低高点( C ) D 低于超买区(70)但高于 C 确认:红色连线A-B-C-D 目标: TP1: B-C的6
FREE
交易实用必备工具指标 波浪自动计算指标,通道趋势交易 完美的趋势-波浪自动计算通道计算 , MT4版本 完美的趋势-波浪自动计算通道计算 , MT5版本 本地跟单复制交易 Easy And Fast Copy , MT4版本 Easy And Fast Copy , MT5版本 本地跟单复制交易 模拟试用 Easy And Fast Copy , MT4 模拟账号运行 Easy And Fast Copy , MT5 模拟账号运行 顺势指标又叫CCI指标,CCI指标是 美国 股市 技术分析   家唐纳德·蓝伯特(Donald Lambert)于20世纪80年代提出的,专门测量股价、外汇或者贵 金属 交易是否已超出常态分布范围。属于超买超卖类指标中较特殊的一种。波动于正无穷大和负无穷大之间。但是,又不需要以0为中轴线,这一点也和波动于正无穷大和负无穷大的指标不同。 相对强弱指标RSI是根据一定时期内上涨点数和下跌点数之和的比率制作出的一种技术曲线。能够反映出市场在一定时期内的景气程度。由威尔斯.威尔德(Welles Wilder)最早应用于期货买卖,后来人们发现在众多的图表技术分析中,
FREE
FlatBreakout MT5
Aleksei Vorontsov
FlatBreakout MT5 (Free Version) Flat Range Detector and Breakout Panel for MT5 — GBPUSD Only FlatBreakout MT5   is the free version of the professional FlatBreakoutPro MT5 indicator, specially designed for flat (range) detection and breakout signals on the   GBPUSD   pair only. Perfect for traders who want to experience the unique fractal logic of FlatBreakout MT5 and test breakout signals on a live market without limitations. Who Is This Product For? For traders who prefer to trade breakout of
FREE
This indicator is stand alone version from  MP Pivot Levels  (All in one) containing Demark's Pivots. Calculations:     PP = X / 4     R1 = X / 2 - LOWprev     S1 = X / 2 - HIGHprev Uses: When the pair currency price may change the direction of movement. Possible constraints of support and resistance that creates plateaus for the currency pair prices. Tendency identification by comparing the present prices according to current day's pivot point and also the prior day's pivot points. ____________
FREE
La **Media Móvil de Tercera Generación (TGMMA)** es una versión avanzada del indicador estándar de **Media Móvil (MA)**. Fue descrita por primera vez por Manfred G. Dürschner en su artículo "Gleitende Durchschnitte 3.0" (en alemán). Aquí están las características clave de la TGMMA: 1. **Reducción del Retraso**:    - A diferencia de las MAs tradicionales, la TGMMA reduce significativamente el retraso. Se adapta más rápidamente a los cambios de precios, lo que la hace ideal para traders que busc
FREE
OA SnR Power MT5
Duc Hoan Nguyen
5 (2)
Special offer : ALL TOOLS , just $35 each! New tools   will be   $30   for the   first week   or the   first 3 purchases !  Trading Tools Channel on MQL5 : Join my MQL5 channel to update the latest news from me 概述 OA SnR Power 是一款强大的工具,旨在帮助交易者识别并评估支撑和阻力水平的强度。通过整合交易量、反弹频率和重新测试次数等关键因素,该指标提供了市场关键价格区域的全面视图。 查看更多产品:   所有 产品 OA SnR Power 的工作原理 识别峰值和谷值 该指标使用智能算法计算局部高点和低点。 用户可以配置区域宽度设置,以确保准确检测潜在的支撑和阻力水平。 过滤和合并关键水平 基于用户定义的百分比范围,临近的水平会自动合并,从而使图表更加清晰,并专注于重要的价格区域。 颜色编码的视觉反馈 OA SnR Power 直接在图表上绘制支撑和阻力水平,并附
FREE
Amiguinhos Bar Counter
Eduardo Correia Da Silva
3.67 (3)
Amiguinho's Bar Counter is a price action indicator to display the bar count (candles) with some interesting options. About the "Period of analysis" parameter: if the current timeframe is in minutes, then the analysis period will be considered in days; if the current timeframe is in days, then the analysis period will be considered in months; or  if the period of analysis will be considered in years.
FREE
高级经济日历指标 该指标能够在图表上直接显示所有即将发生的经济事件,突出与所选货币对或交易品种相关的重要新闻,帮助交易者提前预判高波动时段,更精准地制定交易策略。 主要功能 显示未来 最多 5 天 的经济事件(可自定义)。 按照 新闻影响级别 (高、中、低)进行筛选。 可选择是否显示 垂直事件线 和 编号标记 ,方便快速识别。 支持颜色自定义,以便轻松区分不同重要程度的新闻。 自动和手动支持主要 全球货币 (USD, EUR, GBP, JPY, CNY, AUD, CAD, NZD, CHF 等)。 自动识别主要 全球指数和交易工具 (SP500, NASDAQ, DAX, FTSE, CAC40, Nikkei, 恒生指数, Eurostoxx, IBEX, MIB 等)。 内置事件表,显示 日期、时间、货币、重要性和事件名称 ,直接嵌入图表。 智能管理重叠事件,自动调整标记位置,避免混乱。 为什么要使用它 该指标是外汇、指数及大宗商品交易者的必备工具,因为它能够清晰显示 何时以及哪些新闻会影响市场 ,帮助提升风险管理和交易时机的把握。 推荐搭配 为了获得更加完整的技术分析,建
FREE
该产品的买家也购买
购买此指标即可免费获得我的专业交易管理器。 首先,值得强调的是,这个交易系统是一个非重绘、非重画和非滞后的指标,这使得它非常适合手动和机器人交易。 在线课程,手册和下载预设。 “智能趋势交易系统 MT5”是专为新手和经验丰富的交易者量身定制的综合交易解决方案。它结合了超过 10 个优质指标,具有 7 多个强大的交易策略,使其成为适用于各种市场条件的多功能选择。 趋势跟随策略:提供精确的入场和止损管理,以有效地跟随趋势。 反转策略:识别潜在的趋势反转,使交易者能够利用区域市场的机会。 剃头策略:专为快速准确的日内交易和短期交易而设计。 稳定性:所有指标都不会重绘、不会重画和不会滞后,确保可靠的信号。 定制:支持自定义策略,以满足个人交易偏好。超过 7 种策略和组合可帮助您找到最佳策略。 信号清晰度:提供箭头信号,以指示清晰的入场和退出点。 实时警报:通过交易进出警报使交易者保持了解。 深入分析:提供更高时间框架的趋势分析和实时交易监控。 自适应颜色编码:利用蜡烛颜色编码来显示成交量、趋势和反转蜡烛信号。通过蜡烛颜色分析市场方向。 “智能趋势交易系统 MT5”赋予交易者必要的工具,以便在
Divergence Bomber
Ihor Otkydach
4.99 (76)
购买该指标的每位用户将额外免费获得以下内容: 原创工具“Bomber Utility”,该工具会自动跟踪每一笔交易,设置止损和止盈点,并根据策略规则自动平仓; 适用于不同交易品种的指标设置文件(Set 文件); 三种不同风险模式下的 Bomber Utility 设置文件:“最低风险”、“平衡风险” 和 “观望策略”; 一套详细的 视频操作手册,帮助您快速完成安装、配置并开始使用本交易系统。 注意: 要获取以上所有赠品,请通过 MQL5 的私人消息系统联系卖家。 我为您介绍原创的自定义指标 “Divergence Bomber”(背离轰炸机),它是一套基于 MACD 背离交易策略 的“全功能”交易系统。 该技术指标的主要任务是识别 价格与 MACD 指标之间的背离,并发出交易信号(包括推送通知),指示未来价格可能的运动方向。平均而言,这些信号的准确率超过 98%。有关该指标如何工作的详细说明,请观看本页面上的视频演示。 该系统使用 止损订单 和 动态回撤平仓机制 来管理交易。 Divergence Bomber 指标的主要特点: 支持交易的品种: AUDCAD、AUDCHF、AUDSG
Gold Sniper Scalper Pro
Ich Khiem Nguyen
5 (4)
Gold Sniper Scalper Pro - MetaTrader 5 黄金 (XAU/USD) 交易系统 专为认真的交易者设计: 采用结构化、数据驱动的方法进行黄金交易,该方法结合了多种市场分析因素。此工具旨在支持您的黄金交易分析。 限时价格机会 这是在价格上涨之前拥有 Gold Sniper Scalper Pro 的机会。 产品价格将在每接下来的 10 次购买后增加 $50。 最终价格: $498 定义您的分析优势的功能 Gold Sniper Scalper Pro 是一个全面的工具包,旨在为您提供深刻见解和清晰的统计优势: 详细的指标使用指南,包括系统信息、输入自定义设置以及指标使用注意事项,已在下方 MQL 文章中呈现。请参阅该文档。 Gold Sniper Scalper Pro - Gold (XAU/USD) Trading System on MetaTrader 5 - Trading Systems - 8 November 2025 - Traders' Blogs 多算法架构: 系统的核心是多个分析算法的智能组合,它们同步运行以过滤市场噪音并确定潜在
ARIPoint
Temirlan Kdyrkhan
1 (1)
ARIPoint is a powerful trading companion designed to generate high-probability entry signals with dynamic TP/SL/DP levels based on volatility. Built-in performance tracking shows win/loss stats, PP1/PP2 hits, and success rates all updated live. Key Features: Buy/Sell signals with adaptive volatility bands Real-time TP/SL/DP levels based on ATR Built-in MA Filter with optional ATR/StdDev volatility Performance stats panel (Success, Profit/Loss, PP1/PP2) Alerts via popup, sound, push, or email Cu
Entry In The Zone and SMC Multi Timeframe 是一款基于 Smart Money Concepts(SMC) 开发的实时市场分析工具,旨在帮助交易者以系统化方式分析市场结构,并更加清晰地掌握整体市场方向。 系统能够在多周期中自动分析 反转点、关键价格区域以及市场结构 ,并显示 兴趣点(POI) 、 无重绘信号 以及 自动斐波那契水平(Auto Fibonacci Levels) ,用于精准识别回调位置与潜在反转点。 系统提供的 实时信号与提醒功能 可确保当价格进入关键区域或在区域内出现反转信号时,交易者不会错过重要机会。 此外,本系统同时具备 指标功能 和 信号系统功能(2 合 1) ,将区域分析与实时入场信号集成于同一工具中。所有参数亦可完全自定义,以适配任何交易风格。 ------------------------------------------------------------------------------ 免费赠送!FABLE Pro Suite — 为智能资金交易者打造的一体化交易工具包 购买此指标后,您将免费获得 F
Smart Stop Indicator – 智能化止损逻辑,直接呈现在您的图表上 概述 Smart Stop Indicator 是为希望以清晰、系统、非情绪化方式设置止损的交易者量身打造的工具。它将经典的价格结构逻辑(更高的高点、更低的低点)与现代突破识别技术相结合,精准标记真正合理的止损位置。无论是趋势、盘整还是快速突破行情,指标都会在图表上直接显示最佳 SL 区域及其状态(“new”、“broken”、“valid”)并且现在新增 SL 与 %ADR 的距离显示。 亮点 基于市场结构的自动止损识别 • 根据市场结构与实时价格行为自动识别关键止损位置。 智能突破适应能力 • 能适应突破与快速方向变化,不会强迫过早调整止损。 SL %ADR 显示 • 显示止损距离占平均日波动范围 ADR 的百分比与 Smart Stop Scanner 完全一致帮助交易者即时识别紧密机会或已延伸的行情。 内置警报逻辑 • 当止损水平变为“new”、“valid”或“broken”时触发警报包含准确的状态切换与冷却逻辑。 破损级别的淡化显示 • 对于“broken”状态的方向、价格、S
Trend Screener Pro MT5
STE S.S.COMPANY
4.84 (99)
使用趋势筛选指标释放趋势交易的力量:由模糊逻辑和多货币系统提供支持的终极趋势交易解决方案! 使用趋势筛选器(由模糊逻辑提供支持的革命性趋势指标)提升您的趋势交易。 它是一个强大的趋势跟踪指标,结合了超过 13 种高级工具和功能以及 3 种交易策略,使其成为使您的 Metatrader 成为趋势分析器的多功能选择。 限时优惠:趋势筛选指标终身仅需 50 美元。 ( 原价 250$ ) (优惠延长) 体验趋势筛选器 100% 无需重新绘制的准确性,确保您的交易决策不受过去价格变化的影响。 释放多时间框架和多货币功能的多功能性,使您能够以无与伦比的信心在外汇、商品、加密货币和指数领域进行交易。 利用 Trend Screener 的综合策略套件增强您的交易: - 趋势跟踪策略和趋势延续策略 :趋势筛选器的趋势跟踪策略提供清晰的趋势延续信号,让您有效捕捉趋势走势并管理风险。 - 反转策略和早期入场点策略 :趋势筛选器的反转策略可检测市场方向的潜在变化,使您能够预测趋势反转并利用疲弱的市场趋势。通过早期入场点,您可以在潜在的趋势变化之前定位自己 获取可观的利润。 - 倒卖策略: 趋势筛选器的倒卖
Atomic Analyst MT5
Issam Kassas
4.31 (26)
首先值得强调的是,该交易指标是非重绘、非延迟的指标,这使其成为手动和机器人交易的理想选择。 用户手册:设置、输入和策略。 Atomic Analyst是一种PA价格行动指标,利用价格的力量和动量来寻找市场上更好的机会。配备了高级过滤器,可帮助去除噪音和假信号,并提高交易潜力。使用多层复杂的指标,Atomic Analyst扫描图表,并将复杂的数学计算转化为任何初学者都能理解并用来做出一致交易决策的简单信号和颜色。 “Atomic Analyst”是专为新手和经验丰富的交易者量身定制的综合交易解决方案。它将高级指标和一流功能融合为一体的交易策略,使其成为所有类型交易者的多功能选择。 日内交易和剥头皮策略:专为快速准确的日内交易和短期交易而设计。 日内和摆动交易策略:可用作追求价格大幅波动的日内和摆动交易者的可靠工具。 多货币和市场:凭借其可靠的精度,在不同的工具和市场上运作。 多个时间框架:可在多个时间框架上使用,性能良好。 稳定性:所有指标均不重绘、不重绘和不滞后,确保可靠的信号。 信号清晰度:提供箭头信号,用于清晰的入场和出场点。 实时警报:通过交易入场、SL和TP警报通知交易者
FX Power MT5 NG
Daniel Stein
5 (27)
FX Power:分析货币强度,助您做出更明智的交易决策 概述 FX Power 是一款专业工具,帮助您全面了解主要货币和黄金在任何市场条件下的真实强度。通过识别强势货币用于买入,弱势货币用于卖出, FX Power 简化了交易决策,并帮助您发现高概率的交易机会。不论您是想跟随趋势还是通过极端的 Delta 值预测反转,这款工具都能完美适应您的交易风格。别再盲目交易——用 FX Power 让您的交易更加智慧。 1. 为什么 FX Power 对交易者极具价值 实时货币和黄金强度分析 • FX Power 实时计算并显示主要货币和黄金的相对强度,助您全面了解市场动态。 • 监控领先或落后资产,轻松识别值得交易的货币对。 全面的多时间框架视图 • 跟踪短期、中期和长期时间框架的货币和黄金强度,以便将您的交易策略与市场趋势保持一致。 • 无论是快进快出的短线交易还是更长期的投资策略, FX Power 都能为您提供所需的信息。 Delta 动态分析用于趋势和反转 • 极端 Delta 值常常预示反转机会,而平缓的 Delta 变化则确认趋势延续。 • 使用 Delta 分析,轻
Game Changer Indicator mt5
Vasiliy Strukov
4.6 (5)
Game Changer 是一款革命性的趋势指标,适用于任何金融工具,可将您的 MetaTrader 平台升级为强大的趋势分析工具。该指标不会重绘,也不会出现滞后。它适用于任何时间范围,有助于识别趋势,发出潜在反转信号,可用作追踪止损机制,并提供实时警报,以便您快速做出市场反应。无论您是经验丰富的交易员、专业人士,还是寻求优势的初学者,这款工具都能帮助您自信、自律地进行交易,并清晰地了解潜在的趋势动态。 购买后立即联系我,即可获得个人奖励!您可以免费获得我们的强力支撑和趋势扫描指标,请私信我! 请注意,我不在 Telegram 上出售我的 EA 或特殊套件,它们仅适用于 MQL5,我的套件文件也仅在我的博客上提供。 请小心诈骗者 ,不要从其他人那里购买任何套件! 设置 启用趋势变化警报 - 真/假 - 趋势变化时在图表上显示警报 发送推送通知 - 真/假 - 启用手机推送警报通知 发送邮件通知 - 真/假 - 发送趋势变化的邮件通知到电子邮件
首先,值得强调的是,这个交易工具是非重绘、非重画和非滞后的指标,非常适合专业交易。 在线课程,用户手册和演示。 智能价格行动概念指标是一个非常强大的工具,既适用于新手,也适用于经验丰富的交易者。它将超过20个有用的指标合并到一个指标中,结合了高级交易思想,如内圈交易员分析和智能资金概念交易策略。该指标侧重于智能资金概念,提供有关大型机构交易方式的见解,帮助预测它们的动向。 它在流动性分析方面尤其擅长,有助于理解机构的交易方式。它擅长预测市场趋势,并仔细分析价格波动。通过将您的交易与机构策略对齐,您可以更准确地预测市场走向。该指标多才多艺,擅长分析市场结构,识别重要的订单区块,并识别各种模式。 它擅长识别BOS和CHoCH等模式,理解动量的转变,并突出显示供需强劲的关键区域。它还擅长发现强大的不平衡,并分析价格创造更高高点或更低低点的模式。如果您使用斐波那契回撤工具,该指标可以满足您的需求。它还可以识别相等的高点和低点,分析不同的时间框架,并通过仪表板显示数据。 对于使用更高级策略的交易者,该指标提供了工具,如公平价值差指标和优惠和折扣区域的识别。它特别关注高时间框架订单区块,并
Quantum TrendPulse
Bogdan Ion Puscasu
5 (19)
介绍 Quantum TrendPulse   ,这是一款终极交易工具,它将 SuperTrend   、   RSI 和 Stochastic 的强大功能整合到一个综合指标中,以最大限度地发挥您的交易潜力。该指标专为追求精准和效率的交易者而设计,可帮助您自信地识别市场趋势、动量变化以及最佳进入和退出点。 主要特点: 超级趋势整合: 轻松跟随当前的市场趋势并乘上盈利浪潮。 RSI 精度: 检测超买和超卖水平,非常适合把握市场逆转时机,可用作 SuperTrend 的过滤器 随机精度: 利用随机振荡在波动的市场中寻找隐藏的机会, 用作超级趋势的过滤器 多时间范围分析: 从 M5 到 H1 或 H4,在不同时间范围内关注市场动态。 可定制的警报: 当您的自定义交易条件得到满足时收到通知,这样您就不会错过任何交易。 无论您是新手还是经验丰富的交易员,   Quantum TrendPulse 都能为您提供所需的优势,帮助您增强策略并自信地进行交易。借助这一强大的指标,将洞察力转化为利润 — 掌控您的交易! ***购买 Quantum TrendPulse,即可免费获得 Quantum Tr
Quantum Trend Sniper
Bogdan Ion Puscasu
4.74 (53)
介绍   量子趋势狙击指标 ,突破性的 MQL5 指标,正在改变您识别和交易趋势反转的方式!由拥有超过13年交易经验的资深交易员团队开发,     量子趋势狙击指标   旨在通过其创新的方式以极高的准确度识别趋势反转,将您的交易之旅推向新的高度。 ***购买量子趋势狙击指标,即可免费获得量子突破指标!*** 当量子突破指标识别出趋势反转时,它会向您发出警报和信号箭头,并建议您三个止盈水平。 它既适合新手交易者,也适合专业交易者。 量子 EA 通道:       点击这里 MT4版本:       点击这里 建议: 时间范围: 所有时间范围。为了获得最佳结果,我们建议在 M15、M30 和 H1 时间范围内使用它。 货币对:欧元兑美元、英镑兑美元、澳元兑美元、欧元兑英镑、, EURAUD,  XAUUSD 账户类型:ECN、Raw 或 Razor,点差极低 经纪时间:任意 经纪商:IC Markets、Pepperstone with Raw 和 Razor 的点差最低 建议止损:50 点 建议止盈水平:20 点、50 点和 100 点 规格: 不重漆! 最
Trend indicator AI mt5
Ramil Minniakhmetov
5 (12)
趋势人工智能指标是一个伟大的工具,将加强交易者的市场分析结合趋势识别与可操作的进入点和逆转警报。 该指标使用户能够自信和精确地驾驭外汇市场的复杂性 除了主要信号,趋势Ai指标识别在回调或回调期间出现的次要入口点,使交易者能够利用既定趋势内的价格修正。 重要优势: *MT4及MT5工程 *明确买入或卖出信号 ·不重绘 *适用于所有资产 小心我不卖EA或设置电报它骗局. 所有设置免费在这里的博客。  重要! 购买后立即与我联系,以获得指示和奖金! 真实的操作监控以及我的其他产品可以在这里找到: https://www.mql5.com/en/users/mechanic/seller&nbsp ; 设置和输入: 建议为所有资源设置默认设置。 第...
- Real price is 80$ - 45% Discount (It is 45$ now) Contact me for extra bonus   indicator, instruction or any questions! - Lifetime update free - Non-repaint - Related product: Gann Gold EA - I just sell my products in Elif Kaya Profile, any other websites are stolen old versions, So no any new updates or support. Advantages of  M1 Scalper Pro  Profitability: M1 Scalper Pro is highly profitable with a strict exit strategy. Frequent Opportunities: M1 Scalper Pro  takes advantage of numerous smal
TPSproTREND PrO MT5
Roman Podpora
4.72 (18)
立即购买 TREND PRO 并免费获得另一个高级趋势指标 如需接收,请写私人消息。 VERSION MT4     -     ИНСТРУКЦИЯ RUS       -     INSTRUCTIONS  ENG 主要功能: 准确的输入信号,无需渲染! 如果出现信号,它仍然相关!这是与重提指标的一个重要区别,重提指标可以提供信号然后改变信号,这可能导致存款资金的损失。现在您可以以更高的概率和准确度进入市场。还有一个功能是在箭头出现后为蜡烛着色,直到达到目标(止盈)或出现反转信号。 显示止损/获利区域 为了提高搜索切入点时的视觉清晰度,创建了一个模块,该模块最初显示买入/卖出区域,在该区域中搜索进入市场的最佳点。用于处理止损水平的附加智能逻辑有助于随着时间的推移减小其大小,从而降低进入交易(移动 sl)时的初始风险。 显示较高时间范围内的最小值/最大值(MTF 模式) 添加了一项功能,可以显示较高时间间隔的最小/最大校正位置,并显示趋势变化。此外,MIN/MAX 现在有编号,显示修正内容。 风险回报率 (RR) 使用指标算法,可以检测精确的入场点,平均风险回报比超过1k2。
Grabber System MT5
Ihor Otkydach
5 (19)
向您介绍一款优秀的技术指标——Grabber,它是一套即开即用的“全包式”交易策略。 在一个代码中集成了强大的市场技术分析工具、交易信号(箭头)、提醒功能和推送通知。 每位购买该指标的用户还可免费获得以下内容: Grabber辅助工具:用于自动管理已开仓位 视频操作指南:逐步教学如何安装、设置和使用该指标进行交易 原创Set文件:可快速自动配置,帮助实现最佳交易效果 忘掉其他策略吧!只有Grabber能够真正激励你在交易中攀登新高峰! Grabber策略的主要特点: 交易周期:从M5到H4 适用资产:任意,但我推荐我亲自测试过的品种(GBPUSD、GBPCAD、GBPCHF、AUDCAD、AUDUSD、AUDSGD、AUDCHF、NZDUSD、NZDCAD、EURCAD、EURUSD、EURAUD、EURGBP、EURCHF、USDCAD、USDSGD) 交易时间:全天候 24/7 交易效果:我分享自己的真实交易结果,并在此教学如何操作: https://www.mql5.com/ru/market/product/134563?source=Site+Market+MT5+Indic
Entry Points Pro for MT5
Yury Orlov
4.47 (136)
这款指标用于 MT5,可提供准确的入场交易信号,且无重绘。 它可应用在任何金融资产:外汇、加密货币、贵金属、股票、指数。 它将提供极其精准的评估,并告诉您何时开仓和平仓的最佳时机。 观看 视频 (6:22),其中包含一个仅处理单一信号的示例,该信号即可值回指标购价! 大多数交易者在 Entry Points Pro 指标的帮助下,在第一个交易周内即改善了他们的交易结果。 订阅我们的 Telegram 群 ! Entry Points Pro 指标的益处。 入场信号无重绘 如果信号出现,并得到确认,则它不会再消失;不像是重绘指标,它会导致重大的财产损失,因为它们可以在显示信号后再将其删除。 无差错开仓 指标算法可令您找到入场交易(买入或卖出资产)的理想时机,从而提高每位交易者的成功率。 Entry Points Pro 可操作任何资产 它允许您在 MT5 平台上交易任何经纪商的加密货币、股票、贵金属、指数、大宗商品和货币。 提供任何方向的信号 Entry Points Pro 指标提供针对任意价格走势的入场交易信号 - 上涨、下跌或横盘(横向)。 最大盈利潜力 离场信号
RelicusRoad Pro MT5
Relicus LLC
5 (24)
您购买了多少次交易指标,它们拥有 出色的回测, 真实账户表现证明 拥有惊人的数字和 各种统计数据, 但使用后您却 账户爆仓? 您不应该只相信一个信号本身,您需要知道它最初出现的原因,这正是 RelicusRoad Pro 的最佳之处! 用户手册 + 策略 + 培训视频 + 带 VIP 访问权限的私人群组 + 提供移动版本 观察市场的新方式 RelicusRoad 是 全球最强大、最好的交易指标 ,适用于外汇、期货、加密货币、股票和指数,为交易者提供发展账户所需的所有信息和工具。我们提供 技术分析 和 交易计划 ,帮助 每位交易者取得成功 ,无论是 初学者 还是 高级交易者 。 它是一个 关键交易指标 ,提供足够的信息来 预测 未来市场。我们相信一个 完整的解决方案 ,而不是图表上几个没有意义的不同指标。这是一个 一体化指标 ,显示 信号 、 箭头 + 价格行为 信息,这是 无与伦比 且 非常准确的 。   RelicusRoad 利用机器学习 (AI) 技术,为交易者提供必要的信息和工具,帮助他们成为成功的、知情的交易者。   通过领先指标预测未来价格 几乎 所有技术指标都滞后 ,
FX Levels MT5
Daniel Stein
5 (11)
FX Levels:适用于所有市场的高精度支撑与阻力 快速概览 想要精准确定适用于任何市场(外汇、指数、股票或大宗商品)的支撑与阻力吗? FX Levels 将传统的“Lighthouse”方法与前沿的动态分析相结合,实现近乎通用的准确性。依托真实经纪商经验和自动化的每日与实时更新, FX Levels 帮助您捕捉价格反转点、设置合理的盈利目标,并自信地管理交易。立即使用,体验更准确的支撑/阻力分析如何助力您的交易更上层楼! 1. 为什么 FX Levels 对交易者非常有利 极度精准的支撑 & 阻力区 • FX Levels 专为不同经纪商提供的行情源和时间设置而设计,可生成几乎相同的价位区,解决数据不一致的常见问题。 • 这意味着无论您在哪里交易,都能获得稳定一致的水平线,为策略打下更加牢固的基础。 结合传统与先进技术 • 通过将久经考验的“Lighthouse”方法与动态分析相融合, FX Levels 不仅限于每日刷新,还可针对新的价格波动进行即时更新。 • 您可以选择经典的静态方式,或实时捕捉新出现的水平,以贴近最新的市场行为。 识别清晰的反转点 • FX Lev
Blahtech Supply Demand MT5
Blahtech Limited
4.54 (13)
Was: $299  Now: $99  Supply Demand uses previous price action to identify potential imbalances between buyers and sellers. The key is to identify the better odds zones, not just the untouched ones. Blahtech Supply Demand indicator delivers functionality previously unavailable on any trading platform. This 4-in-1 indicator not only highlights the higher probability zones using a multi-criteria strength engine, but also combines it with multi-timeframe trend analysis, previously confirmed swings a
Gold Entry Sniper
Tahir Mehmood
5 (1)
Gold Entry Sniper – 专业多周期ATR黄金交易仪表盘,适合黄金剥头皮与波段交易 Gold Entry Sniper 是一款先进的 MetaTrader 5 指标,旨在为 XAUUSD 及其他品种提供精准的 买/卖信号 。基于 ATR 移动止损逻辑 和 多周期分析仪表盘 ,适合剥头皮交易者与波段交易者,帮助识别 高概率黄金入场点 。 主要功能与优势 多周期信号分析 – 同时显示 M1、M5、M15 趋势方向。 基于ATR的动态止损 – 根据波动性自动调整。 专业图表仪表盘 – 展示信号状态、ATR水平、线性回归中线和交易方向。 清晰买卖标记 – 自动箭头与文字标签提示。 离场提示与交易管理 – 自动检测离场信号锁定利润。 全面自定义 – 调整仪表盘位置、颜色、字体及参数。 专为黄金优化 – 适用于 M1至M15 黄金剥头皮 ,也适合外汇、指数与加密货币。 为什么选择 Gold Entry Sniper? 为追求 快速、精准、可视化交易决策 的交易者打造,ATR 与多周期确认结合,帮助你抓住 最佳黄金入场点
支撑和阻力筛选器是 MetaTrader 的一个级别指标,它在一个指标内提供多种工具。 可用的工具有: 1. 市场结构筛选器。 2. 看涨回调区。 3. 看跌回调区。 4.每日枢轴点 5.每周枢轴点 6. 每月枢轴点 7. 基于谐波形态和成交量的强大支撑和阻力。 8. 银行级区域。 限时优惠:HV 支撑和阻力指示器仅售 50 美元且终生可用。 (原价 125$) 通过访问我们的 MQL5 博客,您可以找到我们所有带有分析示例的高级指标: 单击此处 主要特点 基于谐波和音量算法的强大支撑和阻力区域。 基于谐波和成交量算法的看涨和看跌回调区域。 市场结构筛选器 每日、每周和每月的枢轴点。 文档 所有支持和阻力筛选器文档(说明)和策略详细信息均可在我们 MQL5 博客的这篇文章中找到: 单击此处。 接触 如果您有任何问题或需要帮助,请通过私信联系我。 作者 SAYADI ACHREF,金融科技软件工程师,Finansya 创始人。
介绍     Quantum Breakout PRO   ,突破性的 MQL5 指标,正在改变您交易突破区域的方式!由拥有超过13年交易经验的资深交易员团队开发,     量子突破 PRO     旨在通过其创新和动态的突破区域策略将您的交易之旅推向新的高度。 量子突破指标将为您提供带有 5 个利润目标区域的突破区域的信号箭头,以及基于突破框的止损建议。 它既适合新手交易者,也适合专业交易者。 量子 EA 通道:       点击这里 重要的!购买后请私信我领取安装手册。 建议: 时间范围:M15 货币对:GBPJPY、EURJPY、USDJPY、NZDUSD、XAUUSD 账户类型:ECN、Raw 或 Razor,点差极低 经纪商时间:GMT +3 经纪商:IC Markets、Pepperstone with Raw 和 Razor 的点差最低 规格: 不重漆! 最多 5 个建议利润目标区域 建议止损水平 可定制的盒子。您可以设置自己的 Box Time Start 和 Box Time End。 接触 如果您有任何疑问或需要帮助,请通过私人消息与我联系。
FX Volume MT5
Daniel Stein
4.86 (22)
FX Volume:从经纪商视角洞察真实市场情绪 简要概述 想要提升您的交易策略? FX Volume 可提供零售交易者和经纪商的持仓实时数据——远早于诸如 COT 之类的延迟报告。不论您希望获得持续稳定的收益,还是想在市场中多一分制胜的砝码, FX Volume 都能帮您识别重大失衡、确认突破以及完善风险管理。立即开启体验,让真实的成交量数据为您的交易决策带来革新! 1. 为什么 FX Volume 对交易者格外有用 极具准确度的早期预警 • 快速捕捉有多少交易者正在买入或卖出某个货币对——比大多数人提前一步。 • FX Volume 是 唯一 能够整合多家零售经纪商真实成交量数据并以简洁方式呈现的工具。 强力风险管理 • 及时识别多头或空头仓位的巨大不平衡,这往往预示着潜在的趋势反转,帮助您更自信地设置止损和目标位。 • 独家而真实的数据让每一次交易决策更具可靠性。 优化进场与出场点 • 发现“过度集中”的交易(大多数交易者都在同一方向),并通过真实成交量来确认突破。 • 避免依赖常见指标可能带来的误导信号,而是利用真实的实时成交量。 适配各种交易策略 • 将 FX
Berma Bands
Muhammad Elbermawi
5 (7)
Berma 波段 (BBs) 指标对于寻求识别和利用市场趋势的交易者来说是一种有价值的工具。通过分析价格与 BBs 之间的关系,交易者可以辨别市场是处于趋势阶段还是区间波动阶段。 访问[ Berma Home Blog ] 了解更多信息。 Berma 带由三条不同的线组成:上 Berma 带、中 Berma 带和下 Berma 带。这些线围绕价格绘制,直观地表示价格相对于整体趋势的变动。这些带之间的距离可以洞察波动性和潜在的趋势逆转。 当 Berma Bands 线相互分离时,通常表明市场正在进入横盘或区间波动时期。这表明缺乏明确的方向性。交易者可能会发现在这些时期内很难识别趋势,因此可能需要等待更清晰的趋势出现。 当 Berma Bands 线汇聚成一条线时,通常表示趋势环境强劲。这种汇聚表明存在明显的方向性偏差,因为价格波动性足以随趋势而变化。交易者可能会发现在这些时期更容易识别潜在的入场点和出场点,因为趋势的势头可以提供有利的交易机会。然而,重要的是要注意整体趋势中的潜在回调或修正。 Berma 带根据价格蜡烛图与上带和下带的相互作用提供明确的买入和卖出信号。当价格蜡烛图首
SynaptixQuant Dominance Matrix
Devie Arevalo Montemayor
5 (1)
SynaptixQuant Dominance Matrix: Institutional-Grade Market State Extraction Engineered for traders who require a data-driven view of market behaviour beyond surface-level indicators. The Synaptix Quant (SQ) Dominance Matrix is not a conventional currency strength display. Behind its intentionally streamlined interface runs a sophisticated analytical architecture designed to quantify market conditions with precision. Every output is generated through layered signal processing built to identify d
IX Power MT5
Daniel Stein
4.91 (11)
IX Power:解锁指数、大宗商品、加密货币和外汇市场洞察 概述 IX Power 是一款多功能工具,可分析指数、大宗商品、加密货币和外汇市场的强弱表现。 FX Power 提供针对货币对的最高精度,利用所有可用货币对数据进行分析,而 IX Power 专注于基础资产的市场数据。这使得 IX Power 成为非外汇市场的理想选择,同时在需要简单外汇分析时也非常可靠。它可以无缝适用于任何图表,提供清晰的、有行动价值的洞察,帮助提升您的交易决策。 1. 为什么 IX Power 对交易者非常有价值 多市场强弱分析 • IX Power 分析指数、大宗商品、加密货币和外汇市场的强弱表现,为每个市场提供量身定制的洞察。 • 监控 US30、WTI、黄金、比特币等资产的表现,发现交易机会。 适用于更广泛的市场 • 对于外汇交易, FX Power 提供无与伦比的精度,通过分析所有相关货币对。 • IX Power 专注于基础资产的市场数据,非常适合非外汇市场及简化的外汇分析。 实时适应性 • 借助自适应算法, IX Power 实时响应市场数据变化,保持分析的最新性。 • 实时更新
ARIScalping
Temirlan Kdyrkhan
ARIScalp is a powerful trading companion designed to generate high-probability entry signals with dynamic TP/SL/DP levels based on volatility. Built-in performance tracking shows win/loss stats, PP1/PP2 hits, and success rates all updated live. Key Features: Buy/Sell signals with adaptive volatility bands Real-time TP/SL/DP levels based on ATR Built-in MA Filter with optional ATR/StdDev volatility Performance stats panel (Success, Profit/Loss, PP1/PP2) Alerts via popup, sound, push, or email Cus
Blahtech Market Profile MT5
Blahtech Limited
5 (10)
Was: $249  Now: $99   Market Profile defines a number of day types that can help the trader to determine market behaviour. A key feature is the Value Area, representing the range of price action where 70% of trading took place. Understanding the Value Area can give traders valuable insight into market direction and establish the higher odds trade. It is an excellent addition to any system you may be using. Inspired by Jim Dalton’s book “Mind Over Markets”, this indicator is designed to suit the
作者的更多信息
Smart Detector EA
Tsvetan Tsvetanov
Smart Detector EA – 智能交易如此简单 Smart Detector EA 是一款先进的交易系统,将复杂的技术转化为简单、易用的解决方案。它专为各层次的交易者设计,只需少量基础外部设置即可运行,其余部分由强大的实时优化和自适应机器学习自动完成。 主要功能: 全自动化: 高度自动化,几乎无需用户干预。 自适应智能: 策略可自我优化,并实时适应市场环境。 稳健策略: 对不同交易环境不敏感,确保稳定表现。 风险控制设计: 不使用马丁格尔、网格或加仓技术。 简化交易: 每次仅保持一个持仓,方便管理。 灵活持仓周期: 典型交易从数小时到数天不等。 智能离场: 出现相反信号时自动平仓。 可定制风险控制: 可选固定止损/止盈水平及单笔亏损限制。 Smart Detector EA 将尖端的机器学习与简洁性结合,提供专业交易优势而无需复杂操作。 要求与建议: 经纪商: 任意经纪商(推荐使用低点差、快速执行的 ECN,经纪商可获得最佳效果) 最低资金: $500 杠杆: 1:30 或更高 交易品种: EURUSD、GBPUSD、AUDUSD
Score EA
Tsvetan Tsvetanov
5 (1)
介绍我们全自动适应性交易系统的MT5版本 - Score EA。这个新版本提供了显著增强的功能和特性,将您的交易体验提升到一个全新的高度。 关键更新包括: 支持最多28个符号,提供更广泛的市场曝光和多样化。 扩展的用户界面,现在包含完整的仓位列表和手动控制按钮,提供更大的灵活性。 新的交易算法和改进的机器学习模型,旨在提升交易决策和表现。 与许多依赖外部AI资源或通用语言模型(如ChatGPT)的系统不同,我们的Score EA系统由专门开发的自有机器学习算法驱动。这些模型专为交易和检测时间序列数据中的统计显著模式而设计,提供了市场中的独特优势。 关键特点: 先进的交易逻辑 :源自自有的机器学习和统计模型。 高度可配置 :外部设置允许您根据不同市场条件和个人偏好调整策略。 多符号交易 :可以从一个界面同时交易最多28个货币对。 可定制的用户界面 :查看仓位和净盈亏,分别控制每个符号的EA状态,并轻松访问账户信息。 全面的风险控制 :包括一整套选项,有效管理您的风险敞口。 系统要求和推荐: 账户类型 :非FIFO,支持对冲。 最低资本 :每对1000美元。 VPS :建议使用可靠的VPS
DFGX Dashboard
Tsvetan Tsvetanov
5 (2)
Take your trading to the next level with DFGX - our second generation Dynamic Fibonacci Grid. This new, powerful and easy to use application is specially designed and optimized for contrarian intraday trading, scalping and news trading on the Forex market. This system is the ideal solution for active professional traders and scalpers who are looking for innovative ways to optimize their strategy. The system also provides excellent opportunity for new traders who want to learn to trade in a syste
以图形方式呈现日内货币强弱。 计算基于 28 个货币对。 数值从日线图起始时间追踪至当前时间。 该指标最初是作为 FX28 Trader 仪表盘的免费工具创建的。 现在您可以免费使用。 该指标提供多种自定义设置,您还可以将其直接链接到 FX28 Trader 图表控制系统。 注意! 该指标无法在策略测试器中运行。 要测试该指标,您必须下载并安装到实时图表上。 以图形方式呈现日内货币强弱。 计算基于 28 个货币对。 数值从日线图起始时间追踪至当前时间。 该指标最初是作为 FX28 Trader 仪表盘的免费工具创建的。 现在您可以免费使用。 该指标提供多种自定义设置,您还可以将其直接链接到 FX28 Trader 图表控制系统。 注意! 该指标无法在策略测试器中运行。 要测试该指标,您必须下载并安装到实时图表上。
FREE
Currency Strength 28 Pro
Tsvetan Tsvetanov
4.5 (2)
This indicator allows you to analyze the hidden trends and correlations between the 8 most traded currencies via unique strength meter which creates multiple charts in a single window based on the price action of each currency in relation to all other currencies. The indicator also includes interactive panel where you can see the trends for all 28 pairs as well as the distance to the highest and the lowest price for the selected period. With this panel you can switch between currency pairs with
Custom Pivots MT5
Tsvetan Tsvetanov
5 (1)
Pivots Points are significant levels traders can use to determine directional movement, support and resistance. Pivot Points use the prior period's high, low and close to formulate future support and resistance. In this regard, Pivot Points are predictive and leading indicators. Pivot Points were originally used by floor traders to set key levels. Floor traders are the original day traders. They deal in a very fast moving environment with a short-term focus. At the beginning of the trading day,
SDX Chart
Tsvetan Tsvetanov
4.5 (2)
The SDX Chart is a free additional indicator which can be used in combination with SDX Dashboard . Features Ability to review the history of each symbol and time frame. Ability to change symbols and time frames with one click. Works perfectly in combination with SDX Dashboard and helps you to understand the system better. Settings MA Period - number of periods for the calculation of the moving average and the standard deviation. Number of Bars - how far back to draw the indicator. Buttons Size
FREE
Custom Pivots
Tsvetan Tsvetanov
4 (4)
Pivots Points are significant levels traders can use to determine directional movement, support and resistance. Pivot Points use the prior period's high, low and close to formulate future support and resistance. In this regard, Pivot Points are predictive and leading indicators. Pivot Points were originally used by floor traders to set key levels. Floor traders are the original day traders. They deal in a very fast moving environment with a short-term focus. At the beginning of the trading day,
The Dynamic Fibonacci Grid Dashboard ( DFG-360 ) is a multi functional trading app designed for work primarily in the Forex market. The app combines several modules and tools into one complete trading system. The unique interface of the app is optimized for active day trading, scalping, news trading, short term trend following as well as counter trend and grid trading. Main features Advanced Multi Time Frame and Multi Market analysis. Quick and efficient position management. Semi-Automated trad
Custom Market Watch
Tsvetan Tsvetanov
3.33 (3)
The Custom Market Watch ( CMW ) is a professional grade trading application which allows you to operate effortlessly with large number of symbols and multiple open positions simultaneously from one chart. The Custom Market Watch shows the most essential daily technical information for each symbol in combination with very simple and easy to use trading interface where you can monitor the net exposure for each symbol and you can open and close positions with one click. The app is automatically syn
Interactive RSI Matrix
Tsvetan Tsvetanov
5 (7)
This indicator shows the current RSI values for multiple symbols and multiple timeframes and allows you to switch between timeframes and symbols with one click directly from the matrix. With this indicator, you can analyze large number of symbols across multiple timeframes and detect the strongest trends in just a few seconds. Features Shows RSI values for multiple symbols and timeframes simultaneously. Colored cells with progressive color intensity depending on the RSI values. Ability to chang
This indicator is using the Central Limit Theorem in combination with historical volatility and Fibonacci ratios in order to create unique type of chart tool called Projected Volatility Distribution. This tool allows you to perform highly accurate intraday technical analysis where in a split second you can detect overbought and oversold conditions as well as strong trends. In addition you have at your disposal multi-functional panel which shows signals in real time and gives you the ability to o
SDX Dashboard
Tsvetan Tsvetanov
SDX is our latest and most advanced dashboard for manual trading. The app is based on our proven grid platform and offers unique trading opportunities for both experienced and new traders. This unique combination of innovative tools is designed to simplify the trading process and to give you real advantage. The system is ideal for short term trend following, counter-trend trading and scalping on the Forex market. Main Features Ability to work simultaneously with 10 pairs from one screen. Abilit
Interactive BB Matrix
Tsvetan Tsvetanov
2 (1)
This indicator displays Bollinger Bands signals for multiple symbols and multiple time frames. The signals are created as a simple ratios which represent the distance between the current price and the moving average measured in standard deviations. This way we create a very versatile and easy to use indicator which helps us to identify not only the strongest trends but also the most overbought and oversold conditions. Features Accurate signals in real time for multiple time frames and multiple
Pivot Points Pro
Tsvetan Tsvetanov
This indicator is based on the classic Pivot Points concept combined with additional optimizations and advanced features.  The levels of support and resistance are calculated by taking into account the average historical volatility.  The added multi-symbol scanner allows you to detect the best conditions and trade setups.  You can see in real time the current situation for all of your favorite symbols and you can switch the chart to any symbol with one click. The build in alert system allows you
FX28 Trader
Tsvetan Tsvetanov
5 (1)
介绍FX28 Trader Dashboard – 您的终极交易管理工具 通过FX28 Trader Dashboard,解锁您交易体验的全部潜力,这是一款全面而直观的交易管理工具,旨在将您的外汇交易提升到新的水平。无论您是经验丰富的交易员还是刚刚开始您的金融之旅,这个强大的工具旨在简化您的交易活动并提高您的决策过程。 主要特点: 用户友好界面: FX28 Trader Dashboard拥有用户友好的界面,适应各个层次的交易员。通过几次点击轻松导航各种功能和工具,确保您只需轻松几下就完全掌控了交易。 实时市场数据: 利用实时市场数据源,始终保持领先地位,为您提供有关货币对、趋势和市场波动的最新信息。做出明智的决策,充满信心地执行交易。 高级交易分析: 通过高级分析深入了解您的交易绩效。跟踪交易历史,分析趋势,并识别模式,以优化您的策略和改善您的结果。 风险管理工具: 用我们强大的风险管理工具保护您的投资。轻松设置止损和获利订单,自定义仓位大小,并轻松实施风险收益比,确保自律和受控的交易方法。 多时间框架分析: FX28 Trader Dashboard允许您同时分析不同时间框架的市
Interactive RSI Matrix MT5
Tsvetan Tsvetanov
5 (1)
This indicator shows the current RSI values for multiple symbols and multiple timeframes and allows you to switch between timeframes and symbols with one click directly from the matrix. With this indicator, you can analyze large number of symbols across multiple timeframes and detect the strongest trends in just a few seconds. Features Shows RSI values for multiple symbols and timeframes simultaneously. Colored cells with progressive color intensity depending on the RSI values. Ability to chang
FX28 Trader MT5
Tsvetan Tsvetanov
3 (1)
介绍FX28 Trader Dashboard – 您的终极交易管理工具 通过FX28 Trader Dashboard,解锁您交易体验的全部潜力,这是一款全面而直观的交易管理工具,旨在将您的外汇交易提升到新的水平。无论您是经验丰富的交易员还是刚刚开始您的金融之旅,这个强大的工具旨在简化您的交易活动并提高您的决策过程。 主要特点: 用户友好界面: FX28 Trader Dashboard拥有用户友好的界面,适应各个层次的交易员。通过几次点击轻松导航各种功能和工具,确保您只需轻松几下就完全掌控了交易。 实时市场数据: 利用实时市场数据源,始终保持领先地位,为您提供有关货币对、趋势和市场波动的最新信息。做出明智的决策,充满信心地执行交易。 高级交易分析: 通过高级分析深入了解您的交易绩效。跟踪交易历史,分析趋势,并识别模式,以优化您的策略和改善您的结果。 风险管理工具: 用我们强大的风险管理工具保护您的投资。轻松设置止损和获利订单,自定义仓位大小,并轻松实施风险收益比,确保自律和受控的交易方法。 多时间框架分析: FX28 Trader Dashboard允许您同时分析不同时间框架的市
推出最新版本的 MT5 动态斐波那契网格仪表盘(Dynamic Fibonacci Grid Dashboard)。 全新版本配备了众多新功能,为您的交易体验带来彻底升级,并让您从全新的角度观察市场和价格行为。通过同时分析多个时间周期和多个交易品种,探索更多可能性。界面友好,支持手动交易和持仓管理,并大幅扩展了预设自动化策略的应用能力。此外,DFG 现在在策略测试器中可作为交易模拟器全面运行,您可以使用历史数据重现不同的交易环境。在可视化模式中练习手动交易,在高速模式中测试自动化策略。 主要功能 • 基于动态斐波那契通道(Dynamic Fibonacci Bands)的多周期、多品种高级技术分析。 通过我们的实时市场监控仪表盘,体验前所未有的高效分析能力。我们将来自 M1、M5、M15 和 H1 图表的复杂数据合成为易于理解的网格水平。这种独特呈现方式让交易者能够在同一个屏幕上监控 10 个不同品种的价格行为,而无需依赖传统图表。结果是更快速的决策过程,以及更简洁、不杂乱的交易环境。 • 可自定义且用户友好的界面,集成最重要的功能。 包括账户状态与信息、快捷手动交易与持仓管理按
筛选:
无评论
回复评论