Candle by Seconds

4.49


它是专为日内操作而开发的,允许市场操作员创建非常规的烛台图,以逃避OHLC的传统点(开盘,最高价,最低价和收盘价)。


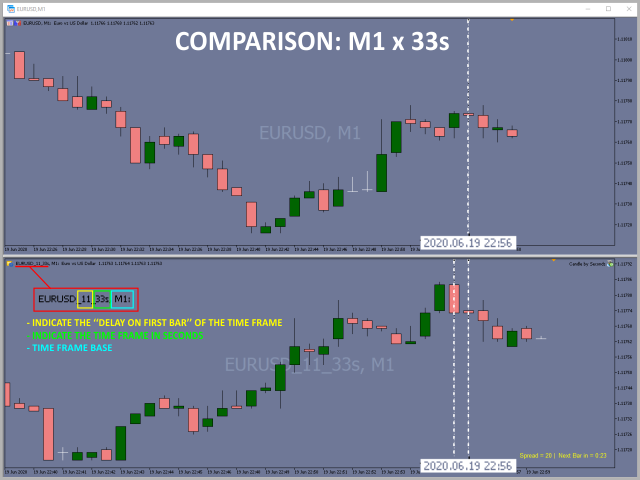
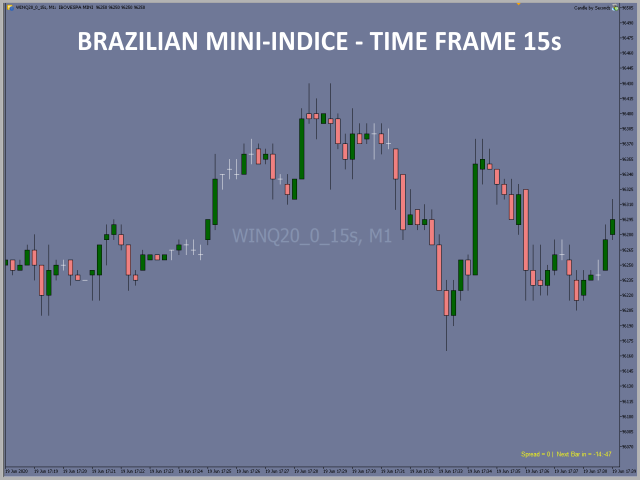
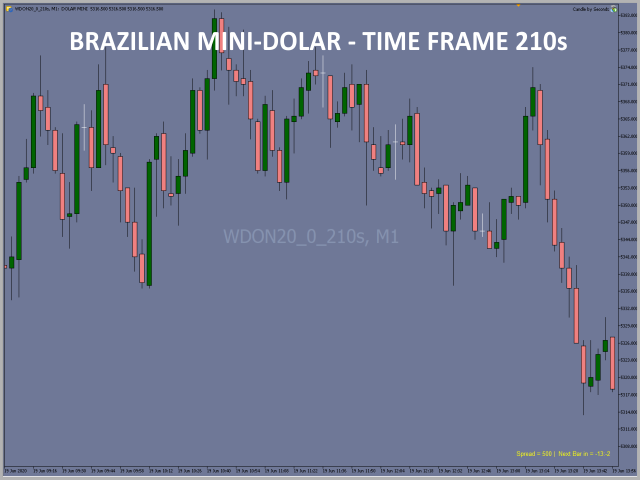
该EA交易在任何时间范围内以秒为单位组装定制蜡烛。您可以生成标准Metatrader 5时段中不可用的图表,例如:生成27秒非常规时间范围的图表,或者,如果要生成7分钟时间范围,只需键入“ 420秒”,输入11分钟“ 660秒”等等。


一些重要的准则

[1]始终使用M1时间范围插入EA;

[2] CANDLE BY SECONDS将创建一个离线图表,根据M1时间范围的当前柱线开始您的柱线序列;


[3]
复制从图表中插入日期起最近5天的历史记录;


[4]
如果您想在EA创建第一个图表后打开同一时间段的更多图表,只需在Metatrader 5上单击“创建新图表”按钮,选择“自定义”选项,然后选择“时间图表” 。 您将看到创建的时间范围,因此只需选择一个新窗口即可。 对每个新副本重复此步骤。


设定


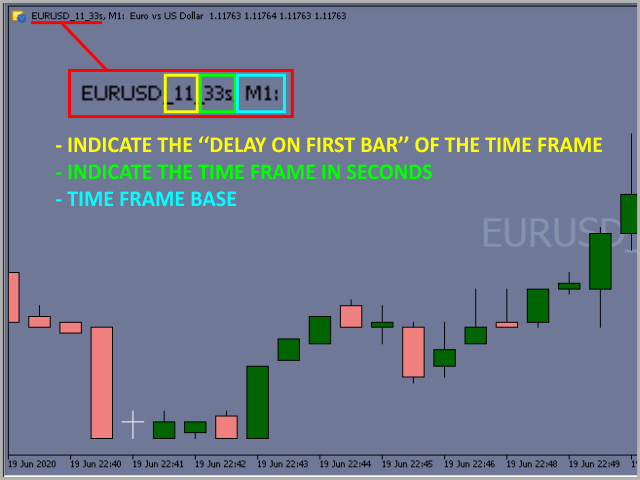
[ Candle Custom ]  Seconds = 以秒为单位设置任意数字以形成条形图的时间范围

[ Candle Custom ]  First Bar delay (Seconds) = 
以开始条形成之前的秒数为单位设置延迟(1到59秒)

[ Candle Custom ]  Chart mod = 选择选项“当前窗口”以在M1当前时间打开新图表,或者选择“新建窗口”,从而允许在打开的新窗口中应用其他EA

[ Spread|Countdown ]  Enable = 选择“是”或“否”以在图表上显示价差和秒数倒计时的信息

[ Spread|Countdown ]  Corner = 选择图表上的位置角以显示信息

[ Spread|Countdown ]  Font size = 选择信息的字体大小

[ Spread|Countdown ]  Font color = 选择信息的字体颜色


评分 59
Mehdi Zamani
20
Mehdi Zamani 2025.06.30 08:29 
 

Hi, this is really good. Thanks.

Gabor Ludovic Schiefer
255
Gabor Ludovic Schiefer 2025.06.25 14:47 
 

works just fine, awesome algo overall

Ahmad Saleh
18
Ahmad Saleh 2025.06.24 18:01 
 

The expert advisor isn't working for me. This is the message that appears when I run it: "2025.06.24 20:54:09.829 Experts initializing of Candle by Seconds (US30_SPOT,M1) failed with code 1." It seems that it doesn't support all symbols on MetaTrader. Note that I tested it on another platform. Their symbol drawing format is different, and it worked fine.

推荐产品
Rainbow MT5
Jamal El Alama
4 (1)
Description : Rainbow MT5 is a technical indicator based on Moving Average with period 34 and very easy to use. When price crosses above MA and MA changes color to green, then this is a signal to buy. When price crosses below MA and MA changes color to red, then this is a signal to sell. The Expert advisor ( Rainbow EA MT5 ) based on Rainbow MT5 indicator is now available here . MT4 version is available here .
FREE
MACD Enhanced
Nikita Berdnikov
5 (3)
Introducing the MACD  Enhanced – an advanced MACD (Moving Average Convergence Divergence) indicator that provides traders with extended capabilities for trend and momentum analysis in financial markets. The indicator uses the difference between the fast and slow exponential moving averages to determine momentum, direction, and strength of the trend, creating clear visual signals for potential entry and exit points. Attention! To achieve the best results, it is recommended to adapt the indicator
FREE
LT Donchian Channel
Thiago Duarte
4.83 (6)
Donchian Channel is an indicator created by Richard Donchian. It is formed by taking the highest high and the lowest low of the last specified period in candles. The area between high and low is the channel for the chosen period. Its configuration is simple. It is possible to have the average between the upper and lower lines, plus you have alerts when price hits one side. If you have any questions or find any bugs, please contact me. Enjoy!
FREE
Follow The Line MT5
Oliver Gideon Amofa Appiah
4.6 (35)
This indicator obeys the popular maxim that: "THE TREND IS YOUR FRIEND" It paints a GREEN line for BUY and also paints a RED line for SELL. (you can change the colors). It gives alarms and alerts of all kinds. IT DOES NOT REPAINT and can be used for all currency pairs and timeframes. Yes, as easy and simple as that. Even a newbie can use it to make great and reliable trades. NB: For best results, get my other premium indicators for more powerful and reliable signals. Get them here: https://www.m
FREE
Trendline mt5 indicator
David Muriithi
3 (1)
Are you tired of drawing trendlines every time you're analyzing charts? Or perhaps you would like more consistency in your technical analysis. Then this is for you. This indicator will draw trend lines automatically when dropped on a chart. How it works Works similar to standard deviation channel found on mt4 and mt5. It has 2 parameters: 1. Starting Bar 2. Number of bars for calculation The   starting bar   is the bar which drawing of the trend lines will begin, while the   number of bars for c
FREE
概述 本指标是经典 Donchian 通道 的增强版,增加了多种实用的交易功能。 除了标准的三条线(最高、最低和中线),系统能够检测 突破 ,并在图表上用箭头进行可视化标记,同时只显示 与当前趋势方向相反的那条线 ,让图表更加简洁。 功能包括: 可视化信号 :突破时在图表上绘制彩色箭头 自动通知 :弹窗、Push 推送和 Email 邮件 RSI 过滤 :根据市场相对强弱验证信号 个性化设置 :颜色、线条粗细、箭头符号、RSI 阈值等 工作原理 Donchian 通道计算: 上轨线 :最近 N 根已收盘 K 线的最高价 下轨线 :最近 N 根已收盘 K 线的最低价 中线 :最高价和最低价的平均值 看涨突破 :收盘价高于上轨线 看跌突破 :收盘价低于下轨线 指标会: 绘制三条 Donchian 通道线 仅在 方向变化后的首次突破 绘制箭头 隐藏顺应趋势方向的那条线(上涨趋势: 只显示红色下轨线;下跌趋势: 只显示绿色上轨线) 可选用 RSI 过滤突破信号,减少虚假突破 支持实时发送通知 参数说明 Donchian 通道设置 indPeriod :计算通道高低点的已收盘 K 线数量 Lin
FREE
Indicador Monte Carlo Simulation Indicador faz uma regressão linear nos preços de fechamento do ativo escolhido e gera uma simulação de Monte Carlo de N preços aleatórios para definir 3 níveis de sobrecompra e 3 níveis de sobrevenda. O primeiro processo é a Regressão Linear dos preços de fechamento do ativo, no qual é regido pela equação: Y = aX + b + R Onde   Y   é o valor do ativo escolhido,  X   é o tempo,   a   é a inclinação da reta,   b   é a intersecção da reta e   R   é o resíduo. O resí
FREE
Tabajara V5
Flavio Javier Jarabeck
4.83 (35)
Metatrader 5 version of the famous Andre Machado's Tabajara indicator. If you don't know Andre Machado's Technical Analysis work you don't need this indicator... For those who need it and for those several friend traders who asked this porting from other platforms, here it is... FEATURES 8-period Moving Average 20-period Moving Average 50-period Moving Average 200-period Moving Average Colored candles according to the inflexion of the 20-period MA SETTINGS You can change the Period of all MA's
FREE
Friend of the trend
Anderson De Assis
Friend of the Trend: Your Trend Tracker Master the market with Friend of the Trend , the indicator that simplifies trend analysis and helps you identify the best moments to buy, sell, or wait. With an intuitive and visually striking design, Friend of the Trend analyzes price movements and delivers signals through a colorful histogram: Green Bars : Signal an uptrend, indicating buying opportunities. Red Bars : Alert to a downtrend, suggesting potential selling points. Orange Bars : Represent cons
FREE
Binary Profit Gainer
Myo Min Aung
5 (2)
This indicator is especially for the binary trading. Time frame is 1 minutes and exp time 5 or 3 minutes only. You must be use martingale 3 step. So you must put lots size is 10 % at most. You should use Mt2 trading platform to connect with my indicator to get more signal without human working. This indicator wining rate is over 80% but you may get 100% of profit by using martingale 3 step. You should use MT2 Trading Platform to connect meta trader platform and binary platform . You can get mt2
FREE
Coral Indi
Dinh Duong Luong
Coral trend is   a trend-following indicator that is widely popular among FOREX traders . It is usually used as a confluence with other indicators. It uses combinations of moving averages with complex smoothing formulas! It has two configurable parameters: Coefficient   - smoothing ratio (*) Applied price Calculation: Coral = (-0.064) * B6 + 0.672 * B5 - 2.352 * B4 + 2.744 * B3
FREE
Free automatic Fibonacci is an indicator that automatically plots a Fibonacci retracement based on the number of bars you select on the BarsToScan setting in the indicator. The Fibonacci is automatically updated in real time as new highest and lowest values appears amongst the selected bars. You can select which level values to be displayed in the indicator settings. You can also select the color of the levels thus enabling the trader to be able to attach the indicator several times with differe
FREE
Girassol Sunflower MT5 Indicator
Saullo De Oliveira Pacheco
4.33 (6)
This is the famous Sunflower indicator for Metatrader5. This indicator marks possible tops and bottoms on price charts. The indicator identifies tops and bottoms in the asset's price history, keep in mind that the current sunflower of the last candle repaints, as it is not possible to identify a top until the market reverses and it is also not possible to identify a bottom without the market stop falling and start rising. If you are looking for a professional programmer for Metatrader5, please
FREE
ADX Histogram Indicator
Thiago Pereira Pinho
The   ADX  Histogram   is a modern and visual upgrade of the classic   Average Directional Index (ADX) . It transforms the standard ADX and DI+ / DI– values into a   color-coded histogram , making trend analysis much clearer and faster.  Key Features: Histogram with four states :  Blue = Normal Buy Trend Green = Strong Buy Trend  Orange = Normal Sell Trend  Red = Strong Sell Trend Automatic strength detection : uses the ADX line to separate “normal” vs. “strong” signals.  Fully customizable: ADX
FREE
Supports And Resistances Lines
Francisco Gomes Da Silva
4.66 (44)
支撑和阻力区指标 MT5 此指标知道如何自动识别顶部和底部。 此支撑和阻力指标根据顶部和底部创建支撑线和阻力线。 如何制作支撑线和阻力线。 这是制作自动支撑线和阻力线的指标。 如何使用指标找到支撑位。 此指标自动找到顶部和底部。 每次“之字折线”自动创建底部或使新底部低于前一个底部时,指标都会自动创建支撑线,因此指标会自动在屏幕上绘制自动支撑线。 如何创建阻力线。 指标自动创建阻力线的方式与创建支撑位的方式相同,只要“之字折线”形成新的顶部或高于前一个顶部的顶部,因此指标会自动创建新的阻力,因此您不会必须担心顶部和底部水平在哪里。 此指标是交易者用支撑和阻力标记图表的简便方法。 如何标记顶部。 顶部由“ZigZag”自动设置,然后在该级别绘制一条阻力线以标记该顶部。 如何标记底部 “之字折线”也会自动设置底部,然后创建一条支撑线来标记该底部。 支撑和阻力区 MT5 顶部和底部区域 底部区域 您可以将支撑区域的刻度宽度设置为占据整个支撑区域,而不仅仅是在底部画一条线 热门区域 以与定义阻力区相同的方式,使用刻度来增加顶部区域线的宽度 顶部和底部的范围 该指标的主要功能是轻松识别图表中的空
FREE
Daily Support and Resistance Levels 是一款专业指标,基于经典枢轴点方法自动计算并显示日内交易关键价格水平。 主要功能: 自动计算枢轴点(PP) 三个阻力位(R1, R2, R3) 三个支撑位(S1, S2, S3) 显示前一天高点/低点 实时信息面板 市场趋势方向(多头/空头)提示 显示与最近价格水平的距离 完全自定义颜色与样式 每日自动更新 支持所有周期 计算方法:基于昨日最高价、最低价、收盘价的经典枢轴点算法。 交易用途: 支撑/阻力反弹交易 突破策略 区间震荡交易 市场方向判断 盈利目标设置 使用方法: 将指标加载到图表 自动生成水平线 价格 > PP = 多头倾向 价格 < PP = 空头倾向 S1-S3 = 支撑区域 R1-R3 = 阻力区域 自定义设置: 枢轴点/支撑/阻力颜色 线条宽度与样式 显示/隐藏价格标签 显示/隐藏信息面板 面板位置与字体大小 显示/隐藏前日高低点 优点: 专业界面 无重绘 资源占用低 支持所有经纪商 适合剥头皮与日内交易 免费用于展示我的MQL5能力 如果喜欢,请留下评价。
FREE
Bar Color Trend
Germano Chagas
4.38 (8)
Combining the best of Price Action , Directional Movement , and Divergence/Convergence analysis, Candle Color Trend is a easy and reliable way to identify trend direction. The indicator automatically paints the candles according to the assumption that an uptrend is defined by prices that form a series of higher highs and higher lows. In contrast, a downtrend is defined by prices that form a series of lower highs and lower lows. Additionally, ADX Wilder indicator is used to measure trend weakness
FREE
SDZ Trend Pro
Van Toan Nguyen
Overview SDZ Trend Pro is a professional Expert Advisor work for all symbol, recommend  XAUUSD (Gold) trading on the H1 timeframe . It combines dynamic price action patterns, EMA filters, and strict session-based trading logic to identify precise market entries with optimal risk control. This EA is ideal for traders who prefer structured, time-filtered trading during active market hours. ️ Core Features Dynamic Stop Loss (SL) logic Automatically sets SL based on candle pattern Chooses the
BlueBoat – Prime Cycle is a technical indicator for MetaTrader 5 that visualizes market cycles based on the Fimathe cycle model (Marcelo Ferreira) . It identifies and displays historic and live cycle structures such as CA, C1, C2, C3, etc., helping traders understand the rhythm and timing of price movement across multiple sessions. This tool is ideal for manual analysis or as a supporting signal in discretionary strategies. Key Features Historical Cycle Analysis – Backtest and visualize as many
High Low Open Close
Alexandre Borela
4.98 (42)
如果你象这个项目一样,就有5个饥饿审查。 这项指标采用了既定价格的公开、高、低价和关闭价格 可以对特定时间区加以调整。 许多机构和专业人士都认为这些是重要的。 贸易商可以为你了解他们可能更进一步的地点, 积极。 现有期间为: 前一日。 前一星期。 曾任Month。 曾任。 前一年。 或: 目前日。 目前周。 目前 Month。 目前配额。 今年。
FREE
Weis Waves
Flavio Javier Jarabeck
2.83 (18)
The original author is David Weis, an expert in the Wyckoff Method. The Weis Wave is a modern adaptation of the 1930's Wyckoff Method, another expert in Tape Reading techniques and Chart Analysis. Weis Waves takes market volume and stacks it into waves according to price conditions giving the trader valuable insights about the market conditions. If you want to learn more about this subject you can find tons of videos in YouTube. Just look for "The Wickoff Method", "Weis Wave" and "Volume Spread
FREE
Cybertrade Keltner Channels
Emanuel Andriato
4.75 (4)
Cybertrade Keltner Channels - MT5 Created by Chester Keltner, this is a volatility indicator used by technical analysis. It is possible to follow the trend of financial asset prices and generate support and resistance patterns. In addition, envelopes are a way of tracking volatility in order to identify opportunities to buy and sell these assets. It works on periods longer than the period visible on the chart. All values ​​are available in the form of buffers to simplify possible automations.
FREE
Value Chart Candlesticks
Flavio Javier Jarabeck
4.69 (13)
The idea of a Value Chart indicator was presented in the very good book I read back in 2020 , " Dynamic Trading Indicators: Winning with Value Charts and Price Action Profile ", from the authors Mark Helweg and David Stendahl. The idea is simple and the result is pure genius: Present candlestick Price analysis in a detrended way! HOW TO READ THIS INDICATOR Look for Overbought and Oversold levels. Of course, you will need to test the settings a lot to find the "correct" one for your approach. It
FREE
ATR Plus
Ivan Pochta
ATR Plus is an enhanced version of the classic ATR that shows not just volatility itself, but the directional energy of the market . The indicator converts ATR into a normalized oscillator (0–100), allowing you to clearly see: who dominates the market — buyers or sellers when a trend begins when a trend loses strength when the market shifts into a range where volatility reaches exhaustion zones ATR Plus is perfect for momentum, trend-following, breakout and volatility-based systems. How ATR Plus
FREE
Important Lines
Terence Gronowski
4.87 (23)
This indicator displays Pivot-Lines, preday high and low, preday close and the minimum and maximum of the previous hour. You just have to put this single indicator to the chart to have all these important lines, no need to setup many single indicators. Why certain lines are important Preday high and low : These are watched by traders who trade in a daily chart. Very often, if price climbs over or falls under a preday low/high there is an acceleration in buying/selling. It is a breakout out of a
FREE
Automatic Trendlines
Pasi Hakamaki
4.69 (48)
该指标在图表上绘制趋势线。该指标有六个输入。用户可以为这两行指定替代标签。如果使用了指标的多个实例,则标签必须不同。用户可以设置线条的宽度和颜色以及深度,以指定应使用哪些显着的峰。例如,“深度= 10”使用当前的峰和谷设置趋势线,这些峰和谷在右侧和左侧至少有10条,并且高/低比峰值的高/低小/大。指标还绘制以前的高峰和低谷。指示器还具有警报功能,当价格与支撑线/阻力线相距预设距离时,可用于通知用户。警报距离以点为单位设置。.............................................................................................
FREE
Donchian Pro
Paulo Henrique Faquineli Garcia
5 (3)
The Donchian Channel Channels are among the most popular tools of technical analysis, as they visually convey to the analyst the limits within which most price movement tends to occur. Channel users know that valuable information can be obtained at any time, whether prices are in the central region of a band or close to one of the border lines. One of the best known techniques to explore these concepts is Bollinger Bands. However, John Bollinger was not the only one to research the application
FREE
This indicator is a zero-lag indicator and displays  strength of trend change . True Trend  Oscillator Pro works best in combination with True Trend Moving Average Pro that displays exact trend as is. Oscillator value is exact price change in given direction of the trend. True Trend Moving Average Pro: https://www.mql5.com/en/market/product/103586 If you set PERIOD input parameter to 1 this indicator becomes a sharpshooter for binary options. Developers can use True Trend Oscillator in Exper
FREE
VFI Quantum
Nikita Berdnikov
5 (1)
Introducing VFI (Volume Flow Indicator) – a trading indicator that analyzes the relationship between volume and price movement to identify key trading opportunities. The indicator displays the strength and direction of volume flow, providing clear signals about potential entry and exit points. Signals are formed based on zero line crossovers, crossovers between the VFI line and its exponential moving average (EMA), and when the indicator exits overbought and oversold zones. Attention! This stra
FREE
RSI abcd
Francisco Gomes Da Silva
3 (1)
RSI ABCD形态查找器:技术策略 1. 指标工作原理 结合 经典RSI 与自动检测 ABCD谐波形态 。 主要组件 标准RSI (可调周期) 高低点标记 (箭头) ABCD形态 (绿/红线) 超买(70)和超卖(30)过滤器 2. MT5设置 period = 14 ; // RSI周期 size = 4 ; // 最大形态尺寸 OverBought = 70 ; // 超买水平 OverSold = 30 ; // 超卖水平 Filter = USE_FILTER_ YES ; // 确认过滤器 3. 交易策略 3.1. 买入信号(看涨ABCD) 条件: RSI形成: 低点( A ) → 高点( B ) → 更高低点( C ) D 高于超卖区(30)但低于 C 确认:绿色连线A-B-C-D 目标: TP1: B-C的61.8% TP2: B-C的100% 止损: 低于 D 3.2. 卖出信号(看跌ABCD) 条件: RSI形成: 高点( A ) → 低点( B ) → 更低高点( C ) D 低于超买区(70)但高于 C 确认:红色连线A-B-C-D 目标: TP1: B-C的6
FREE
该产品的买家也购买
Trade Assistant MT5
Evgeniy Kravchenko
4.41 (205)
它有助于计算每笔交易的风险,容易安装新的订单,具有部分关闭功能的订单管理, 7 种类型的追踪止损和其他有用的功能。   附加材料和说明 安装说明   -   应用程序说明   -   模拟账户应用程序的试用版 线条功能  - 在图表上显示开仓线、止损线、止盈线。 有了这个功能,就可以很容易地设置一个新的订单,并在开仓前看到它的附加特性。   风险管理  - 风险计算功能在考虑到设定的风险和止损单的大小的情况下,计算新订单的成交量。它允许你设置任何大小的止损,同时观察设定的风险。 批量计算按钮 - 启用 / 禁用风险计算。 在 " 风险 " 一栏中设置必要的风险值,从 0 到 100 的百分比或存款的货币。 在 " 设置 " 选项卡上选择风险计算的变量: $ 货币, % 余额, % 资产, % 自由保证金, % 自定义, %AB 前一天, %AB 前一周, %AB 前一个月。   R/TP 和 R/SL - 设置止盈和止损的关系。 这允许你设置相对于损失的利润大小。 例如, 1 : 1 - 这决定了 TP = SL 的大小。 2 : 1 - 这意味着 TP 是 SL 的两倍。 RR -
欢迎来到 Trade Manager EA——这是一个终极风险管理工具,旨在使交易变得更直观、精准和高效。它不仅仅是一个下单工具,而是一个用于无缝交易计划、仓位管理和风险控制的全面解决方案。不论您是新手交易员、资深交易员,还是需要快速执行的剥头皮交易员,Trade Manager EA 都可以满足您的需求,适用于外汇、指数、大宗商品、加密货币等各种市场。 借助 Trade Manager EA,复杂的计算已成过去。只需分析市场,在图表上用水平线标记入场、止损和止盈,设置您的风险水平,Trade Manager 就会立即计算出理想的头寸规模,并实时显示以点、账户货币计价的止损和止盈。每笔交易都得以轻松管理。 主要功能: 头寸规模计算器 :根据定义的风险瞬间确定交易规模。 简单的交易计划 :在图表上用可拖动的水平线直接计划交易,设置入场、止损和止盈。 实时显示 SL 和 TP :以账户货币、点或分显示止损和止盈,便于分析。 高级保护工具 盈亏平衡选项 : 基本盈亏平衡 :当您的交易达到设定水平时自动保护利润。 多级盈亏平衡 :设置多达 4 个级别以逐步保护利润。 尾随止损选项 : 基本尾随
Local Trade Copier EA MT5
Juvenille Emperor Limited
4.96 (119)
通过 Local Trade Copier EA MT5 获得非常快速的交易复制体验。它的简单1分钟设置,使您可以在同一台Windows计算机或Windows VPS上在多个MetaTrader终端之间复制交易,具有闪电般快速的复制速度,低于0.5秒。 无论您是初学者还是专业交易者, Local Trade Copier EA MT5 都提供了广泛的选项,可根据您的特定需求进行自定义。对于任何希望增加利润潜力的人来说,这都是终极解决方案。 今天就尝试一下,看看为什么它是市场上最快、最简单的贸易复印机! 提示: 您可以在您的模拟账户中下载并试用 Local Trade Copier EA MT5 模拟版: 这里 将下载的免费演示文件粘贴到您的 MT5 >> 文件 >> 打开数据文件夹 >> MQL5 >> 专家文件夹并重新启动您的终端。  免费演示版本每次可在 4 小时内发挥全部功能,仅限演示帐户。 要重置试用期,请转至 MT5 >> 工具 >> 全局变量 >> Control + A >> 删除。 请仅在非关键模拟账户上执行此操作,不要在挑战道具公司账户中执行此操作。 Local
TradePanel MT5
Alfiya Fazylova
4.86 (148)
交易面板是一个多功能的交易助手。该应用程序包含超过 50 个用于手动交易的交易功能,并允许您自动化大多数交易操作。 注意,该应用程序在策略测试器中不起作用。购买之前,您可以在模拟帐户上测试演示版本。演示版 这里 。 完整说明 这里 。 贸易。 让您一键执行交易操作: 通过自动风险计算打开挂单和仓位。 一键打开多个订单和仓位。 打开订单网格。 按组关闭挂单和持仓。 头寸反转(关闭买入并打开卖出或关闭卖出并打开买入)。 锁定头寸(开立额外头寸,以平衡买入和卖出头寸的交易量)。 一键部分平仓所有仓位。 为同一价格水平的所有头寸设置止盈和止损。 将所有头寸的止损设置为该头寸的盈亏平衡水平。 开单建仓时,您可以应用以下功能: 计算交易量的多个订单或仓位之间的分布(一键开仓多个订单或仓位时)。 图表上未来订单交易水平的可视化。 设置开仓时允许的最大点差大小。 止盈和止损之间的自动比率。 虚拟止损和止盈。 根据当前点差的大小自动增加止损和止盈的大小。 根据 ATR 指标的读数计算止盈和止损。 设置挂单的到期日期。 挂单设置为“追踪”(挂单自动跟随当前价格移动指定距离)。 管理通过移动终端(手机)开立
测试版发布 Telegram to MT5 Signal Trader 即将进入正式的 Alpha 版本。一些功能仍在开发中,您可能会遇到一些小错误。如果您遇到问题,请反馈,您的意见将帮助我们改进软件。 价格将在售出 20 份后上涨。剩余 $90 的副本: 2/20 。 Telegram to MT5 Signal Trader 是一款强大的工具,能够将 Telegram 频道或群组的交易信号自动复制到您的 MetaTrader 5 账户。 支持公开和私人频道,可将多个信号提供者连接至一个或多个 MT5 账户。软件优化、高效、稳定,精准控制每笔复制交易。 界面简洁,仪表盘美观,图表交互性佳,导航直观。您可以管理多个信号账户,自定义每个提供者的设置,并实时监控所有操作。 系统需求 由于 MQL 限制,EA 需要配合 PC 端应用与 Telegram 通信。 安装程序可通过官方 安装指南 获取。 核心功能 多提供者支持: 从多渠道复制信号至多个 MT5 帐户 高级信号识别: 关键词、模式和标签全面自定义 逐提供者控制: 可启用/禁用特定信号类型、平仓策略等 灵活风险管理: 固定手数、固
Trade Dashboard MT5
Fatemeh Ameri
4.96 (110)
疲于复杂的订单下达和手动计算?Trade Dashboard 是您的解决方案。凭借其用户友好的界面,订单下达变得轻而易举,只需点击一下,您就可以开设交易、设置止损和止盈水平、管理交易手数,并计算风险回报比,让您只需专注于您的策略。告别手动计算,使用 Trade Dashboard 简化您的交易体验。 立即下载演示版本 。 您可以在这里找到仪表盘功能和特性的详细信息 。 加入 Telegram 频道 。 购买后请给我发消息以获取支持。如果您需要添加更多功能,可以在产品的评论区留下您的想法,我愿意听取任何建议,希望您能在使用我的产品时获得最佳体验 。 这是 MT4 版本。 风险管理:使用 Trade Dashboard,可以将您的风险设置为账户余额或权益的百分比,或将风险设置为总金额。在图表上直观地定义您的止损,让工具准确计算每个货币对的适当手数。该工具还可以根据您期望的风险回报比自动设置止盈水平。它甚至可以在手数计算中涵盖佣金和点差费用。此外,您的止损和止盈可以转变为虚拟水平,隐藏于经纪商。通过 Trade Dashboard 的高级风险管理功能,掌控风险,保护您的资本。 交易线
Ultimate Extractor
Clifton Creath
5 (9)
Ultimate Extractor - Professional Trading Analytics for MT5 *****this is the local HTML version of Ultimate Extractor. Check out Ultimate Extractor Cloud on mql5 for the Cloud version****** Ultimate Extractor transforms your MetaTrader 5 trading history into actionable insights with comprehensive analytics, interactive charts, and real-time performance tracking. What It Does Automatically analyzes your MT5 trading history across all Expert Advisors and generates detailed HTML reports with inte
Copy Cat More Trade Copier MT5 (复制猫MT5) 是一个本地跟单软件,也是一个完整的风险管理和执行框架,专为当今的交易挑战而设计。从资金管理公司挑战到个人投资组合管理,它能适应各种情况,结合了稳健的执行、资本保护、灵活配置和高级交易处理功能。 该跟单软件可在主端(发送方)和从端(接收方)模式下工作,实时同步市价单和挂单、交易修改、部分平仓和对冲平仓操作。它兼容模拟和实盘账户、交易或投资者登录,并通过持久的交易记忆系统确保恢复功能,即使EA、终端或VPS重启也不例外。可以同时管理多个主端和从端,使用唯一ID,并通过前缀/后缀调整或自定义品种映射自动处理跨经纪商差异。 手册/设置  | Copy Cat More MT4 | 频道  特色功能: 易于设置——快至30秒(见视频)。 快速、稳定、准确——Turbo模式下低延迟复制(见截图)。 高安全性——不使用潜在危险的DLL或WebRequest。 持久交易记忆,避免孤立、丢失或不准确的交易。 可从手动或EA复制,支持所有账户类型。 品种自动前缀/后缀,快速设置;支持MT4和MT5之间复制。 非常灵活的多主端
Trade copier MT5
Alfiya Fazylova
4.6 (35)
Trade Copier 是一种专业实用程序,旨在复制和同步交易账户之间的交易。 复制发生从供应商的帐户/终端到收件人的帐户/终端,安装在同一台计算机或 vps 上。 在购买之前,您可以在演示帐户上测试演示版本。 演示 这里 。 完整说明 这里 。 主要功能和优点: 支持复制MT5>MT5、MT4>MT5、MT5>MT4,包括МТ5 netting账户。 供应商和收件人模式在同一产品中实现。 简单直观的界面,允许您直接从图表中实时控制复制。 连接中断或终端重新启动时不会丢失设置和位置。 允许您选择要复制的符号,也可以替换接收者的符号,例如 EURUSD> USDJPY。 支持回拷贝。 能够仅复制某些订单。 允许您设置开仓交易价格的最大差异和最大时间延迟。 正确复制部分订单关闭的执行。 计算复制手数的几种方法。 同步止盈和止损。有几种方法可以计算它们的位置。 支持通过执行在“Market account”上工作,其中 SL / TP 仅在开仓后设置。 如何使用简单的设置复制交易 将供应商终端和接收终端安装在同一台计算机或 VPS 上。 在供应商终端上以“Master”模式安装复印机,然后
HINN MagicEntry Extra
ALGOFLOW OÜ
4.67 (12)
HINN MAGIC ENTRY – the ultimate tool for entry and position management! Place orders by selecting a level directly on the chart! full description Key features: - Market, limit, and pending orders - Automatic lot size calculation - Automatic spread and commission accounting - Unlimited partitial take-profits  - Breakeven and trailing stop-loss and take-profit  functions - Invalidation leves - Intuitive, adaptive, and customizable interface - Works with any assets and account types Really feels
MT5 to Telegram Signal Provider 是一个易于使用且完全可自定义的工具,它允许向 Telegram 的聊天室、频道或群组发送 指定 的信号,将您的账户变为一个 信号提供商 。 与大多数竞争产品不同,它不使用 DLL 导入。 [ 演示 ] [ 手册 ] [ MT4 版本 ] [ Discord 版本 ] [ Telegram 频道 ]  New: [ Telegram To MT5 ] 设置 提供了逐步的 用户指南 。 不需要了解 Telegram API;开发者提供了您所需的一切。 关键特性 能够自定义发送给订阅者的订单详情 您可以创建分层的订阅模型,例如铜、银、金。其中金订阅获得所有信号等。 通过 id、符号或评论过滤订单 包括执行订单的图表截图 在发送的截图上绘制已关闭的订单,以便额外核实 延迟发送新订单消息的可能性,以便在发送前对位置进行调整 订单详情完全透明: 新的市场订单*带截图 订单修改(止损、获利) 已关闭的订单*带截图 部分关闭的订单** 新的挂单 修改的挂单(进场价格) 挂单激活(作为新的市场订单附加) 已删除的挂单 历史订单报告
Telegram To MT5 Receiver
Levi Dane Benjamin
4.53 (15)
将信号从您所属的任何渠道(包括私人和受限渠道)直接复制到您的 MT5。 该工具在设计时充分考虑了用户的需求,同时提供了管理和监控交易所需的许多功能。 该产品采用易于使用且具有视觉吸引力的图形界面。 自定义您的设置并在几分钟内开始使用该产品! 用户指南 + 演示  |   MT4版本  |   不和谐版本 如果您想尝试演示,请参阅用户指南。 Telegram To MT5 接收器在策略测试器中不起作用! Telegram 至 MT5 功能 一次复制多个通道的信号 从私人和受限频道复制信号 不需要机器人令牌或聊天 ID(如果出于某种原因需要,您仍然可以使用这些) 使用风险百分比或固定手数进行交易 排除特定符号 选择复制所有信号或自定义要复制的信号 配置单词和短语以识别所有信号(默认值应适用于 99% 的信号提供商) 配置时间和日期设置以仅在需要时复制信号 设置一次打开的最大交易量 交易和头寸管理 使用信号或自动设置的管理 通过设置每月、每周、每天、每小时或每分钟的最大交易次数,停止过度交易和报复性交易。 支持市价订单和挂单 每日最大利润目标(以美元为单位)以确保头寸并停止过度交易 确
Smart Stop Manager – 专业级自动化止损管理系统 概述 Smart Stop Manager 是 Smart Stop 产品线的执行核心,为需要结构化、可靠且全自动止损管理的交易者而设计。它持续监控所有持仓,根据 Smart Stop 市场结构逻辑计算最佳止损位置,并按照清晰透明的规则自动更新止损。 无论是管理单一品种还是多品种组合,Smart Stop Manager 都能为每笔交易提供纪律性、一致性和全面的风险可视化。它减少情绪化判断,降低手动操作负担,并确保止损始终基于真实的市场结构进行调整。 功能亮点 基于市场结构的自动止损计算 • 自动评估所有持仓,并根据 Smart Stop 逻辑应用最佳止损水平。 一站式组合管理面板 • 显示交易品种、方向、Magic Number、手数、开仓价、当前价、推荐止损、点差距离、浮动盈亏、风险敞口及实时状态标签。 DPI 自适应专业界面 • 在高分辨率屏幕上呈现清晰锐利的显示效果,布局会动态适配窗口。 清晰的状态标签 • 每笔交易都会标注当前状态,让交易者即时了解风险状况。 高级特殊情况识别 • 智能识别逆趋势
Smart Stop Scanner – 多品种结构化止损扫描系统 概述 Smart Stop Scanner 为交易者提供跨市场的专业止损结构监控。系统基于真实市场结构、关键突破点以及价格行为逻辑,自动识别最有意义的止损区域,并在统一的、高度清晰、DPI 自适应面板中展示所有信息。 适用于 Forex、黄金、指数、金属、加密货币等多种资产。 止损如何计算 本系统并未使用传统指标或任意公式,而是通过纯价格行为识别 突破、更高高点、更低低点 等结构事件。 止损位置基于这些结构节点生成,因此更加真实、自然,并与实际市场行为紧密吻合。 核心功能亮点 • 多品种精准兼容 完整支持外汇、黄金、指数、金属、加密资产及其他工具,自动处理不同的点值和小数位。 • 即时结构识别 实时检测新的、失效的和当前有效的止损结构,并提供方向、形成时间、距离等关键信息。 • SL %ADR – 自适应止损质量评估 每个止损都会与该品种历史的结构性止损事件进行统计对比。 自适应颜色区间清晰显示止损是 极紧、紧、适中、宽、非常宽 。 基于真实波动率,而非固定阈值。 • Dist % – 实时止损距离
Exp COPYLOT CLIENT for MT5
Vladislav Andruschenko
3.82 (34)
MT5 交易复印机是 МetaТrader 5 平台的交易复印机 。 它复制外汇交易 之间   任何账户 MT5   -   MT5, MT4   -   MT5 对于 COPYLOT MT5 版本(或 MT4   - MT4 MT5   -   MT4 对于 COPYLOT MT4 版本) 值得信赖的复印机! MT4版本 详细描述   +DEMO +PDF 如何购买 如何安装     如何获取日志文件     如何测试和优化     Expforex 的所有产品 您还可以在 МТ4 终端 (   МТ4   -   МТ4, МТ5   -   МТ4   ) 中 复制交易: COPYLOT CLIENT for MT4 此版本包括在终端 МТ5   -   МТ5, МТ4   -   МТ5 之间 。 交易复制器用于在 2/3/10 终端之间复制交易/头寸。 支持从模拟账户和投资账户复制。 该程序可以在多个终端绑定上运行。 使用它作为您在一个账户上交易的各种投资者账户的交易的同步器, - COPYLOT 会将您的交易复制到其他终端。 从 多个 终端复制到一个; 从一个终端复
The product will copy all telegram signal to MT5 ( which you are member) , also it can work as remote copier.  Easy to set up, copy order instant, can work with almost signal formats, image signal,  s upport to translate other language to English Work with all type of channel or group, even channel have "Restrict Saving Content", work with  multi channel, multi MT5 Work as remote copier: with signal have ticket number, it will copy exactly via ticket number. Support to backtest signal. How to s
KT Equity Protector MT5
KEENBASE SOFTWARE SOLUTIONS
4.25 (4)
轻松保护您的交易资金 保护交易资金与增长资金同等重要。KT Equity Protector 是您的个人风险管理助手,持续监控账户权益,在达到预设的利润目标或止损水平时,自动关闭所有持仓和挂单,以防止亏损或锁定盈利。 无需情绪化的决策,也不再需要猜测——只需让这个可靠的资金保护工具为您全天候守护账户。 KT Equity Protector 可自动通过关闭所有图表来阻止其他交易机器人继续操作。这确保在您手动重新启动 KT Equity Protector 之前,不会发生任何进一步的交易行为,从而让您完全掌控并安心交易。 工作原理 权益止损(防止亏损): 假设您的账户余额为 $10,000,设置了 $1,000 的权益止损。一旦账户权益降至 $9,000,KT Equity Protector 将立即关闭所有交易,保护您的资金免受更大亏损。 权益止盈(锁定利润): 同样地,如果您设置了 $2,000 的权益止盈目标,当账户权益达到 $12,000 时,EA 将立即平仓,锁定收益并保障已获得的利润。 两种强大的资金计算模式: 相对模式(基于百分比): 按照账户初始余额的百分比计算止损和
Trade Manager DaneTrades
Levi Dane Benjamin
4.33 (27)
交易管理器可帮助您快速进入和退出交易,同时自动计算风险。 包括帮助您防止过度交易、报复性交易和情绪化交易的功能。 交易可以自动管理,账户绩效指标可以在图表中可视化。 这些功能使该面板成为所有手动交易者的理想选择,并有助于增强 MetaTrader 5 平台。多语言支持。 MT4版本  |  用户指南+演示 交易经理在策略测试器中不起作用。 如需演示,请参阅用户指南 风险管理 根据%或$自动调整风险 可选择使用固定手数或根据交易量和点自动计算手数 使用 RR、点数或价格设置盈亏平衡止损 追踪止损设置 最大每日损失百分比,在达到目标时自动平仓所有交易。 保护账户免遭过多提款并阻止您过度交易 最大每日损失(以美元为单位)在达到目标时自动关闭所有交易。 保护账户免遭过多提款并阻止您过度交易 一键实现所有交易的盈亏平衡 自动计算从手机/电话发送的交易的风险 OCO 在设置中可用 交易和头寸管理 通过设置每月、每周、每天、每小时或每分钟的最大交易次数,停止过度交易和报复性交易。 高级挂单管理。 调整何时关闭挂单的规则 追踪挂单 支持市价订单和挂单 每日最大利润目标(以美元为单位)以确保头寸并停止
The News Filter MT5
Leolouiski Gan
4.74 (19)
这个产品在新闻时间过滤所有的专家顾问和手动图表,因此您不必担心突然的价格波动会破坏您的手动交易设置或其他专家顾问输入的交易。此产品还带有完整的订单管理系统,可在任何新闻发布前处理您的持仓和挂单。一旦您购买了   The News Filter ,您将不再需要依赖以后的专家顾问内置的新闻过滤器,因为这个产品可以从此过滤它们所有。 新闻选择 新闻来源于Forex Factory的经济日历。 选择可以基于任何一种货币,如USD,EUR,GBP,JPY,AUD,CAD,CHF,NZD和CNY等。 选择也可以基于关键识别,例如Non-Farm (NFP),FOMC,CPI等。 能够选择新闻影响级别的筛选,从低、中、到高影响。 自动模式只选择与图表相关的新闻。 新闻来源每小时自动刷新,以确保最新的新闻数据。 为每个新闻影响级别提供单独的输入,以确定您要过滤掉的新闻发布前后的分钟数。 订单管理选项 在新闻发布前关闭未平仓头寸的选项,并在新闻发布后恢复它们。 在新闻发布前删除挂单的选项,并在新闻发布后恢复它们。 在新闻发布前移除止损和止盈水平的选项,并在新闻发布后恢复它们。 在新闻发布前移动止损和
OrderManager MT5
Lukas Roth
4.83 (24)
介绍 OrderManager :MT5的革命性工具 使用全新的Order Manager实用程序,像专业人士一样管理您在MetaTrader 5上的交易。Order Manager设计简单,易于使用,可让您轻松定义和可视化每笔交易的风险,从而做出明智的决策并优化您的交易策略。有关OrderManager的更多信息,请参阅手册。 [ 手册 ] [ MT4版本 ] [ Telegram 频道 ]  New: [ Telegram To MT5 ] 主要功能: 风险管理:快速轻松地定义您交易的风险,让您做出更好的决策并提高交易性能。 视觉表示:图形化地查看您的交易和相关风险,以清晰简洁地了解您的开放头寸。 订单修改:只需几次点击即可轻松修改或关闭您的订单,简化您的交易过程,为您节省宝贵的时间。 掌握新闻:一键获取最新市场新闻。 不要错过这个MT5交易员的必备工具。用Order Manager提升您的交易体验,将您的交易游戏提升到新的水平。 OrderManager在startegyTester中 不 工作! OrderManager 仅与 Windows 兼容。 请考虑给这个产品一
Seconds Chart MT5
Boris Sedov
4.59 (17)
秒级图表 (Seconds Chart) — 一款专为 MetaTrader 5 设计的独特工具,用于创建秒级时间框架的图表。 通过 秒级图表 ,您可以构建以秒为单位的时间框架图表,获得标准分钟或小时图表无法提供的极致灵活性和分析精度。例如,时间框架 S15 表示每根蜡烛图持续15秒。您可以使用任何支持自定义交易品种的指标和EA交易系统。操作它们就像在标准图表上交易一样方便。 与标准工具不同, 秒级图表 让您能够在超短时间框架下进行高精度交易,无延迟干扰。 秒级图表的优势 支持 1至900秒 的时间框架图表。 基于内置的实时报价数据库, 即时加载 历史数据。 数据实时更新, 无延迟或滞后 。 可同时创建 多个秒级图表 。 秒级图表的理想应用场景 剥头皮交易 和高频交易。 精确的入场和出场时机。 在短时间框架下测试交易策略。 时间框架设置 默认设置包含以下时间框架: S1、S2、S3、S4、S5、S6、S10、S12、S15、S20、S30 。 您可轻松自定义时间框架组合,只需按升序列出 1至900秒 的数值且避免重复即可。 其他免费工具 快速交易管理器 ( Quick Trade Ma
Telegram to MT5 Coppy
Sergey Batudayev
5 (7)
Telegram 到 MT5: 终极信号复制解决方案 使用 Telegram 到 MT5 简化您的交易,这款现代化工具可直接从 Telegram 频道和聊天室复制交易信号到您的 MetaTrader 5 平台,无需 DLL 文件。这款强大的解决方案可确保精准的信号执行、丰富的自定义选项,节省时间并提高您的效率。 [ Instructions and DEMO ] 主要特点 直接 Telegram API 集成 通过电话号码和安全码进行身份验证。 通过用户友好的 EXE 桥轻松管理聊天 ID。 添加、删除和刷新多个频道/聊天以同时复制信号。 使用高级过滤器进行信号解析 跳过包含异常词(例如“报告”、“结果”)的不需要的信号。 支持灵活的 SL 和 TP 格式:价格、点数或点数。 自动计算指定点而不是价格的信号的切入点。 订单定制和灵活性 使用多种模式配置订单大小:固定手数、动态手数(% 风险)或特定符号手数。 使用信号数据或自定义参数调整 SL/TP。 设置滑点限制、挂单到期时间和重试参数,以实现无缝执行。 综合符号管理 排除特定符号或映射到特定经纪人的符号。 自定义信号和经纪商符号之间
Crypto Charting
Rajesh Kumar Nait
5 (5)
Crypto Charting for MT5 – MetaTrader 5 加密货币图表集成工具 概述 Crypto Charting for MT5 通过 WebSocket 提供实时 OHLC 图表数据。支持多家交易所,并可在 MT5 中自动更新历史数据。 功能 实时 WebSocket 数据传输 自动历史数据同步 网络中断后的计划更新 兼容所有 MT5 时间周期 支持 OHLCV 数据格式 支持策略测试器 自动重新连接 支持的交易所 Binance, Bybit, OKX, KuCoin, MEXC, Gate.io, Bitget, XT.com 补充说明 如需获取 Tick 数据和深度数据,可查看名为 Crypto Ticks 的相关产品。 注意事项 不使用 DLL,适用于 VPS 环境。 Strategy Tester 不支持 WebRequest 功能。 如需试用版本,请通过 MQL5 私信联系作者。 Full Documentation & Setup Guide : Click Here
Grid Manual MT5
Alfiya Fazylova
4.9 (20)
Grid Manual是一个交易面板,用于处理订单网格。 该实用程序是通用的,具有灵活的设置和直观的界面。 它不仅可以在亏损方向上设置订单网格,还可以在盈利方向上设置订单网格。 交易者不需要创建和维护订单网格,实用程序会这样做。 打开一个订单就足够了,Grid manual会自动为它创建一个订单网格,并伴随它直到非常关闭。 完整说明和演示版 此處 。 该实用程序的主要特性和功能: 伴隨以任何方式打開的訂單,包括從移動終端打開的訂單。 適用於兩種類型的網格:“限制”和“停止”。 使用兩種方法計算網格間距:固定和動態(基於 ATR 指標)。 允許您更改未結訂單網格的設置。 顯示圖表上每個網格的盈虧平衡水平。 顯示每個網格的利潤率。 允許您一鍵關閉網格中的盈利訂單。 讓您一鍵關閉每個訂單網格。 允許您對訂單網格應用追踪止損功能。 允許您在訂單網格上應用將訂單網格的止損轉移到盈虧平衡水平的功能。 相對於訂單網格的盈虧平衡水平自動重新排列止盈(僅在限價網格模式下,距離取決於所選的計算類型:“保守”或“激進”)。 最多可管理 20 個訂單網格,每個網格最多可包含 100 個訂單。 計算初始手數時,
ManHedger MT5
Peter Mueller
4.8 (5)
THIS EA IS A SEMI-AUTO EA, IT NEEDS USER INPUT. Manual & Test Version Please DON'T BUY this product before TESTING  and watching my video about it. The price of the ManHedger will increase to 250$ after 20 copies sold. Contact me for user support or bug reports or if you want the MT4 version! MT4 Version  I do not guarantee any profits or financial success using this EA. With this Expert Advisor, you can: Implement your own Zone Recovery strategy to capitalize on trending markets. Create Grid
YuClusters
Yury Kulikov
4.93 (43)
Attention: You can view the program operation in the free version  YuClusters DEMO .  YuClusters is a professional market analysis system. The trader has unique opportunities to analyze the flow of orders, trade volumes, price movements using various charts, profiles, indicators, and graphical objects. YuClusters operates on data based on Time&Sales or ticks information, depending on what is available in the quotes of a financial instrument. YuClusters allows you to build graphs by combining da
EasyInsight AIO MT5
Alain Verleyen
4.91 (11)
EASY Insight AIO – 全能智能交易一站式解决方案 概述 想象一下,您可以在几秒钟内扫描整个市场——外汇、黄金、加密货币、指数,甚至股票——无需手动筛选图表、繁琐安装或配置指标。 EASY Insight AIO 是您专为 AI 交易打造的即装即用数据导出工具。它将整个市场快照一次性输出为简洁的 CSV 文件,直接支持 ChatGPT、Claude、Gemini、Perplexity 等各类 AI 平台的即时分析。 无需窗口切换,无需图表叠加,也没有任何杂乱。只需纯净、结构化的数据自动导出,让您专注于基于数据的高效决策,无需再盯盘耗时。 为什么选择 EASY Insight AIO? 真正的一体化 • 无需设置,无需安装指标,无图表叠加。只需安装、运行并导出——就是这么简单。 多资产全覆盖 • 扫描分析外汇、金属、加密货币、指数、股票——您的券商所能提供的一切市场。 AI 专属数据导出 • 高度结构化、针对 AI 优化的 CSV 文件,直接适配主流智能工具和平台。 完整导出内容: • 三个可选周期的货币强度分析 • 净多头头寸变化体现市场情绪 • 成交量变化、
HINN Lazy Trader
ALGOFLOW OÜ
5 (2)
Lazy Trader is your personal risk management assistant that independently finds the best market entries, manages positions, and helps you extract maximum profit from every trading idea! It monitors charts from M1 to W1 , finds optimal entry points based on your parameters, and manages trades without your involvement: - Got an idea on the daily chart? No need to wait for lower timeframes to form a signal — Lazy Trader will check everything and open all necessary positions while you live your lif
交易面板一键交易。 处理仓位和订单! 通过 图表 或 键盘 进行交易 。 使用我们的交易面板,您只需单击一下即可直接从图表中执行交易,执行交易操作的速度比使用标准 MetaTrader 控件快 30 倍。 参数和函数的自动计算使交易者的交易更加快捷、方便。 图形提示、信息标签和有关贸易交易的完整信息均位于图表 MetaTrader 上。 MT4版本 详细描述   +DEMO +PDF 如何购买 如何安装     如何获取日志文件     如何测试和优化     Expforex 的所有产品 打开和关闭、反转和锁定、部分关闭/Autolot。虚拟/真实止损/止盈/追踪止损/盈亏平衡,订单网格... МetaТrader 5 中主要订单的交易控制面板 :买入、卖出、buystop、buylimit、sellstop、selllimit、平仓、删除、修改、追踪止损、止损、获利。 有 5 个选项卡 可用:头寸、挂单、账户信息、信号和总利润。 Description on English VirtualTradePad在“  MQL5语言最佳图形面板  ”竞赛中 获得二等奖 。 注意!如果
Cerberus Equity Watcher
Samuel Bandi Roccatello
5 (3)
Cerberus the Equity Watcher 是一种风险管理工具,可以持续监控您的账户资产并避免因错误的 EA 或您的情绪行为(如果您是全权交易者)导致的重大亏损。对于依赖 EA 的系统交易者来说,它非常有用,EA 可能包含错误,或者在意外的市场条件下可能表现不佳。 Cerberus 允许您设置最小净值和(可选)最大值,如果达到其中任何一个,则所有头寸都被平仓,所有挂单被关闭,所有 EA 被“杀死”。在展平所有位置后,将向用户手机发送通知,并在屏幕上显示一条清晰的消息。在“扁平化”之后, Cerberus 继续关注股权价值,并继续扼杀任何进一步的交易尝试,直到它被重新初始化。 Cerberus 执行的任何操作都清楚地显示在屏幕上,报告在“专家顾问”选项卡上,并向用户发送通知。为了避免用户错误,对用户输入的输入值和自动交易的当前状态进行了多次检查。 ****** 特征 最小和最大权益值可以以账户货币或初始权益的百分比设置 最大净值是可选的 如果达到最小/最大净值,则所有 EA 将独立于它们交易的符号被终止 第一次压扁后几秒钟进行双重检查 Cerberus 在拉平后也继续监控股权
作者的更多信息
Trade Painel OfflineCharts
Marcelo Akio Iqueuti
3 (2)
这是一个看起来很普通的面板,但是,除了用于关闭多个订单的其他按钮之外,它对于使用Renko,Range,Ticks等类似的离线图表生成器的用户来说至关重要,因为在Metatrader 5中您无法手动处理订单 在非平台本身的图形上。 “TRADE PANEL”执行订单和下达挂单,提供与平台图表常规时间段相同的即时操作资源。 可用资源 [ 1 ]    等同于Metatrader 5的常规迷你面板,具有报价(询问/出价),批次配置和订单执行; [ 2 ]   多个订单关闭按钮:          - CLOSE EXECUTED SELLS          - CLOSE PENDING SELLS          - CLOSE EXECUTED BUYS          - CLOSE PENDING BUYS [ 3 ]    快速菜单,用于放置在图表上用鼠标左键单击“ 2次单击”激活的挂单:          - BUY LIMIT / BUY STOP          - SELL LIMIT / SELL STOP          - ALERT: 在图
FREE
筛选:
xinxin888
16
xinxin888 2025.11.22 20:02 
 

用户没有留下任何评级信息

Mehdi Zamani
20
Mehdi Zamani 2025.06.30 08:29 
 

Hi, this is really good. Thanks.

Gabor Ludovic Schiefer
255
Gabor Ludovic Schiefer 2025.06.25 14:47 
 

works just fine, awesome algo overall

Ahmad Saleh
18
Ahmad Saleh 2025.06.24 18:01 
 

The expert advisor isn't working for me. This is the message that appears when I run it: "2025.06.24 20:54:09.829 Experts initializing of Candle by Seconds (US30_SPOT,M1) failed with code 1." It seems that it doesn't support all symbols on MetaTrader. Note that I tested it on another platform. Their symbol drawing format is different, and it worked fine.

Serraphiine
108
Serraphiine 2025.06.20 07:43 
 

用户没有留下任何评级信息

Wilson Lucena
18
Wilson Lucena 2025.06.12 17:24 
 

用户没有留下任何评级信息

Lydia Kwarteng
2053
Lydia Kwarteng 2025.06.12 13:23 
 

用户没有留下任何评级信息

Benjamin Afedzie
3539
Benjamin Afedzie 2025.06.12 00:10 
 

great work

Show1016
16
Show1016 2025.06.10 04:51 
 

ある程度のネット回線があれば、とても良い感じで使える。

Hammad Khan
18
Hammad Khan 2025.04.29 11:36 
 

it works fine, but we can't use for algo trading, as meta trader 5 *EXNESS* does not provide lower timeframes lower than M1, if we need to use even simple strategy like moving average, in MQL5 we can use only M1 lower timeframe. We can't use apply moving average to this EA.

[删除] 2025.03.30 10:36 
 

用户没有留下任何评级信息

Krysopée Alternative
58
Krysopée Alternative 2025.03.25 18:51 
 

Très pratique pour soigner son timing, dommage effectivement que les ordres apparaissent pas sur le graphique, merci

EAsports
14
EAsports 2025.03.05 09:58 
 

Awsome!

DaxMan
50
DaxMan 2025.03.03 20:33 
 

用户没有留下任何评级信息

PersonalXZ
27
PersonalXZ 2025.02.22 23:40 
 

- I use "Candle by Seconds" on an empty chart just so that it can fill the bar history and this chart is minimized. - On the second chart where I don't use "Candle by Seconds", I simply open a EURUSD_0_30s through the menu File/New Chart/Custom/Timecharts/EURUSD_0_30s and it works normally. You can even add indicators to it. The only problem is that you can't manage orders on this seconds chart (buy, sell, pending orders, Stop and Take; you can't manipulate them because the asset is another one). - To manipulate the orders on the chart, I made a DLL that connects the seconds chart with the M1 chart of the main asset. I draw the bars on the M1 with DRAW_CANDLES, the indicators with iMA, iCustom, which allows you to select the seconds asset EURUSD_0_30s. Now I can view the seconds chart and its indicators on the M1 of the main asset and I can also manage the orders. The DLL was made by AI Gemini, who does it for me; I just guided them in creating it. - Thanks!

Zavian Zee
18
Zavian Zee 2025.02.21 05:31 
 

用户没有留下任何评级信息

Wohlfull
14
Wohlfull 2025.01.08 16:58 
 

downloading failed

Sparsh77
14
Sparsh77 2024.12.20 14:31 
 

Cant see trade lines on the seconds chart

BRAZIL2020
76
BRAZIL2020 2024.12.06 18:39 
 

LOAD HISTORY, NOT STOP

Muneeb Baqir
58
Muneeb Baqir 2024.11.21 12:15 
 

very best EA

123
回复评论