Chart Control MT4
- 指标
- 版本: 1.0

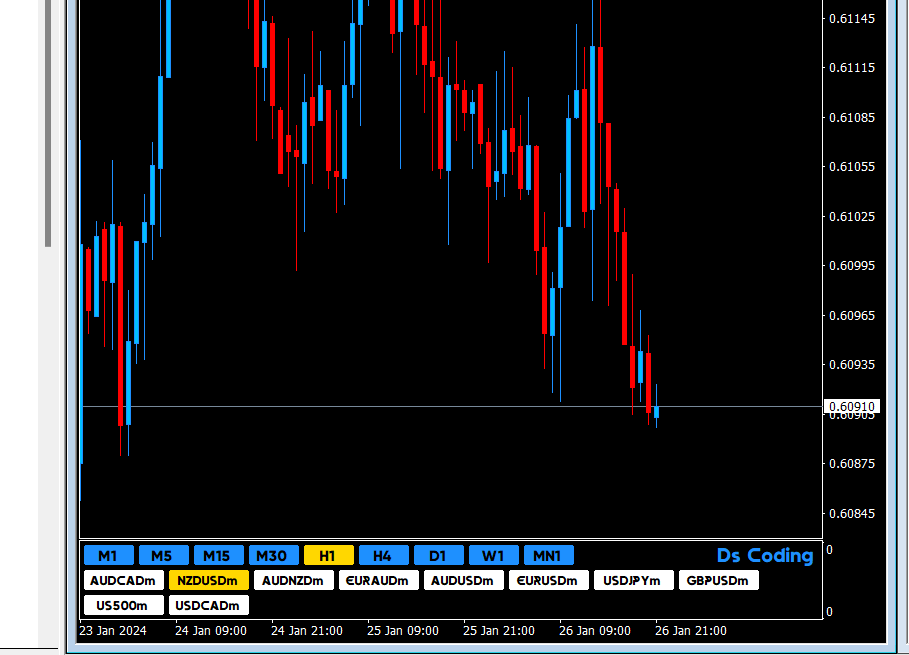
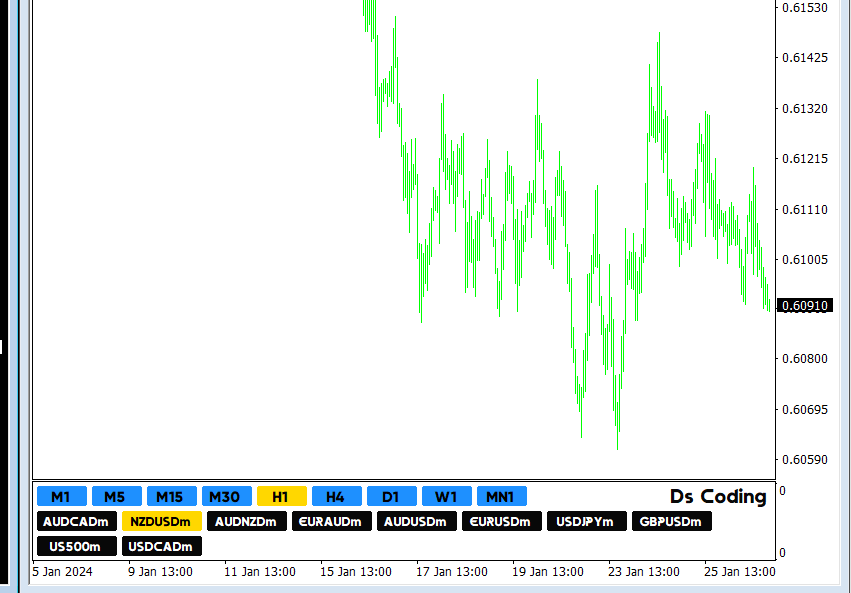
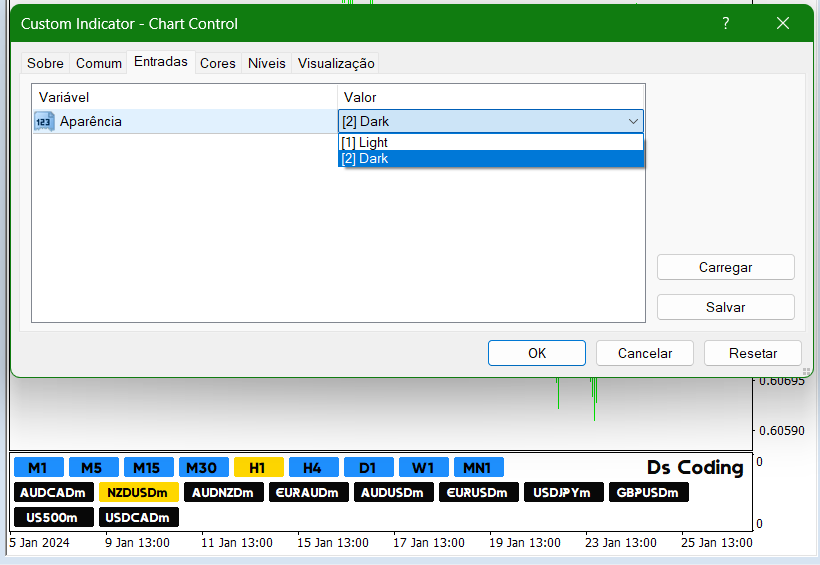
O Chart Control é um indicador que permite de forma rapida e pratica alterar o timeframe e ativo do grafico, possibilitando que voce possa fazer todas as suas analises em apenas um grafico sem precisar abrir vários, além disso voce pode escolher o entre os temas claro e escuro para o qual melhor se adapta a sua preferencia.
MT5: https://www.mql5.com/pt/market/product/109444
MT5: https://www.mql5.com/pt/market/product/109444

Ótimo indicador, ferramenta de qualidade, o proprietário esta de parabéns.