DashBoard Multi TimeFrame

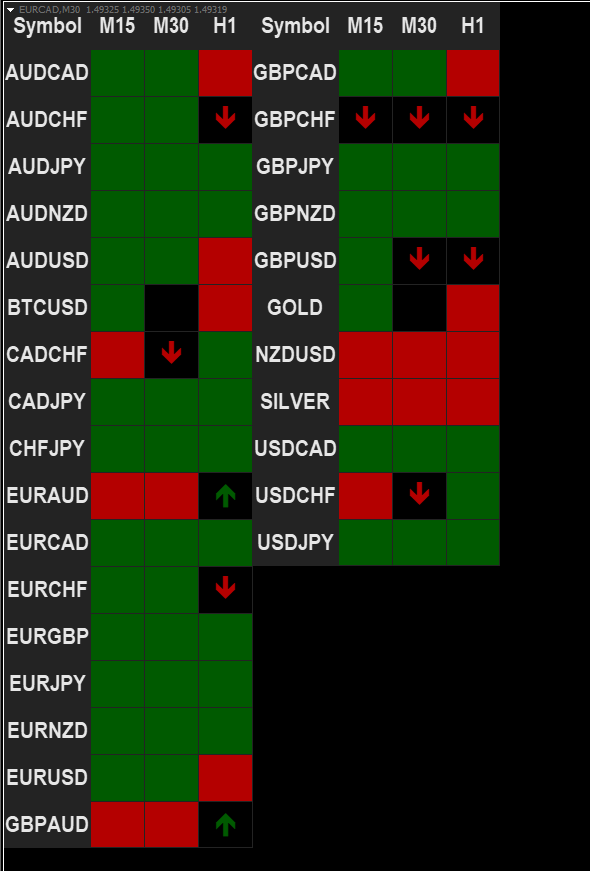
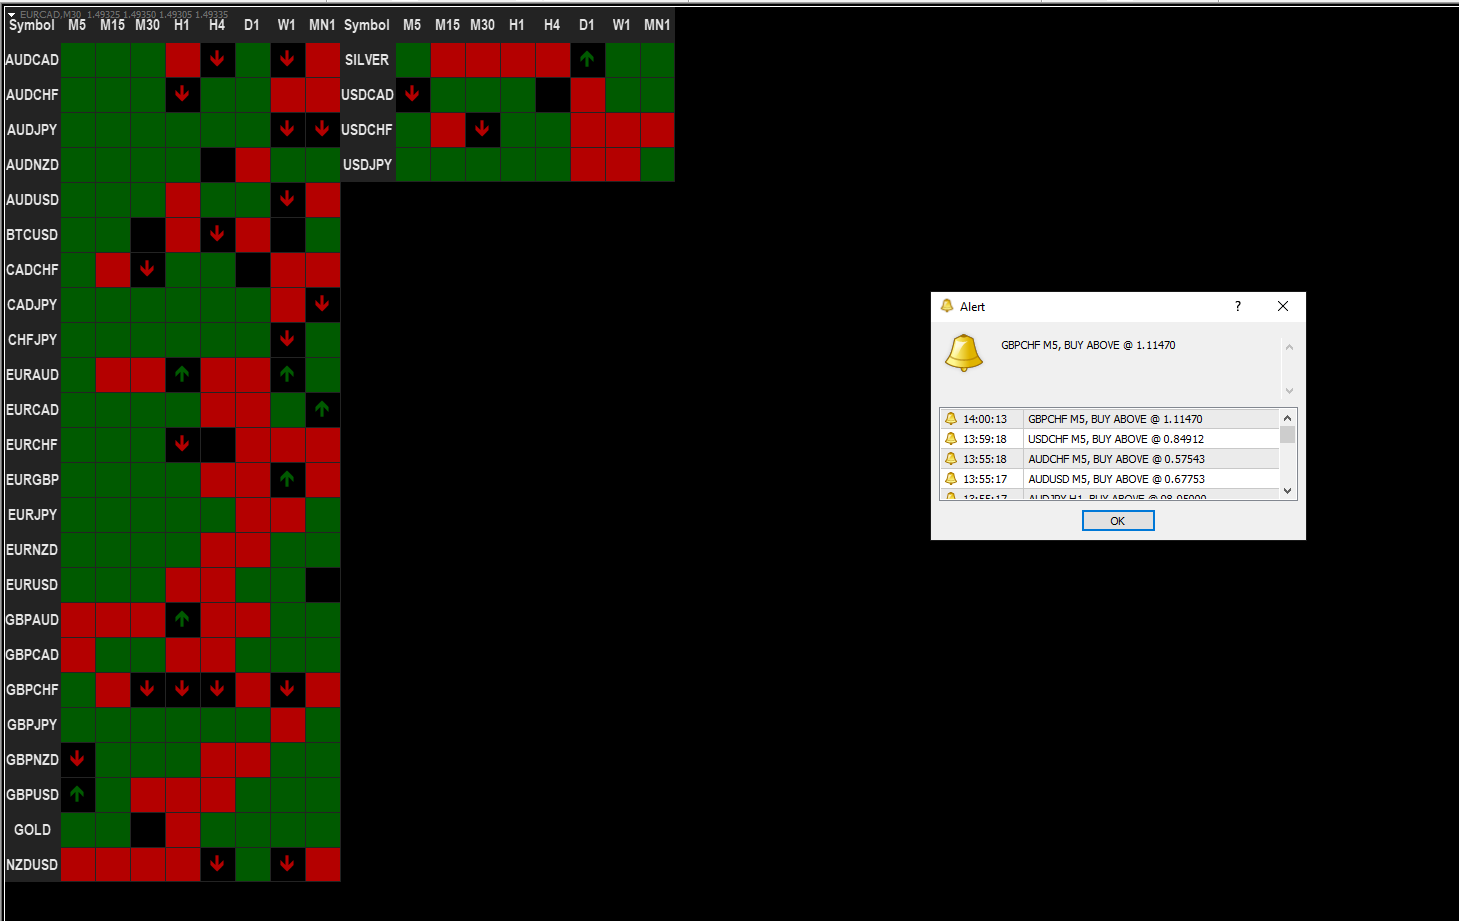
This indicator (dashboard) provides trend for multi currency on multi timeframe Charts.

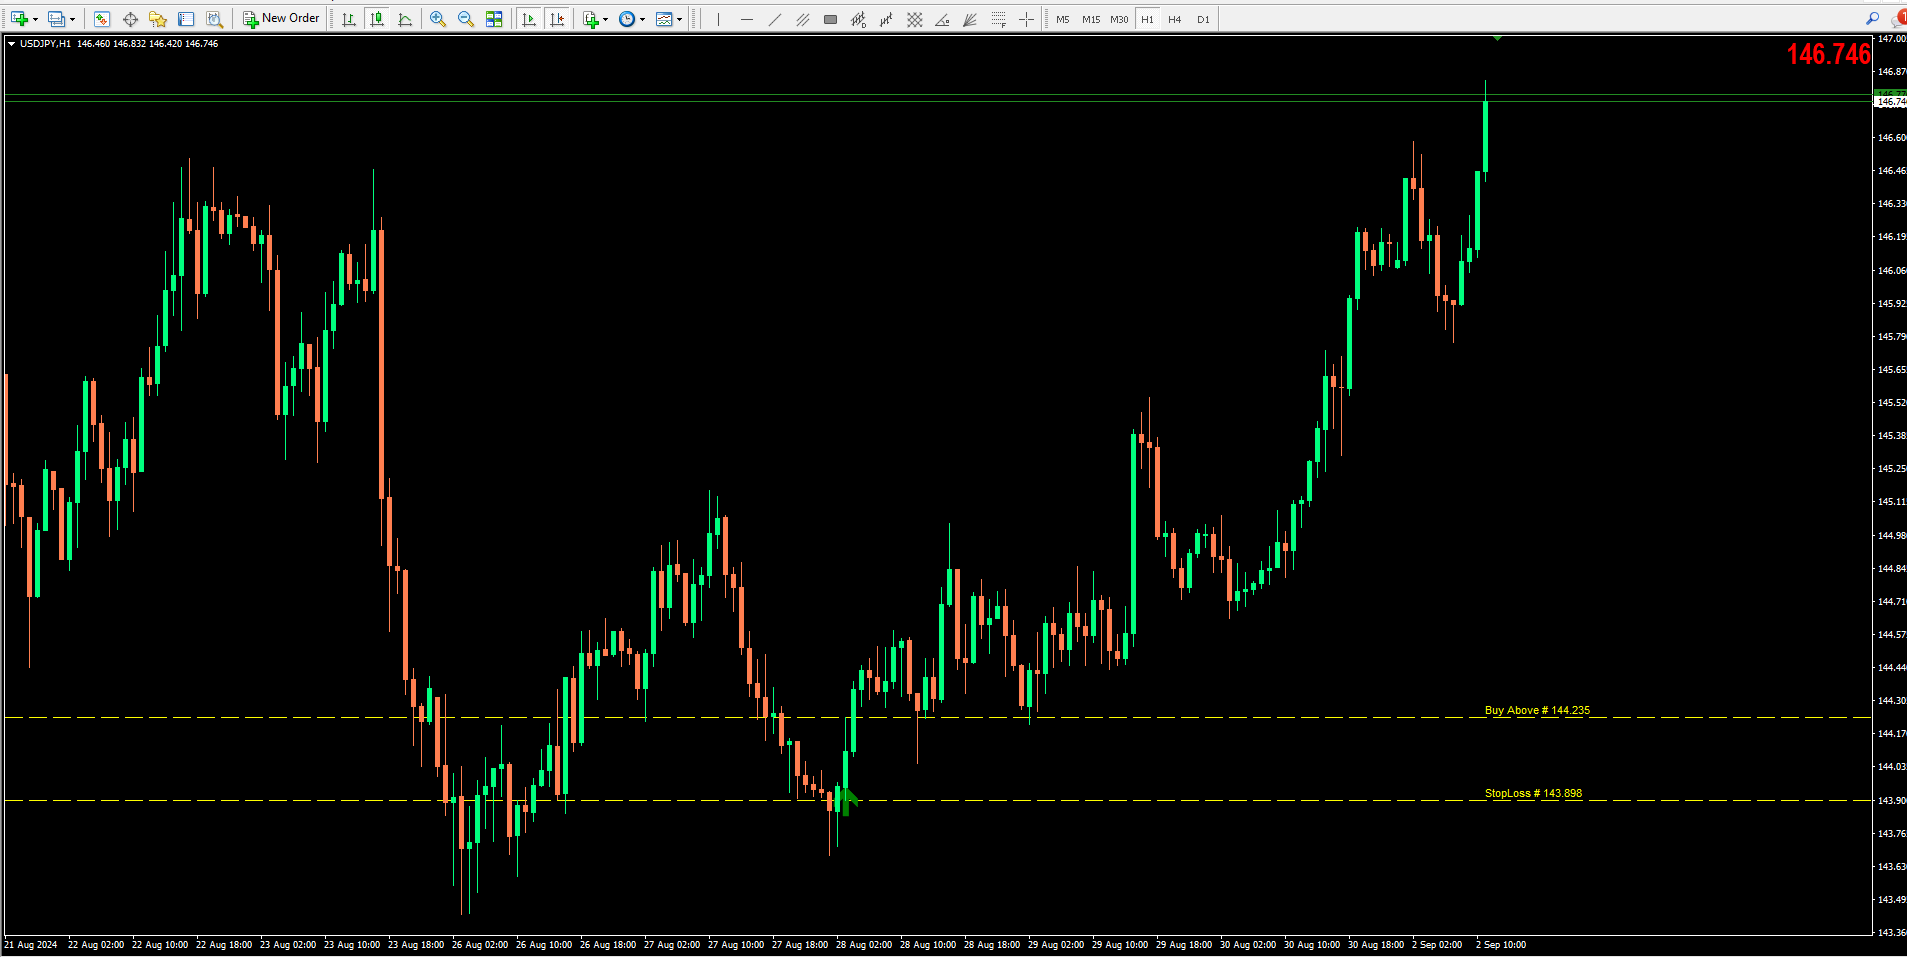
It gives entries and Stoploss on the chart itself 

if the currency pair is uptrend then the cell color is displayed as Green and if its downtrend the cell displays the color as Red.If the cell colour  displayed on particular currency is green it represents strong uptrend and vice versa if the cell colour is Red.If the cell has just an arrow it means the currency is ready for the trend.If the cell has neither colour or nor arrow it represents there is no trend on that time frame .

Alerts are generated whenever the trend changes on that particular timeframe.

can customize the time frames as desired

Will provide the best settings and send you the document on how to use this dashboard once the product has been rented or purchased.

This product supports all time frames and can accommodate upto 100 symbols.

Works on any currency or stock or commodity...
推荐产品
DMS Fibo
Diogo Mitsunaga Dos Santos
Fibonacci retracements are trend lines drawn between two significant points, usually between absolute lows and absolute highs, plotted on a chart. Intersecting horizontal lines are placed at the Fibonacci levels. Fibonacci retracements are useful tools that help traders identify support and resistance levels. With the information gathered, they can place orders, identify stop-loss levels, and set price targets. Although useful, traders often use other indicators to make more accurate assessments
About
Tatiana Savkevych
About - Forex indicator. This trend indicator is used to determine the current trend in price movement, making it clear in which direction it is better to open a position: buy or sell. The About trend indicator is displayed on the chart and moves in parallel with the price. The Forex About trend indicator allows you to determine in time a change in the direction of price movement, thereby minimizing the likelihood of capital loss. In trading practice, various combinations of About and other ind
介绍二元智能系统:您的终极交易伴侣 二元智能系统不仅仅是一个指标,它是一个精心设计的复杂交易工具,为交易者提供精确的交易信号和市场洞察。该系统建立在先进的算法和广泛的技术指标基础上,是您解锁交易成功的关键。 指标组件: 移动平均百分比(MAP):   该组件计算多个移动平均线的加权平均值,为趋势识别提供强大的基础。MAP会根据市场条件动态调整,提供有关当前趋势方向的见解。 商品通道指标(CCI):   CCI通过分析价格偏离平均值来衡量超买和超卖情况。二元智能系统的CCI集成确保了从整体上识别潜在的反转点。 移动平均线收敛/发散(MACD):   系统中的MACD组件超越了简单的价格交叉。它评估MACD线和信号线的收敛和发散,揭示隐藏的交易机会并确认趋势强度。 平均方向指数(ADX):   使用ADX,二元智能系统量化趋势动量。它可以准确地识别强劲的趋势并帮助您避免弱势、不确定的市场阶段,从而增强您的交易决策。 多空力量:   通过这些指标,可以利用多空情绪的综合力量。这对市场情绪的全面了解有助于进行明智的交易入场。 随机指标:   二元智能系统中的随机指标有助于识别超买和超卖情况,并
SilentLevels
Barakah Muslih B Alharbi
One of the key elements in trading is identifying zones or levels that allow traders to make buy or sell decisions during trading. أحد العناصر الأساسية في التداول هو تحديد المناطق أو المستويات التي تسمح للمتداولين باتخاذ قرارات الشراء أو البيع أثناء التداول. The indicator displays Fibonacci levels يعرض المؤشر مستويات فيبوناتشي  drawing levels based on historical daily or weekly data. مستويات الرسم بناءً على البيانات التاريخية اليومية أو الأسبوعية. Daily levels update with each new day’s opening
Market Session PRO MT4 – Smart Session Visualization Boxes Market Session PRO MT4 is a powerful and lightweight indicator designed to help traders clearly visualize the major forex trading sessions directly on your charts. This tool automatically highlights the Tokyo, London, and New York sessions, allowing you to better understand market behavior, volatility, and key trading opportunities. Key Features: Automatic Session Detection Accurately plots Tokyo, London, and New York sessions using au
This indicator draws Fibonacci level automatically from higher high to lower low or from lower low to higher high. With adjustable Fibonacci range and has an alert function. How to use Fibonacci Risk Reward Ration (R3) into trading strategy Forex traders use Fibonacci-R3 to pinpoint where to place orders for market entry, for taking profits and for stop-loss orders. Fibonacci levels are commonly used in forex trading to identify and trade off of support and resistance levels. Fibonacci retracem
TPO Profile MT4
Kyra Nickaline Watson-gordon
5 (1)
Definition : TPO is a Time Price Opportunity. Instead of using bars or candles with an Open, High, Low, and Close price, each "bar" in a Market Profile is represented by horizontal bars against the price It is called Market Profile terminology. In other words time-price-opportunity (TPO) profiles are histograms of how much time was spent at each price within the span of the profile. By using a TPO chart, you are able to analyze the amount of trading activity, based on time, for each price level
SindiX Margin Index
Ahmad Amiruldin A Sindi
this indicator will help you see the following : first , price levels that shows : 1. breakeven level for all open positions ( BEA shown in blue line ) 2. breakeven level for all open buy positions ( BEB shown in green line ) 3. breakeven level for all open sell positions ( BES shown in red line ) 4. draw a line at Margin level 100% ( violet color line ) 5. draw a line at Margin call level ( violet color line ) 6. draw a line at StopOut ( violet color line ) second , to the left : 1. it will s
Power Flow Binary
Ganesh Tanaji Lohar
POWER FLOW PRO — Binary Options Edition For the first time ever, the POWER FLOW PRO cumulative dominance logic is specially optimized for Binary Options trading. POWER FLOW PRO is a smart real-time pressure-flow indicator designed to detect aggressive market momentum and short-term directional dominance for fast Binary Options entries. The system analyzes: Real-time buying pressure Real-time selling pressure Momentum candle strength Cumulative dominance flow Continuation pressure to generate hig
M5 时间框架的机器人黄牛。交易 GBPUSD 货币对。该机器人是由一家专业交易商公司专门开发的,用于英镑交易。机器人每天大约打开 5 到 15 笔交易。最好与英镑兑美元点差低至 10 点的经纪商进行交易。建议的最低存款为 500 美元或更多。 优点: 不使用鞅。 不是网。 每笔交易都有止损。 专门针对 GBPUSD 对的专业机器人。 机器人黄牛,在 M5 时段进行盘中交易。 这个机器人如何交易? 为了分析市场,机器人使用两个指标的价格模型和战略市场模式:抛物线止损和反转系统以及布林带。机器人首先使用价格内插统计分析市场的价格变动。接下来,机器人读取这些指标并比较它们现在和过去的运动趋势。如果存在表明市场反转或回滚的模式巧合,那么机器人将进行交易。机器人将根据余额大小按比例计算每笔交易的手数。交易者可以使用“Percentage_of_lots”参数调整该比例。机器人开始交易后,它开始通过修改追踪止损来伴随它。此外,每笔交易都有自己的止损,设置为限制可能的损失。 机器人规格: 时间范围(期间) M5 货币对 GBPUSD 存款 500 美元起 建议点差高达 10 点。 建议:
Trend Analysis in act
Ihab Mohamed Kamal Fouda
The Trend Analysis Indicator is an innovative tool designed for traders and investors who seek to navigate the complexities of the financial markets with greater precision and insight. This powerful indicator is engineered to adeptly identify whether a market is trending or not, offering users a vital edge in their trading strategy. Key Features: Accurate Trend Detection : The core functionality of the Trend Analysis Indicator lies in its ability to accurately detect market trends. It analyzes p
FxBears Super
Rachid Lafhil
欢迎来到使用 FxBears 超级交易指标的高级交易世界。 这一创新工具专为 MT4 平台设计,结合了艾略特波浪、供需区域和内部指标的强大功能,为交易者提供高质量的信号,以做出明智的交易决策。 FxBears Super 拥有超过 90% 的成功率记录,为您的交易策略带来了新的精确度和盈利水平。 科西嘉岛没有重画,也没有重画。 艾略特波浪分析:      FxBears Super 利用艾略特波浪的预测潜力,识别市场周期和趋势。 通过分析特征五浪脉冲和三浪调整形态,准确提取潜在的转折点和延续形态。 供需区:      认识到供需区域的重要性,FxBears Super 在图表上精确指出了关键支撑位和阻力位。 这些市场情绪发生变化的区域为潜在的价格逆转和突破提供了宝贵的见解。 内部指标:         FxBears Super 集成了一套内部指标,进一步提高其准确性:    **RSI(相对强弱指数):衡量超买和超卖状况,有助于发现潜在的趋势逆转。    **移动平均线:识别短期和长期趋势,而交叉线则提供潜在进入和退出点的信号。    **MACD(移动平均收敛分歧)
Nice Try Super Diddy Trend – 一款创新的技术分析工具,专为寻求深入理解市场动态的经验丰富交易者而设计。该指标利用复杂的算法计算流动性流动和市场动量,识别潜在的反转点和趋势延续。 独特性与价值 Nice Try Super Diddy Trend 不仅仅是一个信号生成器,它还分析市场的隐藏结构,研究价格波动的幅度和方向,并结合时间周期进行评估。 量子波动性分析 – 确定市场波动强度,帮助过滤虚假突破。 灵活适应市场变化 – 采用基于移动平均线和 RSI 指标计算的动态阈值水平。 适用于多种交易策略 – 既可用于趋势交易,也可用于寻找局部极值点。 如何运作? Nice Try Super Diddy Trend 通过智能算法分析历史数据和当前价格动态,评估市场动量。该指标使用上升和下降标记系统,清晰地可视化市场阶段及潜在入场点。 黄色和红色线条 – 指示潜在上涨或下跌的信号水平。 箭头 – 基于市场动量分析形成的方向标记。 阈值水平 – 动态调整以适应市场结构变化。 指标参数设置 Nice Try Super Diddy Trend 提供高级参
AI Forecast MT4
Leonardo Antonio Camacaro Armas
The "AI Forecast" indicator is the result of a unique experiment in which I asked an AI how to create the best indicator to anticipate the market. The AI suggested measuring the past history of the price and its reactions to different levels, and then calculating the probabilities of the price reaction in the future. With this idea, I designed with the help of another AI the "AI Forecast" indicator, which adapts to any MetaTrader chart and shows you three lines: one for entry and two for possi
Indicador FimatheChannels
Diego De Freitas Justo
https://youtu.be/Cz76GayNqtM  Com esse indicador você não precisa ficar fazendo marcações manuais para encontrar seus canais e níveis de negociação. O channels faz isso por você. Veja o vídeo :  Com os canais definidos o trade pode operar seus rompimentos  Analisando seu canal de referencia e zona neutra com base na tendencia e nos rompimentos. Tem uma calibragem nas opções onde você consegue estreitar ou alargar mais o canal. Pode definir as cores automáticas das linhas, seus estilos e tamanhos
Best Divergence App
Sandeep Bhardwaj
Best Divergence Indicator for advanced traders without distraction of lines or arrows. It is not a magic blackbox for novice traders rather a great tool for experienced traders to decide their entry and exit. Can be used for most of the Forex pairs, Gold, Oil, Crypto. Flexibility to play with input to customize ur unique research too.  Therefore, I will suggest turning off arrows and divergence line to reduce clutter and instead use the following advice: For sell on divergence indicator start tu
Account Info Indicator
Hafis Mohamed Yacine
account_info_horizontal is a mt4 (MetaTrader 4) indicator and it can be used with any forex trading systems / strategies for additional confirmation of trading entries or exits. Indicators add account information to chart. Profit, Balance, Equity, Free Margin, Margin and Margin Level %.   AccountInfo indicator can reveal all advanced features of MetaTrader 4 (above build 600). This indicator can clearly symbolize the main data of the current account (balance, equity, free margin, current Profi
This indicator was tested on the basis of real statistics for all market indicators according to indicators for 3 months of trading. trade forecasts for usd / jpy on the m30 time frame were received on our statistics! if you have any questions, please contact us in private messages or in discussions under this indicator and we will figure it out and help any questions will arise personal messages or in discussions under this indicator As soon as the blue points appear, we open a deal to increa
Chart Control MT4
Danrlei Hornke
5 (1)
O Chart Control é um indicador que permite de forma rapida e pratica alterar o timeframe e ativo do grafico, possibilitando que voce possa fazer todas as suas analises em apenas um grafico sem precisar abrir vários, além disso voce pode escolher o entre os temas claro e escuro para o qual melhor se adapta a sua preferencia. MT5:  https://www.mql5.com/pt/market/product/109444
FREE
Unique Professional 8 Snipe r is a  multi-timeframe indicator   that combines 8 different technical conditions to generate high probability BUY/SELL signal set ups and gives high probability precise entries. It's a non-repaint   indicator with 8 confirmations and then a precise entry when all conditions are met. Alerts and Push Notifications with Entry ,Tp and Sl MT 4 and MT5 Direct EA is free along with the purchase of indicator  Limited offer for few users only till 30th of September Best Fo
Multi-Confluence Reversal Alert | RSI + Heikin Ashi + Divergence + Key Levels | SL/TP Lines | No Repaint Overview Confluence Reversal Alert is a professional-grade reversal detection indicator for MetaTrader 4. It combines five powerful trading concepts into a single, clean alert system — giving you high-probability reversal signals with automatically drawn Entry, Stop Loss, and Take Profit levels directly on your chart. Designed for traders who use VSA (Volume Spread Analysis) , price action ,
Diamond Trend
Segundo Calvo Munoz
Indicator which identifies Trend and also buy/sell opportunities. Use for entries aligned to the Trend.  Although Diamond Trend is very accurate identifying entry points, it is always recommended to use a support indicator in order to reconfirm the operation. Remind to look for those Assets and Timeframes which best fit to your trader behavior/need... Valid for Scalping and Long Term operations. Please, set up a Bars Chart to be able to visualize the indicator properly...  ...And remind to give

DFX InteliTrade Shark PRO
Ibrahim Dabai Molloud Hassane
DFX InteliTrade  Shark PRO v6 Special Edition User Manual &  Comprehensive Guide 1. Indicator Overview Product Name: DFX InteliTrade Shark PRO v6 Developer: Dr. Hassane Dabai (Finance Engineer) ,dr.dabai@gmail.com |+(966)59-730-4266 Latest Version: v6 (September 2025) Platform: MetaTrader 4 (MT4) 2. Brief History & Philosophy The DFX InteliTrade Shark PRO is the culmination of 16 years of research and development (since 2009). It evolved from a basic trend-following system into a sophistica
Market Projection Pro — MT4 想在图表上观察所选价格周期可能如何延伸?Market Projection Pro 分析您选择的历史区间,提取周期成分,并在分析窗口右侧绘制合成投射。您可以控制历史区间和向前延伸的长度,将计算情景与价格结构及潜在转折区域进行对比。 图表上显示什么 可交互边界允许您直接在图表上选择历史分析区间。 周期成分和合成曲线帮助观察所选走势的节奏。 投射按照指定的未来蜡烛数量延伸计算情景。 可选转折点和转折区域便于检查投射结构。 图表上的计算、构建与清除按钮让操作集中在同一界面。 使用方法 选择两条边界之间的区间,点击 Calculate Cycles,再点击 Build Projection。分析长度是用于计算的历史蜡烛数量;投射范围是向前绘制的蜡烛数量,两者分别设置。修改区间后,请重新计算周期并重建投射。需要比较情景时,选择另一段历史并重复计算;需要观察转折时,开启转折点或区域。 购买前试用 下载演示版,在 MT4 中启动可视化测试,以使用图表按钮和边界。选择历史数据充足的区间,计算周期并构建投射。建议从默认的 70 根蜡烛投射范围开始。
TrendMaestro
Stefano Frisetti
4 (4)
Attention: beware of SCAMS, TRENDMAESTRO is only ditributed throught MQL5.com market place. note: this indicator is for METATRADER4, if you want the version for METATRADER5 this is the link:  https://www.mql5.com/it/market/product/108106 TRENDMAESTRO ver 2.5 TRENDMAESTRO recognizes a new TREND from the start, he never makes mistakes. The certainty of identifying a new TREND is priceless. DESCRIPTION TRENDMAESTRO identifies a new TREND in the bud, this indicator examines the volatility, volumes a
Draw by Hand Tool
John Louis Fernando Diamante
This tool provides a freehand drawing method, to treat the chart space as a blackboard and draw by-hand. Drawings can be made to stick to the CHART (moves with chart scroll), or to stick to the WINDOW (does not move with chart scroll). Features: all drawings are individually styled, color, width show/hide each drawing type delete last drawing drawings, on chart and on window, remain through TF changes and terminal re-starts, until the indicator is removed Panel: stylable colors scalable in size
Outside The Box MT4
Innovicient Limited
5 (2)
The   Outside The Box (OTB)   is a complete trading system that provides the user with immense trading ability by highlighting on the chart areas where the trader should prepare to Re-enter the trend after pullbacks (Pullback trading strategy) Take partial/complete profit(Profit taking strategy), and Trade breakouts (Stock breakout strategy) - We have updated the indicator to show/hide Micro breakout areas around the major breakouts (Micro Breakouts).  The above is supported by an alert system
Touch VWAP MT4
Danrlei Hornke
O Touch VWAP é um indicador que permite calcular uma Média Ponderada por Volume (VWAP) apenas apertando a tecla 'w' no seu teclado e após clicando no candle do qual deseja realizar o calculo, clicando abaixo do candle é calculada a VWAP baseado na minima dos preços com o volume, clicando sobre o corpo do candle é calculado uma VWAP sobre o preço medio com o volume e clicando acima do candle é calculado uma VWAP baseado na máxima dos preços com o volume, voce tambem tem a opção de remover a VWAP
Unique Trend
Andriy Sydoruk
The Unique Trend indicator tracks market trends, ignoring sharp fluctuations and market noise. The indicator is suitable for trading on small timeframes because it ignores sudden price jumps or price corrections due to the reduction of market noise around the average price. The scan at minima and maxima forms the internal boundaries (channel) when calculating the indicator signals. The channel allows you to remove market noise. iMA and iATR are used to generate signals using the author's algor
Poison Slayer EurUsd
Ignacio Agustin Mene Franco
Poison Slayer EUR/USD General Information Name: Poison Slayer EUR/USD Platform: MetaTrader 4 (MT4) Recommended Broker: IC Markets Currency Pair: EUR/USD Timeframe: H1 (1 Hour) Minimum Capital: USD $1,000 Version: 1.00 Developer: WorldInversor System Description Poison Slayer EUR/USD is an automated Expert Advisor specifically designed for trading the EUR/USD pair on 1-hour charts. This system combines technical analysis based on exponential moving averages (EMAs) with a risk management strateg
该产品的买家也购买
Miraculous Indicator Binary & Forex v3 StrategySafe Miraculous Indicator Binary & Forex v3 StrategySafe 是一款专业交易指标,适合希望获得清晰信号、强大确认工具以及结构化交易方式的 Binary 和 Forex 交易者。 v3 版本加入了 MIR Dashboard、Miraculous Confirmation Dashboard、GANN Law、Square of 9 水平线、GANN 角度以及更强的 Forex 分析模式。 核心功能 同时支持 Binary 和 Forex 交易模式。 MIR Dashboard 可快速读取市场状态。 Miraculous Confirmation Dashboard 用于确认交易机会。 GANN Law drawing lines 用于 Forex 市场结构分析。 Square of 9 线条、方向和关键价格水平。 1x1 GANN Angle 用于判断趋势压力。 Entry Information TP 帮助寻找合理止盈区域。 Strateg
ORB Seeker
Marcela Goncalves De Oliveira
4 (1)
特价促销,限量供应,保持产品稀缺性! 仅售 599 美元! 购买后请联系我以获取奖励的 ORB Seeker EA 和个人优化设置文件。 自信地捕捉干净利落的比赛片段! ORB Seeker 是一款专业的开盘区间突破 (ORB) 指标,专为追求准确性、简洁性、灵活性和清晰图表结构的交易者而设计。 它能自动绘制任何交易品种的盘前或自定义交易时段区间,然后给出清晰的突破信号,包括入场点、止损点、止盈点以及可选的50%部分止盈位。所有数据均实时计算并直接显示在图表上。 您可以选择交易伦敦开盘、纽约交易时段、亚洲交易时段,或者您自定义的交易时段。ORB Seeker 会根据您选择的交易时段自动调整,让您精准掌握市场波动范围、突破位和交易位的位置。 每次购买均免费赠送 ORB Seeker EA 智能交易系统。该 EA 系统读取指标的突破信号并可自动下单,您可以选择手动交易,也可以让 EA 系统根据指标的信号逻辑自动处理入场。   为什么选择 ORB Seeker 支持多个交易时段 - 您可以自行设置伦敦、纽约、亚洲或自定义交易时段的盘前交易时间和交易时段。 完整的突破视觉效果 - 交易最高
FFx Engulfing Setup Alerter gives trade suggestions with Entry, Target 1, Target 2 and StopLoss. Below are the different options available: Entry suggestion - pips to be added over the break for the entry 3 different options to calculate the SL - by pips, by ATR multiplier or at the pattern High/Low 3 different options to calculate the 2 TPs - by pips, by ATR multiplier or at Risk/Reward Offset the dashboard - any place on the chart Remove the suggestion once the price reached the SL line Lines
FFx InsideBar Setup Alerter gives trade suggestions with Entry, Target 1, Target 2 and StopLoss. Below are the different options available: Entry suggestion - pips to be added over the break for the entry Minimum candle size - to avoid too close buy/sell entry suggestions 3 different options to calculate the SL - by pips, by ATR multiplier or at the pattern High/Low 3 different options to calculate the 2 TPs - by pips, by ATR multiplier or at Risk/Reward Offset the dashboard - any place on the c
FFx OutsideBar Setup Alerter gives trade suggestions with Entry, Target 1, Target 2 and StopLoss. Below are the different options available: Entry suggestion - pips to be added over the break for the entry. 3 different options to calculate the SL - by pips, by ATR multiplier or at the pattern High/Low. 3 different options to calculate the 2 TPs - by pips, by ATR multiplier or at Risk/Reward. Offset the dashboard - any place on the chart. Remove the suggestion once the price reached the SL line.
FFx PinBar Setup Alerter gives trade suggestions with Entry, Target 1, Target 2 and StopLoss. Below are the different options available: Entry suggestion - pips to be added over the break for the entry Minimum candle size - to avoid too small candles 3 different options to calculate the SL - by pips, by ATR multiplier or at the pattern High/Low 3 different options to calculate the 2 TPs - by pips, by ATR multiplier or at Risk/Reward Offset the dashboard - any place on the chart Remove the sugges
Lineverse Trendlines
Arkady Segal
5 (1)
Automatic, live & interactive picture of all trendlines. Assign push, email and sound alerts to the lines of your choice and be informed about price rollback, breakout, rollback after breakout, number of rollbacks, line expiration by double breakout. Correct, drag or delete the lines and interactively tune the line system. https://youtu.be/EJUo9pYiHFA . Chart examples https: //www.mql5.com/en/users/efficientforex Price Interaction Events All events are effective immediately and only after one
FFx MACD Divergences
Eric Venturi-Bloxs
The purpose of this new version of the MT4 standard indicator provided in your platform is to display in a sub-window multiple timeframes of the same indicator with its divergences. See the example shown in the picture below. But the display isn't like a simple MTF indicator. This is the real display of the indicator on its timeframe. Here's the options available in the FFx divergences indicator: Select the timeframes to be displayed (M1 to Monthly) Define the width (number of bars) for each tim
FFx RSI Divergences
Eric Venturi-Bloxs
The purpose of this new version of the MT4 standard indicator provided in your platform is to display in a sub-window multiple timeframes of the same indicator with its divergences. See the example shown in the picture below. But the display isn't like a simple MTF indicator. This is the real display of the indicator on its timeframe. Here's the options available in the FFx divergences indicator: Select the timeframes to be displayed (M1 to Monthly) Define the width (number of bars) for each tim
FFx CCI Divergences
Eric Venturi-Bloxs
The purpose of this new version of the MT4 standard indicator provided in your platform is to display in a sub-window multiple timeframes of the same indicator with its divergences. See the example shown in the picture below. But the display isn't like a simple MTF indicator. This is the real display of the indicator on its timeframe. Here's the options available in the FFx divergences indicator: Select the timeframes to be displayed (M1 to Monthly). Define the width (number of bars) for each ti
The FFx Dashboard MTF alerter will show you on a single chart all the timeframes (M1 to Monthly) with their own status for the indicator. 2 Alert Options: Single timeframe: each selected timeframe alert separately when a signal occurs Multi timeframes: all selected timeframes must agree for an alert to be triggered Both options have an input to select the timeframes to be used for the alert(s). How to Understand the Status: Green/Red square: histogram above/below 0 line Green square + Red bord
The FFx Dashboard MTF alerter will show you on a single chart all the timeframes (M1 to Monthly) with their own status for the indicator. 2 Alert Options: Single timeframe: each selected timeframe alert separately when a signal occurs Multi timeframes: all selected timeframes must agree for an alert to be triggered Both options have an input to select the timeframes to be used for the alert(s). How to understand the status: Green/Red square: RSI above/below 50 line Green square + Red border: R
The FFx Dashboard MTF alerter will show you on a single chart all the timeframes (M1 to Monthly) with their own status for the indicator. 2 Alert Options: Single timeframe: each selected timeframe alert separately when a signal occurs Multi timeframes: all selected timeframes must agree for an alert to be triggered Both options have an input to select the timeframes to be used for the alert(s). How to understand the status: Green/Red square: Stoch above/below 50 line Green square + Red border:
The FFx Dashboard MTF alerter will show you on a single chart all the timeframes (M1 to Monthly) with their own status for the indicator. 2 Alert Options: Single timeframe: each selected timeframe alert separately when a signal occurs Multi timeframes: all selected timeframes must agree for an alert to be triggered Both options have an input to select the timeframes to be used for the alert(s). How to understand the status: Green/Red square: Price above/below Cloud (Kumo) Green square + Red bo
The FFx Dashboard MTF alerter will show you on a single chart all the timeframes (M1 to Monthly) with their own status for the indicator. 2 Alert Options: Single timeframe: each selected timeframe alert separately when a signal occurs Multi timeframes: all selected timeframes must agree for an alert to be triggered Both options have an input to select the timeframes to be used for the alert(s). How to understand the status: Green/Red square: MA pointing Up/Down Green square + Red border: MA po
The FFx Dashboard MTF alerter will show you on a single chart all the timeframes (M1 to Monthly) with their own status for the indicator. 2 Alert Options: Single timeframe: each selected timeframe alert separately when a signal occurs. Multi timeframes: all selected timeframes must agree for an alert to be triggered. Both options have an input to select the timeframes to be used for the alert(s). How to understand the status: Green square: Price above PSAR Red square: Price below PSAR Options
The FFx Dashboard MTF alerter will show you on a single chart all the timeframes (M1 to Monthly) with their own status for the indicator. 2 Alert Options: Single timeframe: each selected timeframe alert separately when a signal occurs Multi timeframes: all selected timeframes must agree for an alert to be triggered Both options have an input to select the timeframes to be used for the alert(s). How to understand the status: Green/Red square: CCI above/below levels (ie. 100/-100) Grey square: C
The FFx Dashboard MTF alerter will show you on a single chart all the timeframes (M1 to Monthly) with their own status for the indicator. 2 Alert Options: Single timeframe: each selected timeframe alert separately when a signal occurs Multi timeframes: all selected timeframes must agree for an alert to be triggered Both options have an input to select the timeframes to be used for the alert(s). How to understand the status: Green/Red square: ADX above level Grey square: ADX below level Red bor
The FFx Dashboard MTF alerter will show you on a single chart all the timeframes (M1 to Monthly) with their own status. 2 Alert Options: Single timeframe: each selected timeframe alert separately when a signal occurs Multi timeframes: all selected timeframes must agree for an alert to be triggered Both options have an input to select the timeframes to be used for the alert(s). How to understand the status: Green/Red square: bullish/bearish candle Options available in the FFx Dashboard Alerter
The indicator of a Professional Trader is an arrow indicator for predicting the direction of price movement. I have been working on this indicator since 2014. You can use this indicator as your main indicator, use its entry signals, and use it as your only indicator to find entry points. About the product: Recommended TF [H4-D1-W1]   . The indicator predicts the direction of the next candle. Fits a variety of tools; Flexibility in settings for different instruments and intervals through the MO
THE GRAFF III
Charles Harper
The [GRAFF] III manual trading system is based on multiple MetaTrader (MT4) indicators. Together, the entire PACK of GRAFF III indicators makes an advanced trading tool. The system consists of over 20 different custom-built indicators which have been carefully selected and tested in the long term to produce strong and efficient trading signals. The particular indicators are based on different mathematical formulas, so the entire system is calibrated to remove false signals from its own indicator
FFx Universal Strength Meter PRO is more than a basic strength meter. Instead of limiting the calculation to price, it can be based on any of the 19 integrated strength modes + 9 timeframes. With the FFx USM, you are able to define any period for any combination of timeframes. For example, you can set the dashboard for the last 10 candles for M15-H1-H4… Full flexibility! Very easy to interpret... It gives a great idea about which currency is weak and which is strong, so you can find the best pai

A simplistic indicator informing a user on RSI divergence by sending messages to mobile device and email. The indicator draws 2 vertical lines, marking two RSI extrema that formed the divergence. You get the alert, open the charts and make a decision. The indicator does not show past divergences, thus when you attach it to a chart for the first time you see nothing. Graphics and alerts will appear as soon as divergences do. Drop it in Tester to see how it works. Parameters: RSIPeriod - number of

Pan PrizMA CD Phase is an analogue of the МetaТrader 5 indicator , and is an option based on the Pan PrizMA indicator. Details . Averaging by a quadric-quartic polynomial increases the smoothness of lines, adds momentum and rhythm. Extrapolation by the sinusoid function near a constant allows adjusting the delay or lead of signals. The value of the phase - wave status parameter (which is close in meaning to the trigonometric phase or the angle of the radius-vector rotation in the trigonometric p
Green Wall Arrows
Daniel Luchinger
1 (1)
The Name Green Wall : Arrows hits a lot of TP, by changing the idea of non using SL as something bad, but instead use Small TP and a lot of free Margin and Patience. Use micro TP and a lot of Free Margin with this indicator on Forex. It also can be used with Binary Options. This strategy is intended to be traded Manually. This Indicator runs on Open Bar, arrows will delete when price are against it. The only Indicator Parameter is Alerts true/false, all the rest is included inside the code. Arro
Golden Monowave
Ahmed Mohamed Ali
Golden Monowave is monowave indicator, the monowave theory is one of Elliott wave approach and one of most complicate and accurate method. Golden Monowave can shortcut many major steps to identify and describe the monowave. It works on any timeframe and with any trading instrument, including currencies, indices, futures, etc. Input Parameters initial_Bars - set the initial number of bars to calculate. wave_color - select the color of the wave. label_color - select the color of labels. temp_labe
Ticks Size
Viktor Kolmakov
This indicator displays in a separate window the difference between the number of points which increased the price, and the number of points that decreased the price during the time interval specified in the settings. The time interval for calculation is expressed as the number of bars of the chart the indicator is attached to. This approach allows you to evaluate the movement direction (growth or fall) of the instrument's price, the strength of the movement and the size of the movement in point
FFx Basket Scanner
Eric Venturi-Bloxs
MetaTrader 5 version available here : https://www.mql5.com/en/market/product/24882 FFx Basket Scanner is a global tool scanning all pairs and all timeframes over up to five indicators among the 16 available. You will clearly see which currencies to avoid trading and which ones to focus on. Once a currency goes into an extreme zone (e.g. 20/80%), you can trade the whole basket with great confidence. Another way to use it is to look at two currencies (weak vs strong) to find the best single pairs
筛选:
无评论
回复评论