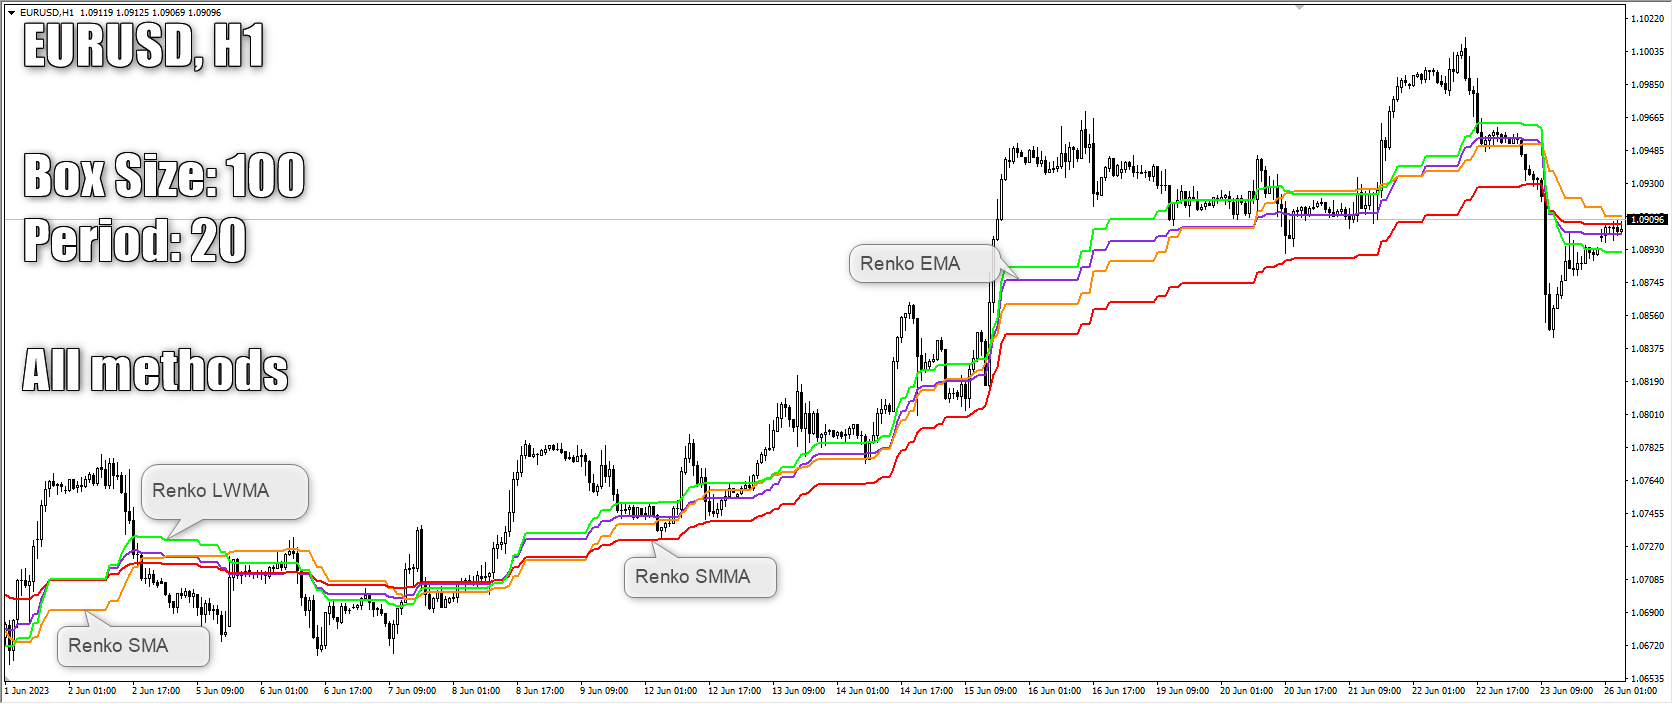
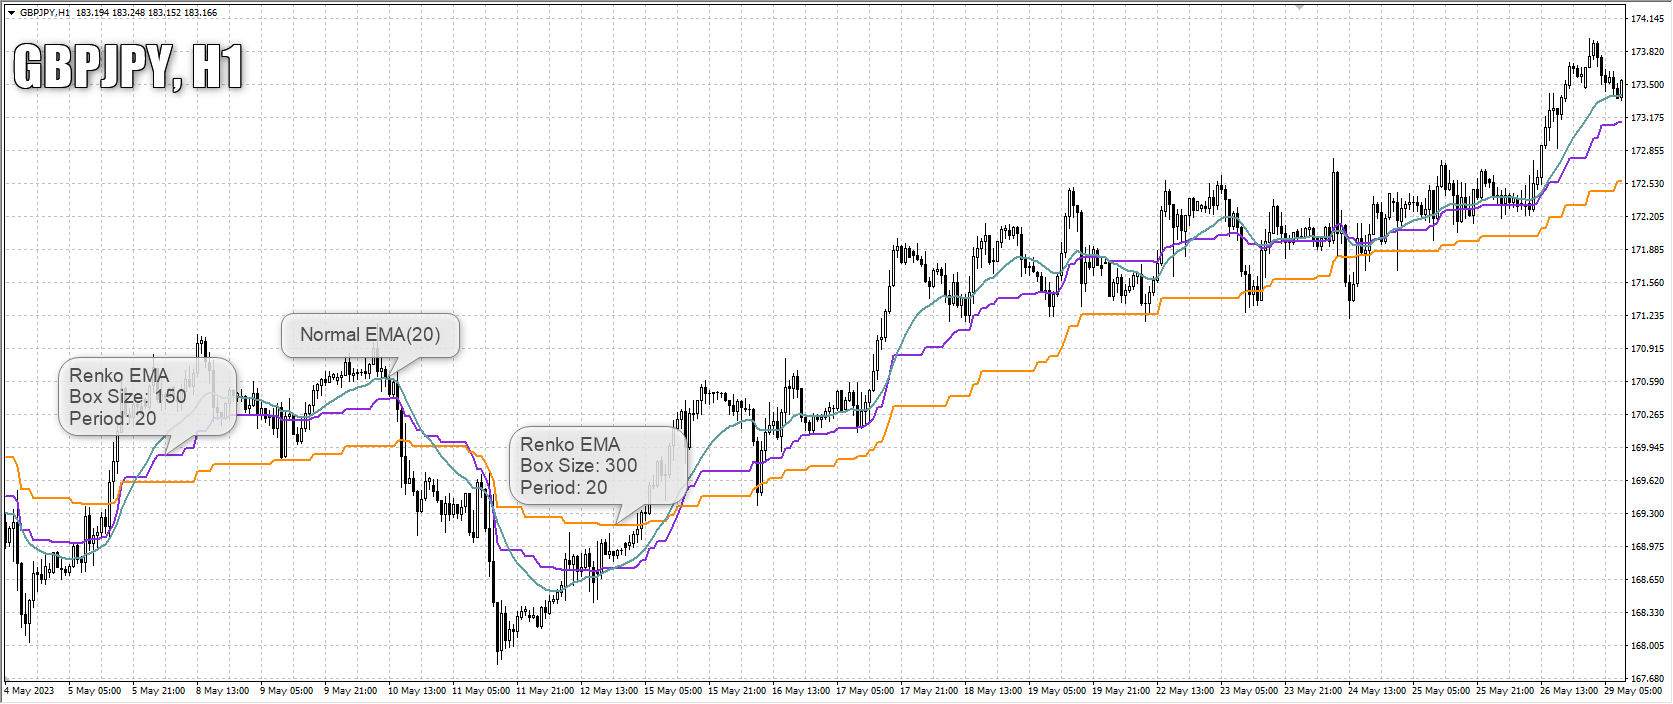
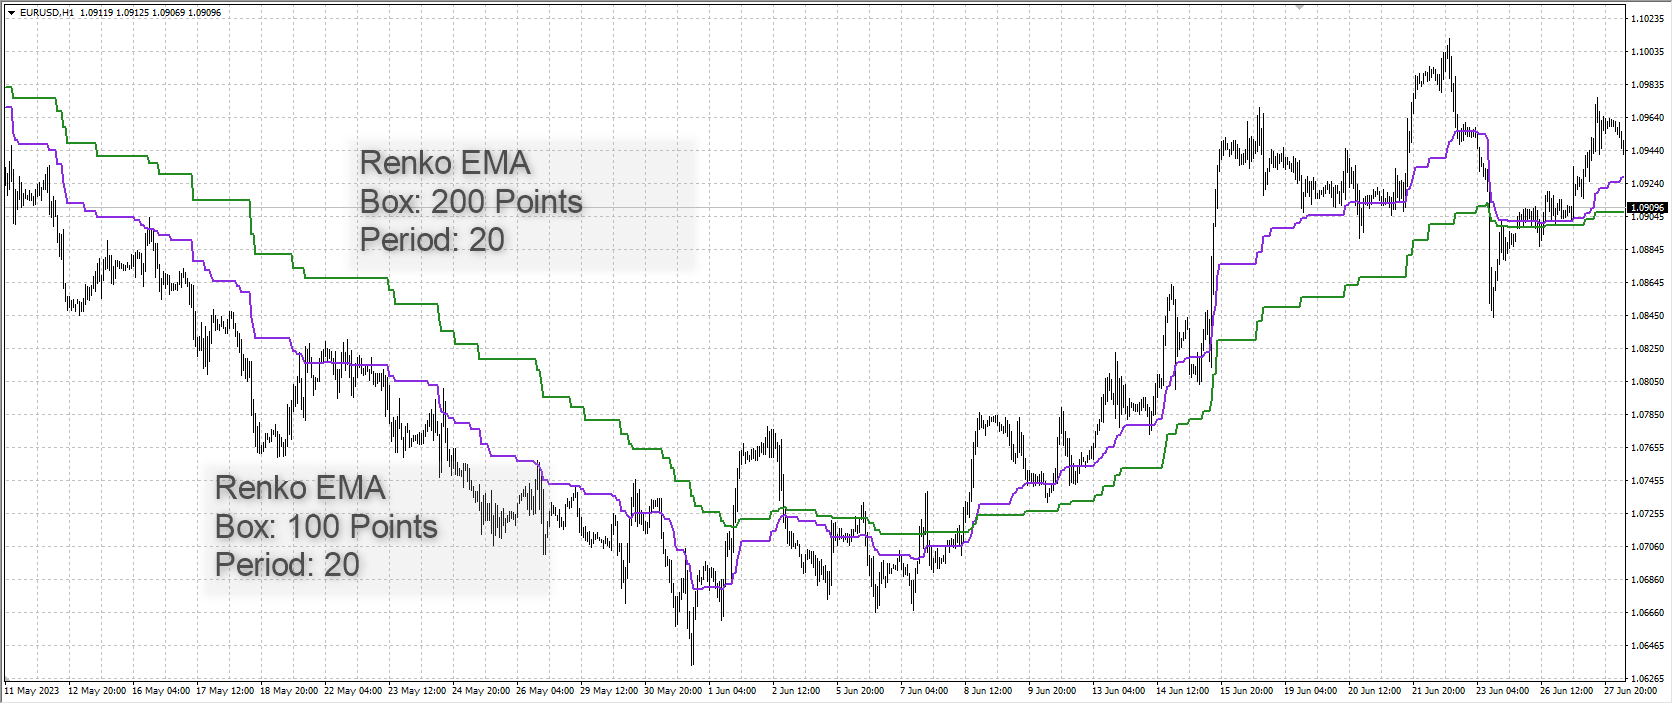
Renko Moving Average

This indicator gives you the Moving Average based on Renko chart.

A Renko chart is a type of chart that is built using price movement rather than both price and standardized time intervals like most charts are.

A Moving Average based on Renko chart is considered less noisy since it is not based on the time and only based on price change.

You can see my free enhanced Renko indicator here.


Inputs:

  • Box Size: Renko box size based on market Points.

  • Period: Moving Average Period

  • Method: Moving Average Method (SMA, EMA, SMMA, LWMA)


推荐产品
Power Renko MT4
Pierce Vallieres
Power Renko is an indicator which plots Renko bricks underneath the chart using a histogram. You can select the brick size and the timeframe of the Renko bricks as well as whether or not to use the close price or the high/low price of the candles. Renko bricks are based on price alone, not time, therefor the Renko bricks will not be aligned with the chart's time. They are extremely useful for trend trading and many different strategies can be formed from them. Buffers are provided allowing you t
MASi Three Screens
Aleksey Terentev
5 (2)
MASi Three Screens is based on the trading strategy by Dr. Alexander Elder. This indicator is a collection of algorithms. Algorithms are based on the analysis of charts of several timeframes. You can apply any of the provided algorithms. List of versions of algorithms:     ThreeScreens v1.0 - A simple implementation, with analysis of the MACD line;     ThreeScreens v1.1 - A simple implementation, with analysis of the MACD histogram;     ThreeScreens v1.2 - Combines the first two algorithms in
FREE
Renko Chart with Moving Average. Classic Renko charts idea. It is protted on main chart and Moving Average can be applied. Prices for bars are used from a lower timeframe. Parameters: BarsBack - how many bars of lower timeframe to use. If value is zero than it will use all available bars. LTF - lower timeframe. BrickSize - Renko bar in points. BullishColor - color for bull candle. BearishColor - color for bear candle. HideLineChart - if this value is true the line chart when be hidden when sele
FREE
Rira Renko
Vitor Palmeira Abbehusen
RENKO on Time Chart This indicator is an enhanced Renko, so you can watch the Renko bricks on the chart to understand price movement more clearly the other improvement is automated box size according to ATR (Average True Range) period you can set the ATR number as you want and the box size of Renko changes automatically based on price movement Inputs Mode: Box size is the input to specify the size of the Renko box you want to print on the chart. This input lets you choose the fixed box siz
Bigger chart labels would allow the user to be entirely aware of which chart he/she is on. Each chart window is unique, containing different patterns and economic motives so acknowledging the chart window would be absolutely essential! There are well known Economic Time Zones included in clear view, by choice!    Simple does it! Use your computing mouse scroller, clicking with the right finger on the label, in order to customize the label properties. From there, choose your preferred color, fon
FREE
Delta Fusion Pro
Francesco Secchi
5 (2)
Delta Fusion Pro – 高级订单流分析,专为日内交易设计 Delta Fusion Pro 是一款专业的 MetaTrader 4 指标,能够揭示市场中的主动订单流,实时显示机构压力的强度和方向。与传统的成交量指标不同,它分析买盘(Ask)与卖盘(Bid)之间的成交量差值(Delta),用于提前预测反转、确认趋势并识别专业兴趣区域。 主要特点 智能自动调节系统 根据以下条件自动调整所有参数: 交易品种类型(外汇、加密货币、指数、大宗商品、股票) 操作周期 市场波动率(ATR) 最近平均成交量 无需手动配置,适合新手交易者——指标自动完成校准! 核心功能 净Delta与累计Delta 计算主动买盘/卖盘成交量差值,支持自定义 EMA 平滑 实时显示方向性压力 可自定义直方图颜色(买入/卖出) 价格/成交量背离 自动检测常规与隐藏背离 强度分类:强/中/弱 高级过滤:成交量确认、趋势、时间距离 图形信号(彩色箭头) 市场失衡 识别显著的买盘/卖盘比例失衡(可配置比率) 最小成交量阈值验证 图表显示彩色点(多头/空头) Infusion Volume 检测异常成交量峰值(
EMACrossRenko
Hong Ling Mu
1 (1)
<LOGIC> The EMA RENKO EA should run in Renko chart to show the best performance. The EA will entry based on 2 EMA line cross. (it is changeable in parameter.) As a result of FT , the best box size for XAUUSD (GOLD) is BOX 60 to 100.  Renko box size should be larger than spread value. Normally 3 times of spread. Please decide your box size with yourself. The EA will place addtional order as Grid if the trend move  to xxx pips from the last order. You can turn on/off in the parameter. The MAC
VR Cub
Vladimir Pastushak
VR Cub 这是获得高质量切入点的指标。该指标的开发是为了促进数学计算并简化对仓位入场点的搜索。多年来,该指标所针对的交易策略已被证明其有效性。交易策略的简单性是其巨大的优势,即使是新手交易者也能成功进行交易。 VR Cub 计算开仓点以及获利和止损目标水平,这显着提高了效率和易用性。查看使用以下策略进行交易的屏幕截图,了解简单的交易规则。 设置、设置文件、演示版本、说明、问题解决,可以从以下位置获取 [博客] 您可以在以下位置阅读或撰写评论 [关联] 版本为 [MetaTrader 5] 计算入场点的规则 开仓 要计算入场点,您需要将 VR Cub 工具从最后一个高点拉伸到最后一个低点。 如果第一个点在时间上早于第二个点,交易者等待柱线收于中线上方。 如果第一个点在时间上晚于第二个点,交易者等待柱线收于中线下方。 根据上述条件,严格在 柱线收盘 后建仓。 换句话说,如果我们在小时图上进行交易,那么从最高点到最低点的时间距离必须超过24小时,最高点和最低点之间的点数必须大于或等于平均价格变动每天。 维持和改变市场地位 可以有多个未平仓头寸;每个头寸都可以单独修改。 VR Cub
Market Profile 3
Hussien Abdeltwab Hussien Ryad
3 (2)
Market Profile 3 MetaTrader 4 indicator  — is a classic Market Profile implementation that can show the price density over time, outlining the most important price levels, value area, and control value of a given trading session. This indicator can be attached to timeframes between M1 and D1 and will show the Market Profile for daily, weekly, monthly, or even intraday sessions. Lower timeframes offer higher precision. Higher timeframes are recommended for better visibility. It is also possible t
FREE
Auto Fibo Pro m
DMITRII GRIDASOV
“Auto FIBO Pro” Crypto_Forex 指标 - 是交易中的绝佳辅助工具! - 指标自动计算并放置在图表斐波那契水平和局部趋势线(红色)上。 - 斐波那契水平指示价格可能反转的关键区域。 - 最重要的水平是 23.6%、38.2%、50% 和 61.8%。 - 您可以将其用于反转剥头皮或区域网格交易。 - 还有很多机会可以使用 Auto FIBO Pro 指标来改进您当前的系统。 - 它具有信息价差掉期显示 - 它显示所连接的外汇对的当前价差和掉期。 - 显示屏还显示账户余额、净值和保证金。 - 可以将信息价差掉期显示定位在图表的任何角落: 0 - 左上角,1 - 右上角,2 - 左下角,3 - 右下角。 点击这里查看高质量的交易机器人和指标! 这是仅在此 MQL5 网站上提供的原创产品。
Trendline indicator
David Muriithi
2 (1)
Are you tired of drawing trendlines every time you're analyzing charts? Or perhaps you would like more consistency in your technical analysis. Then this is for you. This indicator will draw trend lines automatically when dropped on a chart. How it works Works similar to standard deviation channel found on mt4 and mt5. It has 2 parameters: 1. Starting Bar 2. Number of bars for calculation The   starting bar   is the bar which drawing of the trend lines will begin, while the   number of bars for c
FREE
The indicator allows you to trade binary options. The recommended time frame is М1 and the expiration time is 1,2,3 minutes. The indicator suitable for auto and manual trading. A possible signal is specified as a arrows above/under a candle. You should wait until the candle closes! Arrows are not re-painted Trade sessions: TOKYO section (Half-end) Currency pairs: USD/JPY Working time frame: M1 Expiration time: 1,2,3 minutes. The indicator also shows good results when using the martingale strateg
FREE
Price Magnets
Ivan Simonika
Price Magnet — Price Density and Attraction Levels Indicator Price Magnet is a professional analytical tool designed to identify key support and resistance levels based on statistical Price Density. The indicator analyzes a specified historical period and detects price levels where the market spent the most time. These zones act as “magnets,” attracting price action or forming a structural base for potential reversals. Unlike traditional Volume Profile tools, Price Magnet focuses on price-time d
The BLACK ZONE PREMIUM INDICATOR is a powerful all-in-one trading assistant built to bring clarity, precision, and consistency to forex trading. It combines multi-timeframe market structure, trade forecasting, risk management, and live monitoring into one professional-grade tool. From planning trades to managing them with discipline, this indicator equips traders with everything they need to make informed and confident decisions. If you’ve been looking for a professional solution that simplifies
EARLY REMINDER: The Starting price is 65 price will rise soon up to 365$ and then 750$ after first 10 copies of sales. Grab this offer now! Introduction Hello, traders! Welcome to the demonstration of the Forex Beast Indicator , a comprehensive tool designed to assist aspiring traders in navigating the complexities of the forex market. This indicator incorporates seven essential components to provide a well-rounded trading experience: Moving Averages Colored Zones Support and Resistance Levels
MAD Bands (Moving Average Deviation Bands) MAD Bands are intended to be used when you want to visually check the behavior of price volatility in relation to a moving average. MAD_Bands (MQL4 version) parameter description This document explains the MT4 parameter input screen for each setting item (input parameter). Group: Main (basic settings) Period Default   :       20 Explanation   : The number of candlesticks used to calculate the moving average (Mid) and band width. The larger the value,
FREE
Advanced CRT Indicator MT4 — Candle Range Theory Tool Advanced CRT Indicator MT4 is a professional analysis tool that automates Candle Range Theory. It identifies consolidation ranges, breakout levels, Fair Value Gaps (FVG), and profit targets, with a real-time dashboard and alerts. Overview - Multi-timeframe candle range detection   - Automatic breakout levels with buffer settings   - Fair Value Gap identification and tracking   - Up to three customizable target levels (Risk:Reward ratios)  
这是一个预测蜡烛收盘价的指标。 该指标主要用于 D1 图表。 该指标适用于传统外汇交易和二元期权交易。 该指标可以用作独立的交易系统,也可以作为您现有交易系统的补充。 该指标分析当前蜡烛,计算蜡烛本身内部的某些强度因素,以及前一根蜡烛的参数。 因此,该指标预测市场走势的进一步方向和当前蜡烛的收盘价。 由于这种方法,该指标既适用于短期盘中交易,也适用于中长期交易。 该指标允许您设置指标在分析市场情况期间将产生的潜在信号的数量。 在指标设置中有一个特殊的参数。 此外,该指标可以通过图表上的消息、电子邮件以及推送通知的形式通知新信号。感谢您的关注!交易愉快! 购买后一定要写信给我! 我会给你我的交易指标的建议! 还可以获得奖金!
Smart FVG indicator MT4
Ahmad Kazbar
4.67 (3)
Smart FVG 指标 MT4 – MetaTrader 4 高级公平价值缺口检测 Smart FVG 指标为 MetaTrader 4 提供专业的公平价值缺口(Fair Value Gap,FVG)检测、监控和告警功能,所有信息都直接显示在图表上。它将基于 ATR 的过滤与结构感知逻辑相结合,帮助你去除噪音、适应流动性,并只保留最关键的不平衡区域,从而做出更加精确的交易决策。 主要优势 精准的 FVG 检测:识别真正的市场低效,而不仅仅是简单的 K 线价格跳空。 基于 ATR 的自适应精度:根据不同市场与周期自动过滤低质量信号。 实时有效性跟踪:当价格填补或突破缺口时,相关区域会被自动延伸、调整或删除。 高度可视化与自定义:可根据任何模板自定义颜色、线型和填充样式。 实用告警功能:对新出现、被填补或被突破的 FVG 提供实时通知。 性能优化:轻量化设计,适合多品种、多周期同时扫描。 工作原理 将指标加载到任意 MT4 品种与时间周期图表上。 算法会扫描历史与实时 K 线,标出当前有效的 FVG 区域。 ATR 逻辑会根据当前波动率和流动性动态调整检测条件。 当价格完全回补缺口
FREE
Trade Direction
Gevorg Hakobyan
5 (1)
The oscillator shows trend direction using its own algorithm, which is based on calculating price values ​​by analyzing prices of separate currencies (original valuation of currencies). The histogram shows the average value of physical price change over the selected period. When the histogram has a positive value, the trend is rising, if negative - the trend id falling. The indicator uses standard RSI to determine the current market direction on a selected period as follows: the default value of
Find and fill Gaps
Leandro Oliveira
This indicator shows the gaps on the current chart with a rectangle shape and indicates when the gap is filled by closing the shape. Gaps are considered over the shadows. Allows sending alerts by e-mail or push notifications when a gap is found. Parameters SizeGAP - Size of the gap that you want to indicate; HGcolor1 - Color of the gap in an upward movement; HGcolor2 - Color of the gap in a downward movement; HGstyle - The style of rectangle to be drawn; StartCalculationFromBar - How many candl
SX Supply Demand Zones accurately identifies and draws high-probability Supply and Demand zones using a sophisticated algorithm. Unlike traditional indicators that clutter your chart, this indicator is designed with a focus on performance and a clean user experience. New Unique Feature: Interactive Legend System What truly sets this indicator apart from everything else is the Interactive Control Legend. You have a professional dashboard directly on your chart that allows you to: Show/Hide: Ins
FREE
Super Reversal Pattern
Parfait Mujinga Ndalika
Super Reversal Pattern Indicator Unlock the power of advanced pattern recognition with our Super Reversal Pattern Indicator. Designed for traders seeking precision and reliability, this indicator identifies one of the most effective reversal patterns in technical analysis, offering a significant edge in your trading strategy. Key Features: Non-Repainting Accuracy: Enjoy the confidence of non-repainting technology. Once a Super Reversal Pattern is detected, it remains static, providing consiste
ADM Multiframe
Dmitriy Susloparov
ADM Oscillator Multiframe Unlike the classic indicator " Average Direction Movement index ", this indicator shows directly the difference between the +DI and -DI values. When +DI is greater than -DI results above zero and vice versa. This is more visual and, in addition, allows you to clearly see the interaction of indicator readings for different timeframes. It also uses a proprietary technology that allows you to see different timeframes simultaneously on a single time scale. For example, fo
Renko Bars 3in1
Yuriy Shatsckiy
5 (2)
The Renko_Bars_3in1 is designed for plotting 3 types of Offline Renko charts. Standard Renko Bar (the reversal bar is twice the size of the bar). Renko Range Bar (the size of all bars is the same). Renko Bars with the ability to adjust the size of the reversal bar. Attention : The demo version for review and testing can be downloaded here . Note . A chart with the M1 period is necessary to build an offline chart. When the indicator is attached to a chart, the offline chart is opened automaticall
Candle GAP
Thushara Dissanayake
3 (1)
Candle GAP 指标是交易者使用 缺口交易策略的 重要工具,因为它会自动识别一周中每一天的蜡烛缺口。缺口是指连续两天的收盘价和开盘价之间的价格水平差异。该指标识别四种类型的缺口模式:常见、突破、延续和耗尽。通过将该指标纳入任何图表,交易者可以验证他们的信号并增强他们的交易决策。 Candle GAP 指标的主要特点之一是它的多功能性,因为它可用于 D1(每日)下的任何时间范围以及任何交易品种或工具。它提供易于使用的参数,使所有经验水平的交易者都可以使用它。该指标在图表上迅速绘制缺口形态,便于快速分析和决策。它的简单性增加了它的可用性,确保了简单高效的交易体验。 指标的数据显示参数允许交易者自定义缺口信息的外观。用户可以选择所需的字体系列和大小来显示与一周中的每一天相关的文本。此外,可以为星期一、星期二、星期三、星期四和星期五分配单独的颜色,提供视觉清晰度和易于解释。 总体而言,Candle GAP 指标是寻求利用缺口交易策略的交易者的强大工具。它有助于识别和确认缺口模式,使交易者能够跨各种时间框架和交易品种做出明智的交易决策。 参数 数据显示参数 - 自定义视觉外观和颜色。
FREE
RenkoMaPriceChannel
Sergey Deev
1 (1)
The indicator displays Renko bars on the chart, uses their data to calculate and display the moving average, PriceChannel and generates buy/sell signals. Renko is a non-trivial price display method. Instead of displaying each bar within a time interval, only the bars where the price moved a certain number of points are shown. Renko bars do not depend on a time interval, therefore the indicator works on any timeframe without losing its efficiency. The PriceChannel indicator displays the upper, lo
新的、更準確的 Xmaster 指標版本。來自世界各地的 200 多名交易者在他們的 PC 上對該指標的不同組合進行了 15,000 多次測試,以獲得最有效和最準確的公式。在這裡,我們向您展示“Xmaster 公式指標外匯無重繪”指標,它顯示準確的信號且不重繪。該指標還通過電子郵件和推送向交易者發送信號。隨著每個新報價的到來,它不斷地通過超過 75 個參數分析市場,並向交易者顯示準確的買入和賣出信號。此外,在該指標的幫助下,您可以看到趨勢現在朝著哪個方向發展,以便在正確的方向上進行交易。 新的“Xmaster 公式指標外匯無重繪”指標如何工作,它與舊版本有何不同? 首先,它是最優化的市場分析算法,已被全球不同交易者測試超過 15,000 次。 其次,該指標配備了針對錯誤信號的獨特算法過濾器,這使其成為每個交易者非常有用的工具。它特別適合使用剝頭皮策略進行交易,因為了解價格的每日方向非常重要。而這個新指標很好地說明了這一點。 第三,與舊版本不同,這個新指標“Xmaster 公式指標外匯無重繪”向電子郵件發送信號並推送。為您的交易策略配備如此專業的工具,您一定會在交易中獲得巨大優勢,並能
Volume Compair
Thiago Pereira Pinho
5 (1)
专业累计德尔塔与成交量中位线指标 通过这款强大的成交量分析工具,追踪 真实的买卖压力 。 成交量比较指标 (Volume Compare Indicator) 结合了 累计德尔塔 (Cumulative Delta) 和 成交量中位线 (Volume Medians) ,帮助您识别机构活动、失衡以及潜在的反转。  主要特点:  累计德尔塔直方图 – 实时可视化净买入成交量与净卖出成交量。  买入/卖出成交量中位线 – 显示平均买入和卖出成交量水平的水平线。  智能成交量分类 – 分隔: 强劲买入(绿色) – 看涨压力。 强劲卖出(红色) – 看跌压力。 买入成交量中位线(蓝色线) – 典型买入量的参考。 卖出成交量中位线(橙色线) – 典型卖出量的参考。  可自定义参数 – 调整 CDIPeriod 和 CDIRange 以设置敏感度。  EMA 平滑成交量 – 减少噪音,使信号更清晰。  如何帮助交易者: 发现机构活动 – 异常的成交量尖峰指示大玩家进场。 确认突破/反转 – 强烈的德尔塔背离警告假动作。 基于成交量的支撑/阻力 – 中位线充当动态参考水平。 日内交
Auto Gann Zones MT4
Sarika G Talekar
Here is a highly professional, high-converting product description for the Propfolio Auto Gann Zones indicator. This highlights its mathematical precision, clean UI, and advanced auto-mitigation features. MQL5 Product Description Title: Propfolio Auto Gann Zones (MTF & Auto-Mitigating) Description: Gann Theory is one of the most powerful ways to identify market reversals, but drawing the zones manually across multiple timeframes is tedious, subjective, and clutters your charts. The Propfolio Aut
该产品的买家也购买
Scalper Inside PRO
Alexey Minkov
4.74 (69)
Scalper Inside PRO – Since 2020. An exclusive indicator that utilizes an innovative algorithm to swiftly and accurately determine the market trend. The indicator automatically calculates opening, closing, and profit levels, providing detailed trading statistics. With these features, you can choose the most appropriate trading instrument for the current market conditions. Additionally, you can easily integrate your own arrow indicators into Scalper Inside Pro to quickly evaluate their statistics
Gann Made Easy
Oleg Rodin
4.83 (162)
Gann Made Easy 是一个专业且易于使用的外汇交易系统,它基于使用先生理论的最佳交易原则。 W.D.江恩。该指标提供准确的买入和卖出信号,包括止损和获利水平。您甚至可以使用推送通知在旅途中进行交易。 购买后请联系我,即可免费获得交易指导和超棒的额外指标! 您可能已经多次听说过江恩交易方法。通常 Gann 的理论不仅对于新手交易者而且对于那些已经有一定交易经验的人来说都是非常复杂的东西。这是因为江恩的交易方法在理论上并不那么容易应用。我花了几年时间来完善这些知识,并将最好的原则应用到我的外汇指标中。 该指标非常易于应用。您所需要的只是将其附加到您的图表并遵循简单的交易建议。该指标不断进行市场分析工作并寻找交易机会。当它检测到一个好的入口点时,它会为您提供一个箭头信号。该指标还显示止损和获利水平。 换句话说,当您像先生一样进行交易时,该指标会为您提供最佳江恩建议。江恩亲自告诉你此时此刻该做什么。但最好的部分是您不需要了解任何有关江恩交易原则的知识,因为该指标会为您完成整个市场分析工作。
M1 Sniper
Oleg Rodin
5 (22)
M1 SNIPER 是一款易于使用的交易指标系统。它是一个专为 M1 时间框架设计的箭头指标。该指标可以作为独立的系统在 M1 时间框架下进行剥头皮交易,也可以作为您现有交易系统的一部分使用。虽然该交易系统专为 M1 时间框架交易而设计,但它也可以用于其他时间框架。我最初设计此方法是为了交易 XAUUSD 和 BTCUSD。但我发现这种方法在其他市场交易中也同样有用。 指标信号既可以顺势交易,也可以逆势交易。我教授一种特殊的交易技巧,帮助您利用指标信号进行双向交易。该方法基于使用特殊的动态支撑位和阻力位区域。 购买后,您可以立即下载 M1 SNIPER 箭头指标。此外,我还为所有 M1 SNIPER 工具用户免费提供下方屏幕截图所示的 Apollo Dynamic SR 指标!这两个指标的组合可以帮助您更轻松、更准确地利用 M1 时间框架进行交易。 购买后请联系我,免费获取交易提示和奖励指标! 祝您交易成功!
GoldRush Trend Arrow Signal
Kirk Lee Holloway
5 (2)
GoldRush 趨勢箭頭信號 GoldRush 趨勢箭頭信號 指標為 XAU/USD 中的高速、短期短線交易者提供精確、實時的趨勢分析。 專為1分鐘時間框架設計,此工具顯示方向箭頭以明確顯示入場點,使短線交易者能在波動市場中自信操作。 該指標包含主要和次要警示箭頭。主要信號為白色和黑色方向箭頭,用於指示趨勢方向的轉變;次要信號為藍色和紅色箭頭,用於確認主要箭頭指示的方向並提示潛在交易入場點。 注意:當趨勢方向發生變化後僅出現一個主要警報箭頭時,請注意可能會出現多個次要藍/紅箭頭。次要信號將在滿足信號標準的任何蠟燭圖後出現,因此在長期趨勢移動中,螢幕上將顯示大量次要箭頭(如附帶的截圖所示)。您可在設置中開啟或關閉任一箭頭類型。 以下是我使用此指標進行交易的方式: - 對於買入入場,我會耐心等待白箭頭在蠟燭收盤時出現,並在下一根可用蠟燭收盤時出現藍箭頭時進行買入交易。 - 對於賣出入場,我會耐心等待黑箭頭在蠟燭收盤時出現,並在下一根可用蠟燭收盤時出現紅箭頭時進行賣出交易。 - 獲利了結/止損設置由使用者自行負責,但我個人使用最低R:R為1:2,並發現這在倫敦/紐約開盤等
PRO Renko System
Oleg Rodin
5 (30)
PRO Renko Arrow Based System for trading renko charts.  准确的信号交易任何外汇工具. 另外,我将免费提供系统的附加模块! PRO Renko系统是RENKO图表上高度准确的交易系统。该系统是通用的。 该交易系统可应用于各种交易工具。 该系统有效地中和了所谓的市场噪音,打开了获得准确反转信号的通道。 该指标易于使用,只有一个参数负责产生信号。 您可以很容易地使算法适应您感兴趣的交易工具和renko酒吧的大小。 我很乐意通过提供任何咨询支持来帮助所有客户有效地使用该指标。 祝您交易成功!购买后,立即写信给我! 我将与您分享我的建议和我的renko发电机。 另外,我将免费提供系统的附加模块!
Market Makers
Mohamed Hassan
5 (4)
After purchase, contact me privately to receive 1 month of free testing with EA Forex Proton! This advanced MT4 trading robot automatically executes signals from any MT4 indicator, including Market Makers. The latest version also includes AI integration, allowing each trade signal to be analyzed using Artificial Intelligence. Live Signal with EA Forex Proton: Click here Market Makers is a powerful price action trading system designed to identify high-probability Buy and Sell opportunities based
KuKl
IGOR KIRIANEN
The indicator is built on a non-standard Zig Zag, it draws accumulations after which if the price leaves this zone and a test of this zone occurs, then a sound signal is given and an arrow appears - after the test candle closes.The indicator does not redraw its signals, it is very easy to use, there are only three settings 1- this is the zig zag parameter 2- this is the minimum price exit from the zone 3- this is the maximum price exit from the zone. The lower the parameter for Zig Zag, the more
Advanced Supply Demand
Bernhard Schweigert
4.91 (300)
现在优惠 40%! 任何新手或专业交易者的最佳解决方案! 该指标是一款独特、高质量、且价格合理的交易工具,因为我们已经整合了许多专有功能和新公式。 依据此更新,您将能够显示双重时间帧区域。 您不仅可以显示一个较高的时间帧,还可以同时显示图表时间帧,加上更高的时间帧:显示嵌套时区。 供需双方所有交易者都会喜欢它。 :) 重要信息披露 高级供需的最大潜力,请访问 https://www.mql5.com/zh/blogs/post/720245   想象您的交易如何得以改善,是因为您能够精准定位入场或目标位吗? 构建于新的底层算法,它可以更轻松地识别出买卖双方之间的潜在失衡。 这是因为它以图形方式展示供需最强劲区域,及其过去的表现(显示旧区域)。 这些功能旨在帮助您更轻松地发现最佳入场区域和价位。 现在您可以针对您的交易品种和时间帧来优化和编辑区域强度! 高级供需指标适用于所有产品和时间帧。 它是一个新的公式,非常新的功能是两个区域强度函数可由用户输入进行调整! 这在交易中是一大优势。 当您学习如何使用专有功能,例如带有价格游离最小 X 因子的区域强度时,您能够判断该区域强劲与否。 供需
Cyclic Impulse
Vitalyi Belyh
构建图表并识别周期性价格变动的技术指标。 可以在任何图表上工作。 几种类型的通知。 图表本身还有额外的箭头。 无需重新绘制历史记录,只需关闭蜡烛即可。 建议使用 M5 及以上的 TF。 易于使用和配置参数。 当使用 2 个具有不同参数的指标时,您可以单独使用它们,而无需其他指标。 有 2 个输入参数 周期性和信号持续时间 这两个参数处理图表结构的处理。 Cyclicity 调节反转周期的变化频率,平滑周期。 Signal duration 为最小数字,检测价格变动中的脉冲,最大长期趋势变动。    ---------------------------------------------------------------------------------------
NAM Divergences
NAM TECH GROUP, CORP.
5 (1)
MT4多時限發散和超買/超賣檢測指標。 特徵 -在圖表控制面板上完全可自定義,提供完整的交互。 -隨時隨地隱藏和顯示控制面板。 -有關非大寫差異的實時信息。 -有關超買/超賣情況的實時信息。 -有關規則差異的實時信息。 -有關隱藏分歧的實時信息。 -可用於發散檢測的振盪器:AO,RSI,CCI,MACD,STOCH,RMI,TDI,RSIOMA。 -通知服務(屏幕警報|推送通知)。 概括 使用差異交易有助於發現趨勢減弱或勢頭逆轉。有時,您甚至可以將其用作趨勢持續的信號。我們的工具在一個非常舒適和直觀的控制面板中同時提供所有時間範圍的差異檢測,並具有顯示和隱藏的可能性,以使您的圖表盡可能保持清潔。 您會在選擇的歷史時期實時看到超買和超賣情況,定期背離,隱藏背離和無資本背離。 對於沒有大寫字母的差異,我們會在屏幕上顯示MT4通知,並將通知推送到您的手機!
Advanced Currency IMPULSE with ALERT
Bernhard Schweigert
4.9 (490)
目前40%的折扣!! 对任何新手或专家交易者来说都是最好的解决方案! 这个指标是一个独特的、高质量的、负担得起的交易工具,因为我们已经纳入了一些专有的功能和一个秘密的公式。只需一张图表,它就能给出所有28种货币对的警报。想象一下,你的交易将如何改善,因为你能够准确地确定新趋势或剥头皮机会的触发点 建立在新的基础算法上,它使识别和确认潜在交易变得更加容易。这是因为它以图形方式显示了一种货币的强势或弱势是否正在加速,并测量了这种加速的速度--把它想象成你汽车中的速度表。当你加速时,事情显然会发生得更快,这在外汇市场上也是一样的,即如果你配对的货币正在向相反的方向加速,你就会发现一个潜在的有利可图的交易。 货币动量的垂直线和箭头将指导你的交易! 动态的市场斐波那契23水平被用作警报触发器,将适应市场活动。如果冲动触及黄色触发线,您将在MetaTrader或您的电子邮件或推送警报中收到警报。然后你就知道作为一个交易员应该做什么。货币对和方向已经给出。只要点击警报按钮,就可以切换到该货币对或打开一个新的图表,以便进一步分析。警报级别可以通过用户输入来改变,可以选择3个敏感度级别。 尽
Auto Optimized Parabolic RSI: 高级 3D 动量引擎 大多数零售指标之所以失效,是因为它们依赖于静态输入,一旦市场波动率发生变化,这些输入就会崩溃。Auto Optimized Parabolic RSI 通过不断重新计算自身的数学优势,解决了“指标衰退”的问题,将机构级别的量化自适应能力直接引入您的 MT5 终端。 核心优势:定制的内存 3D 优化   标准的自动优化器通常会导致 MT5 平台卡顿,因为它们通过标准的指标调用使终端超载。该工具完全绕过了这些性能瓶颈。内部引擎采用定制的原生基于 RAM 的计算器构建,每次加载图表或更改时间周期时,它都会执行极速的 3D 网格搜索。它同时扫描 RSI 周期(频率)、SAR 步长(加速度)和 SAR 最大值(速度限制),在绝对的毫秒级时间内测试数以万计的参数组合,且完全不会拖慢您的平台。它不是仅仅寻找一个“不错”的设置,而是映射整个参数空间,以寻找资产当前动量结构的绝对全局最大值。 严格的财务评分与逼真的交易模拟   与基于抽象“指标点数”进行优化评分的业余工具不同,该引擎的 3.10 版本严格与资金数学挂钩。每
Advanced Currency Strength28 Indicator
Bernhard Schweigert
4.91 (657)
目前40%的折扣 任何新手或专家交易者的最佳解决方案! 这个指标是一个独特的、高质量的、可负担得起的交易工具,因为我们纳入了一些专有的功能和一个新的公式。只需一个图表,你就可以读出28个外汇对的货币强度!想象一下,你的交易将如何得到改善,因为你的交易是在你的手中进行的。想象一下,你的交易将如何改善,因为你能够准确地确定新趋势或剥头皮机会的触发点? 用户手册:点击这里  https://www.mql5.com/en/blogs/post/697384 这是第一本,原版的! 不要买一个毫无价值的崇拜者的克隆品。 特别的 子窗口中的箭头显示强劲的货币势头GAP将指导你的交易! 当基础货币或报价货币处于超卖/超买区域(外盘斐波那契水平)时,在个人图表的主窗口中出现警告信号。 当货币力量从外围区间回落时,回撤/反转警报。 十字星模式的特别警报 可选择多个时间框架,以快速查看趋势! 货币强度线在所有的时间框架中都非常平稳,当使用较高的时间框架来识别总体趋势,然后使用较短的时间框架来确定精确的入口时,效果非常好。你可以根据自己的意愿选择任何时间框架。每个时间框架都由其自身进行了优化。
RFI levels PRO
Roman Podpora
5 (1)
该指标能够准确显示反转点和价格回落区域。     行业领军人物 。您能洞察新趋势的形成,并以最高的精准度做出决策,掌控每一笔交易。 与……结合时,展现其最大潜力     趋势线专业版   指标  VERSION MT5 该指标显示的内容: 新趋势开始时的反转结构和反转水平及其激活。 显示屏   获利了结   和   止损   风险回报比最低的水平     RR 1:2       。 具有智能减值逻辑的止损。 显示指定指标中两种趋势类型的反转形态。 指标: 根据     趋势线     (全球趋势变化) 潮流专业版     (趋势快速变化) 简单有效   扫描器   实时趋势(新增)。 多时间框架工具筛选。 展示   利润   在 LOGIC AI 信号之后。 以下列出今日走势积极的金融工具。(RB键) 能够为终端启用通知(警报)功能,并向移动设备推送通知。 逻辑人工智能     — 利用人工智能寻找最佳切入点。 只有在启用 MTF(多时间框架分析)模式时,该功能才可用。 兼容性。 当与趋势线指标结合使用时,该指标能发挥其最大潜力。 这     RFI LEVELS PRO    
Dynamic Scalper System
Vitalyi Belyh
5 (1)
“ Dynamic Scalper System ”指标专为在趋势波内进行剥头皮交易而设计。 已在主要货币对和黄金上进行测试,并可与其他交易工具兼容。 提供顺势短线建仓信号,并提供额外的价格变动支持。 指标原理: 大箭头决定趋势方向。 在趋势波内,我们采用一种生成小箭头形式的剥头皮交易信号的算法。 红色箭头代表看涨方向,蓝色箭头代表看跌方向。 敏感的价格变动线会沿着趋势方向绘制,并与小箭头信号协同作用。 信号运作方式如下:当线在适当时刻出现时,将形成入场信号;在出现线时,持仓;线完成后,平仓。 建议的操作时间范围为M1 - H4。 箭头在当前K线上方形成,如果下一根K线已开仓,则不会重新绘制上一根K线上方的箭头。 输入参数 Trend Wave Period - 趋势方向(大箭头)的周期,改变趋势波的时间间隔。值 1 表示趋势方向的最长持续时间,参数值越大,持续时间越短。 Scalper Arrows Period - 信号箭头(小箭头)的计算周期,改变入场信号的生成频率。值 3 表示最频繁的生成频率,参数值越大,箭头频率越低,准确度越高。 这些参数可以根据不同的时间范
Apollo SR Master
Oleg Rodin
5 (2)
Apollo SR Master 是一款支撑/阻力指标,其特殊功能使利用支撑/阻力区域进行交易更加便捷可靠。该指标通过检测局部价格顶部和底部,实时计算支撑/阻力区域,没有任何时间延迟。为了确认新形成的支撑/阻力区域,该指标会显示特殊信号,表明该支撑/阻力区域可以作为实际的卖出或买入信号。在这种情况下,支撑/阻力区域的强度会增强,因此从该区域进行交易的成功率也会更高。这正是该指标的核心理念。 SR区域也使止损和止盈的操作更加便捷。根据信号方向,可以将SR区域上方或下方的空间用作止损位。此外,相对的SR区域也可以用作潜在的止盈区域。 我还免费向所有 Apollo SR Master 指标的用户提供我的“Apollo 价格行为系统”指标。这两个指标结合使用将帮助您找到更好的入场点。 购买后请联系我,即可免费获得我的交易技巧以及我的“阿波罗价格行为系统”指标作为赠品!
Scalping Lines System 是一款专为交易黄金 (XAUUSD) 而设计的短线交易系统,适用于 M1-H1 时间框架。 它整合了趋势、波动率和超买/超卖市场分析指标,并将其集成到一个振荡器中,用于识别短期信号。 信号线的主要内部参数已预先配置。 部分参数可供手动调整:“趋势波持续时间”,用于根据趋势移动平均线 (MA) 调整趋势方向上一系列信号的持续时间;以及“信号线平滑处理”,用于调整信号线的生成方式。 该指标在开盘价计算信号线时不会重绘。在其他价格下,信号箭头可能会闪烁。 信号在蜡烛图收盘后出现,并提供多种警报类型。 推荐使用的时间框架:M1-M5-M15-M30-H1。 该指标最初设计用于黄金交易,但也适用于交易波动性高、点差低的资产,例如比特币和加密货币、白银以及股票指数差价合约(如纳斯达克100指数等)。 对于某些其他交易品种(例如欧元/美元、英镑/美元),该指标可用于15分钟及以上的时间框架。 如何使用该指标进行交易。 对于“卖出”信号: 蓝色下降箭头位于顶部。 震荡指标顶部会出现一个蓝色箭头,箭头后的蓝线表示信号支撑持续时间。请跟随
地震仪 市场地震探测器。 Description in English : https://www.mql5.com/en/market/product/113869?source=Site+Market+Product+Page#description How to use the Seismograph : https://www.mql5.com/en/market/product/113869#!tab=comments&page=2&comment=52806941 Create an EA : https://www.mql5.com/en/market/product/113869#!tab=comments&page=3&comment=52816509 无论您以何种方式交易,您都绝对希望避免进入低流动性市场。 然而,即使你确保在应该繁忙的市场时间进入,事实是许多人经常被困在流动性低的市场中。 经过几个小时的等待,市场突然变得繁忙起来,但是......事实证明,现在很多人都站在了与市场相反的方向上。 如果人们不得不等待浮动负数需要很长时间,甚至人们不得不止
Trend Screener
STE S.S.COMPANY
4.79 (95)
趋势指标,趋势交易和过滤的突破性独特解决方案,所有重要趋势功能都内置在一个工具中! 它是 100% 非重绘多时间框架和多货币指标,可用于所有符号/工具:外汇、商品、加密货币、指数、股票。 限时优惠:支撑和阻力筛选指标仅售 65美元,终身有效。(原价 250 美元)(优惠延长) 趋势筛选器是有效的指标趋势跟踪指标,它在图表中提供带有点的箭头趋势信号。 趋势分析器指标中可用的功能: 1.趋势扫描仪。 2. 具有最大利润分析的趋势线。 3.趋势货币强度计。 4. 带有警报的趋势反转点。 5. 带有警报的强趋势点。 6. 趋势箭头 每日分析示例,每日信号表现...等与我们的趋势筛选指标,可以在这里找到: 点击这里 限时优惠:Trend Screener Indicator 仅售 150 美元且终身可用。原价 199$) 通过访问我们的 MQL5 博客,您可以找到我们所有的高级指标以及分析示例、每日信号表现...等。 : 点击这里 我们的趋势系统由 2 个指标组成: 1. Trend Screener Indicator:显示趋势仪表盘、图表中的趋势线、入场点...等。 2. Trend
Atomic Analyst
Issam Kassas
5 (5)
首先值得强调的是,该交易指标是非重绘、非延迟的指标,这使其成为手动和机器人交易的理想选择。 用户手册:设置、输入和策略。 Atomic Analyst是一种PA价格行动指标,利用价格的力量和动量来寻找市场上更好的机会。配备了高级过滤器,可帮助去除噪音和假信号,并提高交易潜力。使用多层复杂的指标,Atomic Analyst扫描图表,并将复杂的数学计算转化为任何初学者都能理解并用来做出一致交易决策的简单信号和颜色。 “Atomic Analyst”是专为新手和经验丰富的交易者量身定制的综合交易解决方案。它将高级指标和一流功能融合为一体的交易策略,使其成为所有类型交易者的多功能选择。 日内交易和剥头皮策略:专为快速准确的日内交易和短期交易而设计。 日内和摆动交易策略:可用作追求价格大幅波动的日内和摆动交易者的可靠工具。 多货币和市场:凭借其可靠的精度,在不同的工具和市场上运作。 多个时间框架:可在多个时间框架上使用,性能良好。 稳定性:所有指标均不重绘、不重绘和不滞后,确保可靠的信号。 信号清晰度:提供箭头信号,用于清晰的入场和出场点。 实时警报:通过交易入场、SL和TP警报通知交易者
Supply and Demand Dashboard PRO
Bernhard Schweigert
4.8 (20)
目前八折优惠! 这个仪表板是一个非常强大的软件,可用于多个符号和多达9个时间段。 它是基于我们的主要指标(最佳评论:高级供应需求)。 Advanced Supply Demand 该仪表板提供了一个伟大的概述。它显示。   筛选后的供需值,包括区域强度评级。 区间内和区间外的点位距离。 它突出了嵌套的区域。 在所有(9个)时间段内,它对所选符号发出4种警报。 它是高度可配置的,以满足您的个人需求! 您的利益! 对每个交易者来说,最重要的问题是。 什么是入市的最佳水平? 在强大的供应/需求区域内或附近进入你的交易,以获得最佳的成功机会和风险/回报。 我的止损的最佳位置是哪里? 把你的止损放在强势供应/需求区的下方/上方是最安全的。 我的最佳盈利目标是什么? 你的退出策略和你的进入策略一样重要,了解更高的时间框架图可以帮助你。对于买入,使用下一个供应区作为目标,对于卖出,使用下一个需求区作为目标。在回撤到供应区或需求区时进场,以确保有足够的利润空间,达到更高的时间框架的供应和需求,将增加你的利润。 为什么我们要过滤强区和弱区? 不平衡性越大,价格的变动就
Super Signal – Skyblade Edition 專業級無重繪 / 無延遲趨勢信號系統,擁有卓越勝率 | 適用於 MT4 / MT5 在較低的時間週期上效果最佳,例如 1 分鐘、5 分鐘與 15 分鐘圖表。 核心特色: Super Signal – Skyblade Edition 是一套專為趨勢交易設計的智能信號系統。 其採用多重濾波邏輯,僅篩選出具有明確方向性、動能強勁且波動結構健康的走勢進場點。 本系統 不預測高點或低點 ,只有在同時滿足以下三項條件時才會觸發交易信號: 趨勢方向明確 動能持續增強 波動率結構穩定 此外,系統還結合市場流動性分析,以進一步提升信號的準確性與觸發時機。 信號特性: 所有箭頭信號皆為 100% 無重繪,無延遲 信號一旦出現即固定於圖表,不會閃爍或消失 提供圖表箭頭、資訊面板、彈出通知、聲音提示及推播訊息 支援 EA 呼叫(Buffer 輸出),可整合至自動化交易或信號跟單系統 提供預設參數模板,免調整即可使用,適合新手快速上手 總結: Super Signal – Skyblade Edition 是一款邏輯清晰、穩定高效的專業趨勢型
Legacy of Gann
Pavel Zamoshnikov
4.83 (12)
The indicator very accurately determines the levels of the possible end of the trend and profit fixing. The method of determining levels is based on the ideas of W.D.Gann, using an algorithm developed by his follower Kirill Borovsky. Extremely high reliability of reaching levels (according to K. Borovsky  - 80-90%) Indispensable for any trading strategy – every trader needs to determine the exit point from the market! Precisely determines targets on any timeframes and any instruments (forex, met
CRYSTAL HEIKIN ASHI SIGNALS MT4 Professional Trend Detection Indicator with Smart Entry Signals See the Trend. Catch the Move. Trade with Confidence. The professional Heikin Ashi indicator built for traders who want clarity, precision, and EA-ready signal automation. WHAT IS CRYSTAL HEIKIN ASHI SIGNALS? Crystal Heikin Ashi Signals is a professional-grade MetaTrader 4 indicator that combines pure Heikin Ashi candle visualization with an advanced momentum-shift detection system. Designed for both
Pytrader mt4 Python
Offpista LTD
5 (3)
通过简单的拖放EA将Metatrader 4与Python连接的文档。 完整的端到端解决方案,经过全面测试,快速,高效! Pytrader生态系统由python脚本和MT5或MT4 EA组成。 对于许可,还使用指示器。 python脚本和EA之间的通信基于套接字。 EA是服务器,而python脚本是客户端。 它始终是查询(函数/ python脚本)和输出(数据/服务器)。 EA不需要与运行python脚本的计算机相同。 在我们的Github链接上,您会找到python脚本,EA,完整的文档以及一个显示如何调用函数的Pytrader示例脚本。 如有疑问,我们还有一个不和谐频道。 在演示中(没有许可指示符)还具有全部功能,但适用于数量有限的乐器 (EURUSD,AUDCHF,NZDCHF,GBPNZD和USDCAD)。 下载EA =>这里 演示支持:EURUSD,AUDCHF,NZDCHF,GBPNZD和USDCAD Python MT5 EA插座连接器 比以往更轻松!通过简单的拖放式EA将Metatrader4与Python策略连接起来从未如此简单! 完整,快速的解决方案,经过
NextCandlePredictor No Repaint
Martin Alejandro Bamonte
NextCandlePredictor 指标 NextCandlePredictor 是一种带有警报的信号指标,不会重绘,不会改变颜色,不会移动,不会消失且没有延迟。它将帮助您识别任何时间框架内的下一个或即将到来的蜡烛的方向。高度推荐用于纽约、伦敦或甚至两者重叠等高波动市场。 主要特征: 时间框架的多功能性: 提供在任何时间框架内快速准确的信号,从 M1 到 H1 及更长时间。 清晰的买入/卖出信号: 使用 ADX 的 DI+ 和 DI- 线生成清晰的买入和卖出信号,确保您做出最佳的交易决策。 直观的可视化: 信号直接显示在图表上,绿色(买入)和红色(卖出)箭头,允许快速和轻松的读取。 可自定义的设置: 根据您的偏好和交易策略调整分析的柱数和警报选项。请根据您希望使用的 TF 查看下面的建议表。 即时和蜡烛收盘时的可选警报: 默认情况下,警报会在满足 ADX 条件的同一蜡烛上发出,确保信号的及时性。您还可以选择在当前蜡烛收盘时接收警报以获得更多确认。 快速性能: 设计为高效运行,理想用于高频操作和快速决策。 不重绘: 一旦信号发出,它将固定在当前蜡烛上,不会移动、改变颜色或消失。 无延
KURAMA GOLD SIGNAL PRO (MT4) — 7层过滤器XAUUSD完整交易系统 不重绘 不重画 不延迟 每个信号永久固定。 特典:购买终身许可证即可免费获得AI Zone Radar(价值$59)+ PDF使用手册。购买后请发送消息。 AI Zone Radar: https://www.mql5.com/en/market/product/175834 7 FILTERS 7个独立过滤器:波动率异常、MA结构、趋势方向、MA角度、高时间框架H4、RSI、突破阻断。大多数指标用1-2个过滤器。这个用7个。 3 FILTER LEVELS SAFE [S] — 最严过滤。STANDARD — 平衡。ACTIVE [A] — 更多信号。 QUALITY SCORE = 完美条件。 = 稳健设置。 = 条件不确定。 3 STEPS 1. 图表上出现箭头信号 2. 在面板上查看TP、SL、质量评分和风险回报比 3. 下单等待 SPECIFICATIONS 平台:MetaT
Full Scalping Signal
Leandro Bernardez Camero
FullScalping 是一个 不重绘、不后绘 的指标,专门设计用于在任何市场中生成 持续不断的剥头皮入场 。非常适合寻求持续行动的激进交易者! 加入频道以获取独家信息和更新: https://www.mql5.com/en/channels/forexnewadvisor 您会注意到它在 几乎每根K线 上都会给出信号,要么确认趋势,要么发出关键回撤信号。就像有一个雷达在不断引导您。 它是如何工作的?非常简单: 红色箭头 进入 卖出 交易。 蓝色箭头 进入 买入 交易。 始终沿着总体趋势方向交易,激进地瞄准 每笔交易15-20点 ,并在任何急剧的市场反转之前快速退出。 信号是 持续的 ,因此您永远不会用完交易机会。目标是使用以下方法执行 密集剥头皮 : 高仓位 低点差(显示在左下角) 宽止损,放置在最后一次趋势变化附近 您可以观看 实时交易视频 以查看其实际效果,但它非常简单,安装后即可使用。 它会重绘或后绘吗? 对于箭头式指标,最重要的问题之一是它是否会 重绘 或 后绘 。对于 FullScalping ,答案是明确的: 此指标 不会重绘 这意味着 信号在显示在
停止猜测,开始用统计优势交易 股票指数的交易方式与外汇不同。它们有固定的交易时段,隔夜会出现跳空,并遵循可预测的统计模式。这个指标为您提供所需的概率数据,让您能够自信地交易DAX、标普500和道琼斯等指数。 与众不同之处 大多数指标向您展示已经发生的事情。而这个指标向您展示接下来可能发生什么。每个交易日,指标都会根据100天的历史数据分析您当前的设置。它会找到具有相似跳空、相似开盘位置的日子,并准确计算价格到达关键水平的频率。不再猜测跳空是否会回补,或者昨天的高点是否会被测试。您将获得基于真实数据的精确百分比。 完整手册及所有参数说明请访问: https://www.mql5.com/en/blogs/post/766370 帮助您找到优质设置的策略指南: https://www.mql5.com/en/blogs/post/766371 搭配风险回报计算 + 快速交易管理按钮EA,轻松进行股指日内交易 - https://www.mql5.com/en/market/product/78020 MT5 Version:  https://www.mql5.com/en/market/
Volatility Trend System - a trading system that gives signals for entries. The volatility system gives linear and point signals in the direction of the trend, as well as signals to exit it, without redrawing and delays. The trend indicator monitors the direction of the medium-term trend, shows the direction and its change. The signal indicator is based on changes in volatility and shows market entries. The indicator is equipped with several types of alerts. Can be applied to various trading ins
作者的更多信息
Rira Renko
Vitor Palmeira Abbehusen
RENKO on Time Chart This indicator is an enhanced Renko, so you can watch the Renko bricks on the chart to understand price movement more clearly the other improvement is automated box size according to ATR (Average True Range) period you can set the ATR number as you want and the box size of Renko changes automatically based on price movement Inputs Mode: Box size is the input to specify the size of the Renko box you want to print on the chart. This input lets you choose the fixed box siz
Rira VWAP Bands
Vitor Palmeira Abbehusen
VWAP Bands gives you the regular Volume-Weighted Average Price and also the deviation bands. Use this indicator to see the possible amount of market movement, find support and resistance lines, find good spots for entry and exit,  and the most important feature is to find possible pivot points. This indicator has been mathematically improved by Rira team. The calculation begins at the start of each trading day
Patterns and Zones MTF
Vitor Palmeira Abbehusen
1 (1)
This indicator is a powerful assistant that shows bullish/bearish zones on the chart and the candlestick patterns that happen on any timeframe. It shows zones based on changes in price and 25 defined patterns which are shown as bullish or bearish on the chart after close of the candle, so there is no repaint. Also, you can select other timeframes in order to see the patterns happening on them. Patterns There are 25 defined patterns in this indicator. Eight patterns can be bullish or bearish, 8 p
Telegram MetaTrader Manager Pro Manage your account using this tool from Telegram. Features: Get currently open orders with optional filtering Close orders with optional filtering Track orders and get notified when orders open or close Open new buy/sell orders with optional parameters Limit the execution of telegram commands to specific users, so it can be used in groups safely How to use: To use Telegram API you have to add " https://api.telegram.org " in your MT4 Tools -> Options -> Expert A
Renko Bollinger Bands
Vitor Palmeira Abbehusen
Renko Bollinger Bands are Bollinger bands based on Renko boxes. You can see the free enhanced Renko indicator here . This indicator can be useful to get a better aspect of the price and deviation since it is based on Renko bars. Also the Main line of Bollinger Band is the SMA of Renko bars based on the Period in the inputs. Inputs: Box Size: Renko box size based on market Points. Period: Bollinger Bands Period Deviation: Bollinger Bands Deviation.
Currency Strength MA
Vitor Palmeira Abbehusen
Strength of 8 popular currencies (EUR, GBP, USD, CAD, AUD, NZD, CHF, JPY) is calculated from 28 pairs of Forex market following a Moving Average with custom period and method. You can use it by adding 2 indicators to the chart of Forex pair based on the pair currencies and use it as a confirmation on your strategies. Currencies: EUR, GBP, USD, CAD, AUD, NZD, CHF, JPY Inputs: Currency: 1 of the 8 currencies MA Period: Period of Moving Average MA Method: Method of Moving Average (SMA, EMA, SMMA
筛选:
无评论
回复评论