Renko Moving Average
- Indicateurs
-
Vitor Palmeira Abbehusen
 I've studied Electrical Engineering and MSc. in Telecommunications Engineering.
I started learning to code when I was a teenager starting with C and C++.
I learned coding for microcontrollers in University. - Version: 1.0
- Activations: 10
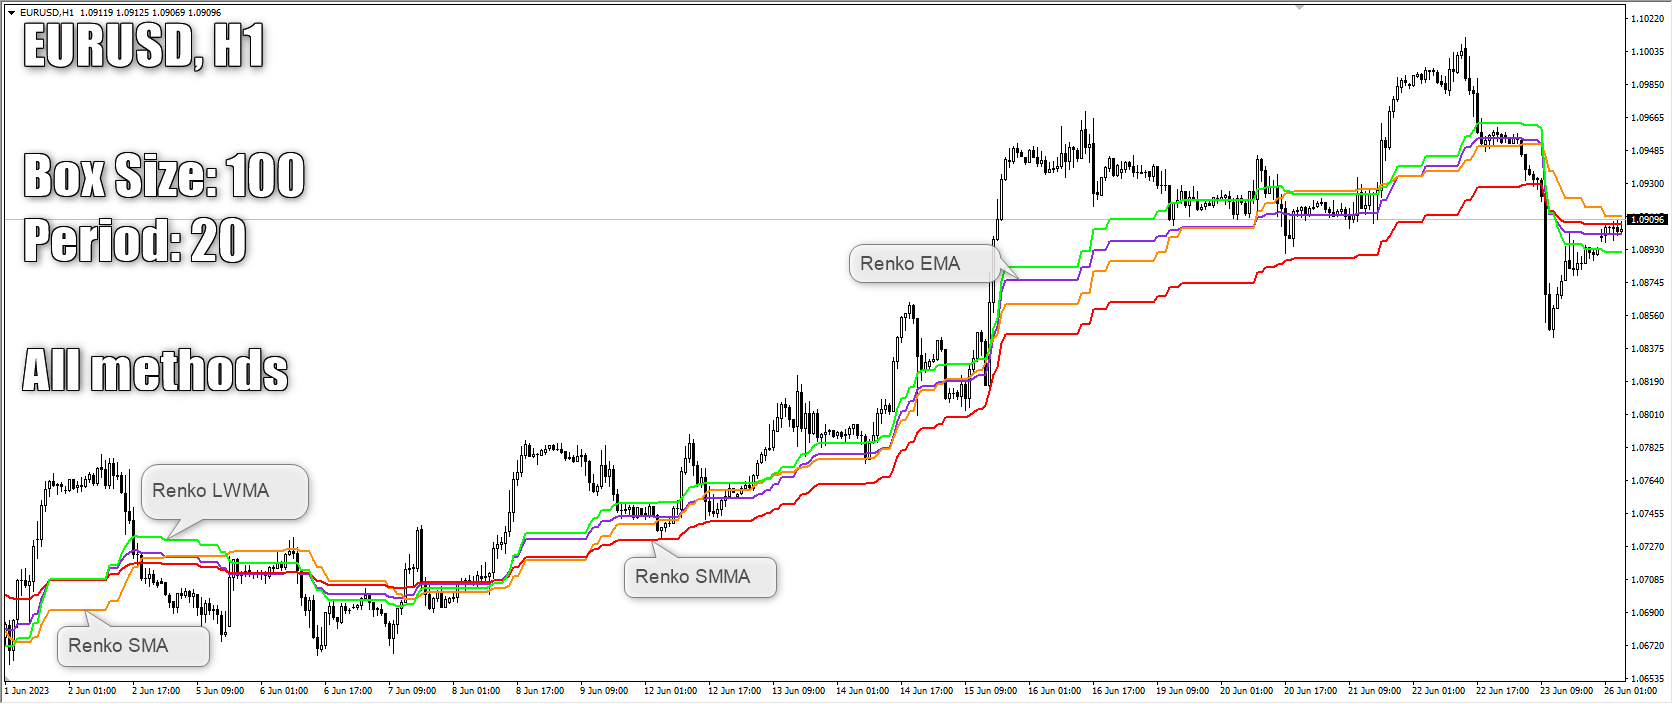
This indicator gives you the Moving Average based on Renko chart.
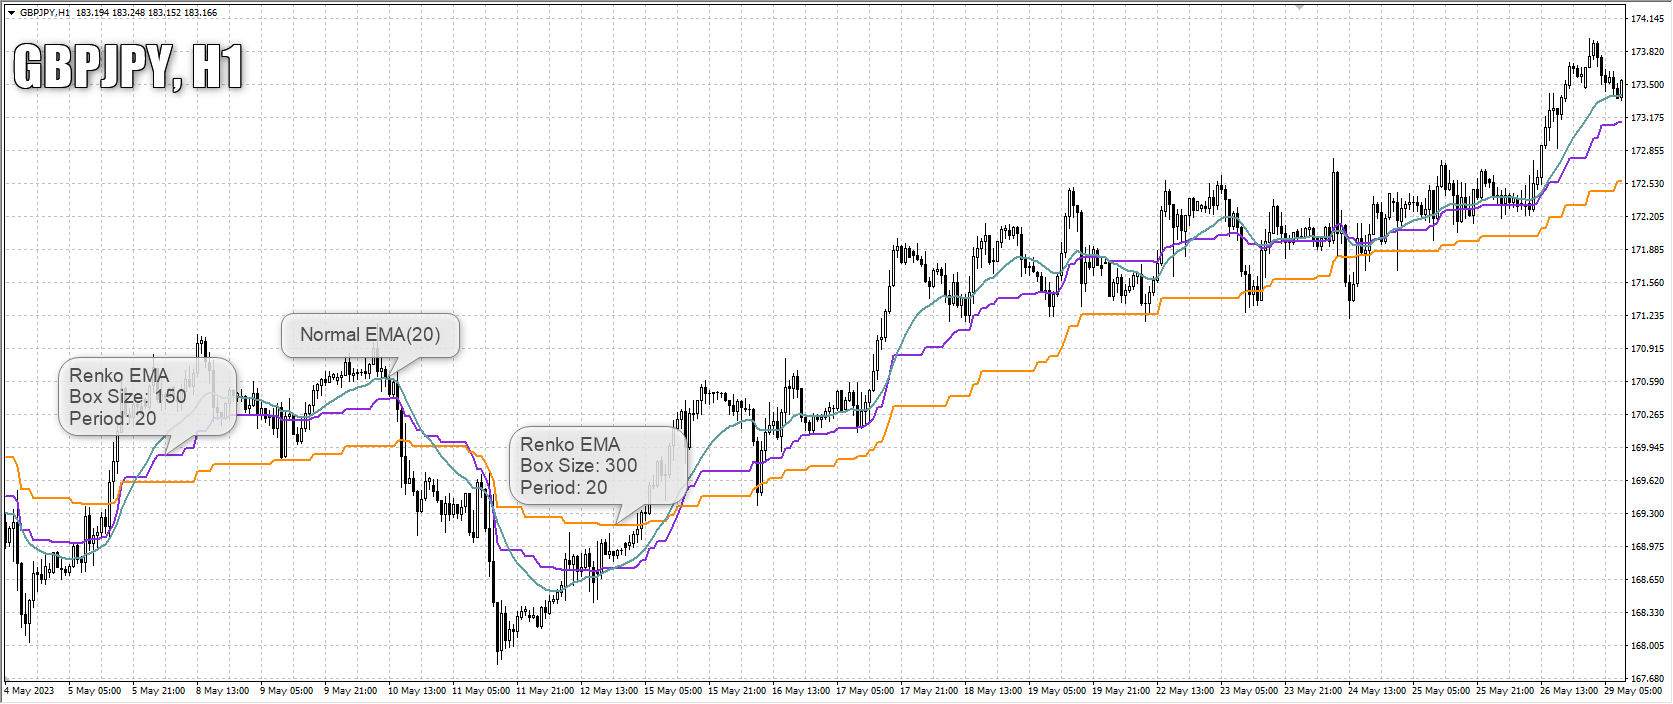
A Renko chart is a type of chart that is built using price movement rather than both price and standardized time intervals like most charts are.
A Moving Average based on Renko chart is considered less noisy since it is not based on the time and only based on price change.
You can see my free enhanced Renko indicator here.
Inputs:
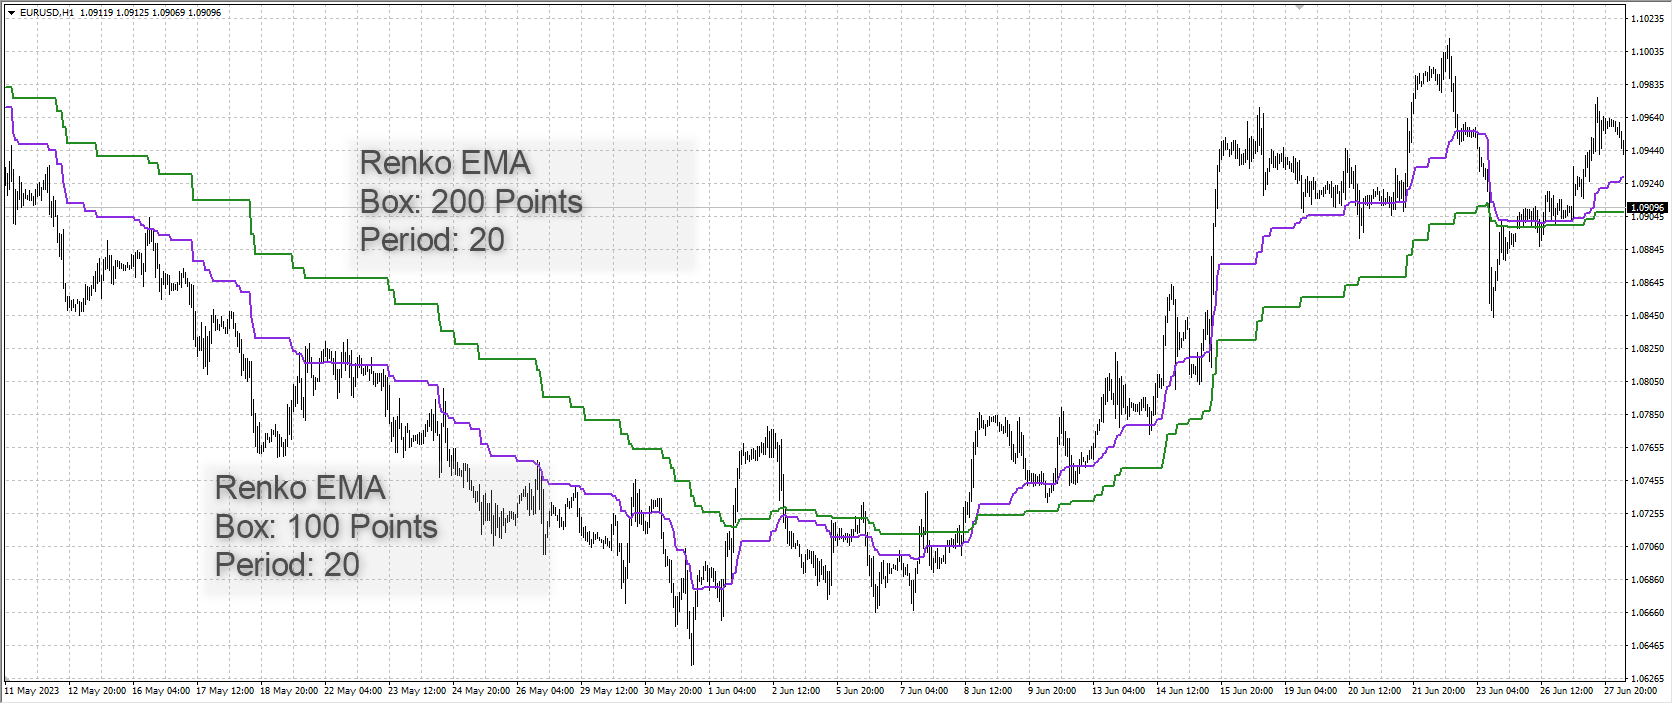
- Box Size: Renko box size based on market Points.
- Period: Moving Average Period
- Method: Moving Average Method (SMA, EMA, SMMA, LWMA)