 MetaTrader 5
 专家
专家
 指标
指标
 程序库
程序库
 实用工具
实用工具
 窗口小部件
窗口小部件
 规则
规则
适用于MetaTrader 5的免费技术指标 - 66
 技术指标的信号外汇和股票市场的开仓交易和平仓交易起着至关重要的作用。指标的本质就是一种交易品种的数学转换,旨在预测未来的价格变化。
测试技术指标可以更有利于预测市场行为并从中获利。
技术指标的信号外汇和股票市场的开仓交易和平仓交易起着至关重要的作用。指标的本质就是一种交易品种的数学转换,旨在预测未来的价格变化。
测试技术指标可以更有利于预测市场行为并从中获利。 
在交易中,时机不是优势——而是一切。 盈利交易与亏损交易之间的差距,往往只在几秒之间。
Candle Sentinel 通过实时显示当前K线距离收盘还剩多少时间,让你彻底掌控时间。 不再猜测。
不再盲目等待。
不再追高进场。 只剩下—— 纯粹的精准。 为什么交易者选择 Candle Sentinel Candle Sentinel 不只是一个计时器……
它是你的 决策武器 。 精确掌握K线收盘时刻
在最佳时机确认突破
避免因过早进场带来的假信号
在高波动市场中保持信心交易
在任何周期下提升交易精准度 智能动态时间显示 指标会根据当前时间周期自动调整显示格式: 低周期显示 秒(MM:SS) 日内周期显示 小时和分钟 日线周期显示 天和小时 月线周期显示 周和天 你始终看到 最清晰、最实用 的时间格式。 完全可自定义界面 将 Candle Sentinel 打造成你专属的交易风格: 更改文字颜色 调整字体大小 移动到图表任意位置 自定义线条颜色和粗细 适配深色或浅色主题 简洁美观。
专业质感。 为专业交易者而生 完美适用于: 剥头皮交易(短线)
FREE

BarX — 指定蜡烛图的最高价与最低价显示指标 BarX 是一款实用的技术指标工具,能够 自动标记当天某根特定蜡烛图的最高价与最低价 ,该蜡烛由用户自定义(例如, 蜡烛 0 表示 市场开盘后的第一根蜡烛图 )。 该指标对于使用 固定价格水平作为支撑位、阻力位、突破点或反转点 的交易者非常有帮助。BarX 通过在图表上 清晰标示关键位置 ,帮助交易者更快速地进行 技术分析与市场判断 ,提升操作效率与准确性。 BarX 可广泛应用于多种时间周期,支持多种交易策略,包括基于每日开盘行为或特定时间段内重复模式的策略。 无论是新手还是专业交易者都能轻松上手并受益。 支持多种时间周期与图表类型
轻量级设计,运行快速,界面简洁
适用于基于日内开盘行为或特定时间模式的策略系统 让 BarX 成为您日常交易中的 高效助手,提升精准度与市场清晰度 。
FREE
This indicator collects and systematizes the data about the spread. Its code was profiling several times and optimized in such a way that despite the presence of graphics not to slow down the work of the MT5 terminal. In addition, the indicator provides for the mode of complete invisibility (while the indicator continues to collect data and save it). Having returned to the visual display mode, you can see the work done by him.
Advantages and capabilities of the SpreadFix indicator: 1. Collects
FREE

*Used by MeditionSeed EA. Meditation is a practice in which an individual uses a technique – such as mindfulness, or focusing the mind on a particular object, thought, or activity – to train attention and awareness, and achieve a mentally clear and emotionally calm and stable state.[1][2][3][4][web 1][web 2] Plant a Meditation Seed to have wonderful future.
FREE
The Choppery notifier is an indicator that has been developed and tested for the purpose of alerting you that a candle is about to form, it takes away the trouble of having to play a guessing game as to when next a candle will form after a trend, therefore most of the time it eliminates the thought of having to predict which direction price will begin to move at. This indicator can be used in any timeframe, a notification will be sent out to you via email when price moves. you can start at a min
FREE

This indicator displays the Daily Range of a selected pair directly on your chart, providing a clear and concise view of the pair’s movement for the day. It simplifies tracking how far a pair has moved, offering traders a practical advantage in analyzing market activity. This feature is especially useful for making faster and more accurate trading decisions. Whether you’re a beginner or an experienced trader, it helps streamline your strategy by highlighting key market insights in real-time.
FREE

Привет. Сегодня представляем индикатор корреляции - SynchroWindowTomson. Индикатор в одном окне показывает движение нескольких инструментов, по отношению друг к другу, удобно определять направление и изменение, особенно когда вы работаете с целым портфелем разных инструментов и нужно определить какой из них тянет результат назад и движется в другую сторону. Так же видны точки разворота спреда.
FREE

The Market Thermometer can be used to help traders identify sleepy or turbulent periods. It helps beginners to check when is the ideal time to enter operations, that is, when the value of the thermometer is below its average for several periods, identifying a peaceful market. When the market is heated, that is, the thermometer is above three times its average, it is time to make profits. The Thermometer measures the extent to which the end of a period, maximum or minimum price, projects out
FREE

Description One Click Chart Changer is a lightweight and user-friendly MetaTrader 5 indicator that allows traders to switch between multiple trading symbols instantly with a single click. Designed for speed and convenience, this tool eliminates the need to manually search through the Market Watch window. With its modern floating panel interface, you can manage symbol switching directly from your chart. Key Features One-click instant chart symbol switching
Fully draggable floating panel
Sm
FREE
Это специальная утилита, для подключения внешнего индикатора к торговой панели . Она позволяет получать данные из буфера индикатора и рисует стрелочные объекты для передачи их в торговую панель. Входные параметры
Number of call buffer - номер индикатора для покупки Number of sell buffer -номер индикатора для продажи Indicator window - окно индикатора Indicator position in list - позиция индикатора в списке Default value of indicator - значения по умолчанию для индикатора Show information - показ
FREE

นี่คือคําอธิบาย Trend SAR Fusion PRO MT5 (เวอร์ชัน Stable) จากโค้ดที่คุณใช้
แนวคิดของอินดิเคเตอร์ อินดี้ตัวนี้ = รวม 3 อย่าง EMA10 (เร็ว) → จับโมเมนตัม EMA100 (ช้า) → จับเทรนหลัก SAR (จุดดอท) → ใช้เข้า/ออก สรุป: "ใช้ SAR เป็นตัวเข้า แต่ให้ EMA คัดกรองว่าเข้าเทรนจริงไหม" วิธีดูสัญญาณ (สำคัญสุด) เทรนขึ้น EMA10 > EMA100 จุด SAR อยู่ "ใต้ราคา" จะเห็น จุดเขียว
เข้า BUY ได้ เทรนลง EMA10 < EMA100 จุด SAR อยู่ "เหนือราคา" จะเห็น จุดแดง
เข้า SELL ได้ ช่วงเปลี่ยนเทรน ม
FREE
Quickview The Quickview indicator instantly highlights asset variations, delivering crystal-clear market insights at a glance. Effortlessly track multiple assets with visual simplicity, enabling quicker, smarter, and more confident trading decisions daily. ️ Key Features Real-Time Asset Tracking: Instantly monitor multiple assets simultaneously, never missing a critical market move. Flexible and Intuitive Display: Personalize your view, displaying assets exactly as you want—clear, concise, c
FREE
Hi Traders, RSI and Stochastic are among the most popular indicators used to measure momentum and help identify overbought and oversold conditions. This indicator displays two optional RSI and Stochastic values on your chart, helping you save chart space and keep things clean and organized. You can set your desired upper and lower thresholds for RSI and Stochastic to monitor conditions. If the RSI (or Stochastic) value is between the upper and lower thresholds, the text color will remain your de
FREE

AP HELPER LIGHT is a simplified version of the AP HELPER indicator for MT5. It displays support/resistance levels and a price projection line on the chart, which can be toggled on and off directly from the panel buttons. The compact info panel shows the current global H4 trend and the local trend, along with their strength as a percentage. The indicator helps quickly assess the price direction and the nearest key levels without cluttering the chart with unnecessary information.
For all question
FREE
Swap Monitor Indicator v1.0 by @marekfleisi Swap Monitor is a clean, lightweight MetaTrader 5 indicator that displays real-time swap values and open position swap data for the current symbol — directly on your chart. Whether you're a swing trader optimizing overnight holds or just want clear insight into swap costs and income, Swap Monitor gives you instant transparency on: LONG & SHORT swap values Color-coded swap profitability Open positions summary (including total swap profit/loss)
FREE

Moving Spread – 实时市场成本监控器 实时监控平均点差,避免在高成本时段交易。 该指标的作用是什么? Moving Spread 实时测量市场的 平均点差(以点数计) ,并显示其随时间的变化情况。对于希望了解何时入场成本过高(甚至在交易开始前就可能侵蚀利润)的交易者来说,这是一个必不可少的工具。 为什么这很重要?
高点差意味着您进出市场需要支付更多费用。该指标可帮助您识别这些时刻,并避免在成本过高的情况下进行交易。 工作原理 在单独窗口中 显示当前点差 ,红线代表平均值。 当点差超过预设阈值(例如 > 0)时,会 自动发出警报 。 非常适合剥头皮和日内交易者 ,因为它有助于避免因“滑点”(持续亏损)造成的隐藏损失。 真实案例 如附图所示,不同资产和时间周期下的点差行为各不相同: 黄金 (XAUUSD) 1分钟 非常稳定,只有两个主要数值。非常适合剥头皮。 白银 (XAGUSD) 1分钟 变化较多,但有清晰的模式。需要密切关注。 铂金 (XPTUSD) 1分钟 完全不稳定。不建议进行快速操作。 ️ 注意: 该模式会随时间周期而变化。例如,日线级别
FREE

If you like this product, please give it a 5 star rating as a token of appreciation.
This indicator plots horizontal lines on the chart representing the previous year’s high and low prices . These levels are widely used in technical analysis as major support/resistance references.
Automatically identifies the previous calendar year’s high and low . Plots horizontal lines on the chart at these levels. Customizable color, width, and style of the lines. Deletes lines on deinitialization. Updates
FREE
This indicator is able to determine the price levels at which there was the most volume for the specified period of history. In the future, the price often bounces off such levels, and this can be successfully applied in trading. They are displayed as lines, some parameters for determining the levels can be adjusted. This indicator is simple, therefore, it does not report signals, and only builds levels on EUR/USD. Parameters
HistoryBars - the number of bars to determine the near volume levels;
FREE
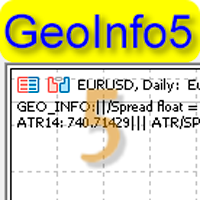
GeoInfo5 是信息量最大的指标之一,它以简洁的形式显示交易工具的基本信息。 Meta Trader4终端的版本在交易者中广受欢迎。 该指标是免费的,将永远是免费的。 推出版本现在也可用于MetaTrader5。
在图表左上角的行中以简短的形式显示有关工具主要参数的信息: 价差,交换买入订单,交换卖出订单,当前价差,抵押品(保证金),蜱虫大小,停止水平,订单冻结水平。 信息显示基于一个手和点。
信息以如下形式输出: Spread ... = 23 pips /SWAP B:4.200 /S:-8.470 /MRG:256.0/TCV:0.10/STL:0/FRL /MinLot:0.1
已经介绍了关于周期的平均范围和周期/点差的比率范围的信息的显示,这允许您选择在这些市场条件下最有效操作的最佳时间框架。 数据以格式呈现: ATR14:906.786///ATR/SPR:3.956 如果 ATR/SPR 比率较小,则选择更高的时间框架以实现更高效的操作可能是有意义的。 对于紧急工具(期货),到期日以以下格式显示: Exp Date:2022.02.18 参数: ShowSym
FREE
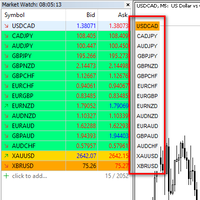
I want to quickly view the chart, so I created a small tool. I hope it can help you. Functions:
Use up/down arrow keys or mouse clicks to quickly open charts for currency pairs. Use left/right arrow keys to change the timeframe of the current chart. Automatically update the order based on the Market Watch
If you have any request or errors please tell me to help it better.
Donate us , Thank u!
Telegram: 0388894014
FREE

Displays previous months Highs & Lows. You can set the number of months to display levels for, also the line style, color and width. This is very useful for traders using the BTMM and other methods like ICT. I'll be creating more indicators for MT5 for the BTMM. Send me your suggestions to my Telegram: https://t.me/JDelgadoCR Take a look at my other products at: https://www.mql5.com/en/users/jdelgadocr/seller
FREE
The Market Thermometer can be used to help traders identify sleepy or turbulent periods.
It helps beginners to check when is the ideal time to enter operations, that is, when the value of the thermometer is below its average for several periods, identifying a peaceful market. When the market is heated, that is, the thermometer is above three times its average, it is time to make profits. The Thermometer measures the extent to which the end of a period, maximum or minimum price, projects outsid
FREE

Simple Moving Average (SMA) Indicator The Simple Moving Average (SMA) is one of the most fundamental and widely used tools in technical analysis. It provides a clear visual representation of the market trend by smoothing out price fluctuations over a specified period. Unlike the Exponential Moving Average (EMA) , which reacts more quickly to recent price changes, the SMA gives equal weight to all price points in the calculation, making it ideal for identifying long-term trend direction and re
FREE

CyberLab Goal Matrix is a premium, single-chart risk intelligence panel engineered for MetaTrader 5. Built specifically for disciplined manual traders, this institutional-grade workspace completely eliminates the need to constantly cycle between multiple timeframes. It streams macro-momentum trend direction while executing real-time position scaling, friction calculations, and target mapping directly onto your active execution screen.
--- THE REALITY OF TRANSACTION FRICTION --- Many retail
FREE

(Special New Year promotion - free price!) The indicator displays the actual 'Scale in points per bar' (identical to the manual setting in the Terminal, see screenshot)
in the upper right corner of the chart.
The displayed value changes INSTANTLY whenever the chart scale is changed! (This is very convenient when planning screenshots).
In Settings: Change language (Russian/English), font size of the displayed text, text label offset coefficient from the graph corner, equally in X and Y directi
FREE

Hey guys.
This indicator will show you, in the volume histogram, if the candle was a Doji, a bullish candle, or a bearish candle.
The construction of this indicator was requested by a trader who uses other indicators from my catalog, and I decided to release it free to help traders who think that the indicator can contribute to their operations.
The parameters are:
Volume Type: Real Volume or Tick Volume. Color if the candle is bearish: select the color. Color if the candle is high: select
FREE
Hi Traders, The THV EMA Distance Monitor is a lightweight and flexible MT5 indicator designed to display the real-time distance between price and multiple Exponential Moving Averages (EMA) directly on the chart. The indicator allows traders to enable or disable up to five EMAs, each with a customizable period, making it adaptable to different trading strategies and market conditions. For each selected EMA, the distance from the current price is calculated and displayed in a clear on-chart panel.
FREE

Not everyone can write an indicator. But anyone can have an idea. The indicator Universal Separate Window Free MT5 , which takes as an input parameter the formula by which the indicator line will be drawn, will help to implement it. This indicator is intended for use in the separate chart window.
All indicators of the series Universal :
Main window Separate window Free MT4 Universal Main Window Free MT5 Universal Main Window Free MT5 MT4 Universal Separate Window Free MT5 Universal Separate Wi
FREE

Automate Your Strategy! Use the Daily Drop Analyzer Expert Advisor to automatically execute the strategy, with configurable filters, parameters, and order management.
Check it out here: Daily Drop Analyzer EA
The Step Analysis Indicator performs an automated backtest of a simple daily strategy: buy when the price drops a certain percentage from the previous close and sell at the same day's close (or vice versa for short strategy). It tests multiple entry percentages ("steps") and displays the
FREE

This indicator is an utility for have always under control, how much time is left at the end of the bar setted.
The utility show on the lower right of the chart, the countdown to the end.
When the remaining seconds is = to the seconds set in the input, the color of remaining seconds on chart, change color and play a warning sound to warn you that the bar is about the end. When the remaining seconds is < to the seconds set in the input, the utility play a beep to warn you that the bar is in co
FREE

Take control of your trading workspace with the Switcher Dashboard – a smart and efficient tool that auto-detects all open charts (Forex, VIX, stocks) and turns them into neatly organized, color-coded buttons for instant chart switching. Key Features: One-click chart navigation – Seamlessly switch between charts with a single click. Trend visualization – Instantly identify bullish or bearish conditions with clear color cues. Flexible layout options – Choose from 4 customizable views (left, righ
FREE

----------------------------------------------------------------------------------------------------------- 適用於EurTrendSniper的趨勢指標,請下載並放置於MT5的Indicators資料夾內。
交易中的一個關鍵要素是做出買賣交易工具決定的區域或水平。儘管主要參與者試圖隱藏他們在市場中的存在,但他們不可避免地會留下痕跡。我們的任務是學習如何識別這些痕跡並正確解釋它們。 指標說明:
看漲訊號: 價格 (K線) 處於帶狀色塊上方 、 帶狀色塊 為紅色(或從綠變紅) 、 延展線處於看漲狀態 、 快慢線黃金交叉。 看跌訊號: 價格 (K線) 處於 帶狀色塊 下方 帶狀色塊 為綠色 (或從紅變綠) 、 延展線處於看跌狀態、快慢線死亡交叉。
FREE
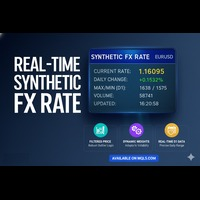
实时合成外汇汇率 (Real-Time Synthetic FX Rate) 实时合成外汇汇率 是一款高级指标,旨在为您的交易商(Broker)提供的任何货币对(包括主要、次要和外汇套利对)计算 稳健的合成汇率估值 。 其目标是提供一个 动态参考值 ,反映 每分钟的价格形成 过程,在官方汇率公布或机构验证之前,提供一个指导性的参考。 工作原理:稳健的混合模型 该指标通过结合三个关键组成部分来生成其合成值,并使用 动态权重 根据 市场波动性 进行自动调整: 成交量加权平均价格 (VWAP): 对成交量最大的价格水平赋予更高的权重,反映了买卖双方的真实市场共识。 截断均值 (Trimmed Mean): 自动排除极端价格或错误报价 ( outliers ,即异常值),确保参考值干净且稳定。 近期平均价格: 使合成汇率与最新的价格行为保持一致,避免过度滞后。 与官方汇率的区别 官方汇率: 通常每天计算一次,基于货币当局清算和验证的银行间交易。它代表一个 历史性 的参考值。 合成外汇汇率: 利用您交易商市场上的 实时数据 ,生成一个 分析性、估算而非官方 的值。 这个合成汇率充当一个 预先参考
FREE

A simple indicator showing the size of the spread at the current time, the maximum for the day and the maximum for the entire duration of the indicator.
Daily statistics of the maximum spread are also displayed, indicating the time when this spread was fixed.
The location of the display of the received information can be changed depending on your preferences and positioned anywhere on the screen.
It is possible to output alerts about exceeding the size of the spread specified in the input pa
FREE

A simple and highly effective Strength and Weakness currency indicator that can be used to aid your fundamental and technical analysis for winning trade decisions.
The indicator is very easy to use and can be applied to all time frames.
FX Tiger uses an advanced algorithm to calculate a score table for all major currencies. Green indicates currency strength and red indicates currency weakness. Once you have identified the strong and weak currencies, pair strong versus weak currencies and comb
FREE
Индикатор отображает изменение баланса В правом нижнем углу окна.
Отображаются следующие периоды Сегодня Вчера 3 дня Неделя 10 дней Месяц 3 месяца Полгода Год Все время Есть возможность выставить расчетное время. Удобно пользоваться для расчетов прибыли/убытков с определенного часа.
Будет полезен например ночным скальперам. Данные совпадают с расчетами отчета в терминалее.
FREE

The Time End bar by MMD is a simple indicator that shows the number of seconds remaining in the three selected intervals. According to the MMD methodology, the moment when a directional price movement occurs is important. This indicator allows you to use this relationship more effectively in Forex and Futures trading.
Functionality description:
Time Frame 1 Period - defining the first time interval Time Frame 1 Color - specifying the color for the first time interval Time Frame 1 Period - def
FREE

Индикатор SpreadTimeInfo
Многофункциональный индикатор для отслеживания времени сессий, спреда и торговых инструментов.
Основные возможности Отображение времени до открытия/закрытия Американской сессии Таймер обратного отсчета до закрытия текущей свечи Мониторинг спреда с визуальным предупреждением Русскоязычные названия более 100 торговых инструментов Автоматический учёт выходных и праздничных дней
Настройки индикатора
### Американская сессия - Время открытия NY (в вашем времени)
FREE

An improved version of the standard Standard Deviation indicator.
It is now a responsive and smoothed line.
The setup is not straightforward - but I hope you can do it.
It is very easy to understand the readings of this indicator, the meaning is the same as that of the usual Standard Deviation.
//////////////////////////////////////////////// ///////////////////////////////////
I hope this indicator will be very useful to you in successful trading.
Good luck.
FREE

Добрый день. Сегодня добавили вспомогательный индикатор тренда DveMashkiTompson, идея взята из аналога МТ4 и перенесена на МТ5, используется совместно с индикаторами Тренда ТМА и МА, рисует красные и зеленые области в зависимости от направления рынка. Тренд вверх -зеленые области, тренд вниз -красные.Области основываются на пересечении индикатора МА, таким образом данный индикатор дает информацию графического содержания для более быстрой оценки ситуации и принятия решения.
FREE
RCH FX Spread + Bar Close Countdown Indicator
What This Indicator Does
A simple, professional tool that displays real-time spread information and bar closing countdown directly
on your MT5 charts.
Key Features
• Real-time spread display - Shows current spread in pips or points
• Bar close countdown timer - Exact seconds remaining until current bar closes
• Customizable alerts - Audio notification before bar closes
• Fully adjustable display - Position, colors, fonts, and sizing options
• Works o
FREE

Display the date, time and price according to the movement of the mouse cursor on the chart This is useful for discretionary trading.
It is an indispensable tool for verifying and studying past market prices and trades. Characteristic Date,Time and Price are displayed.
The value follows the movement of the mouse.
You can change the color of the text. Please refer to the video on youtube. For MT5 only.
FREE

趋势冲击通道 指标是一个先进的技术分析工具,基于价格冲击和波动率创建动态趋势通道。它将ATR(平均真实范围)与自适应算法相结合,生成精确的趋势识别信号。 主要功能: 自适应趋势线 :基于波动率以智能步长跟随价格 动态通道 :上下带自动适应市场条件 重测信号 :三角形标记显示重要的支撑/阻力重测 趋势步进信号 :每个新趋势步骤的圆形标记 翻转保护 :通过可调整的持有期防止过度趋势变化 参数设置: 触发阈值 (2.86) :趋势翻转的阈值(ATR乘数) 最大步长 (-0.034) :每次移动的最大步长 带宽乘数 (2.02) :波动率带的宽度 趋势持有 (0) :下次趋势翻转前的最小K线数 应用场景: 完美适用于波段交易、趋势跟随策略以及识别进场和出场的关键区域。 信号解读: 绿色趋势线和通道表示看涨动量 红色趋势线和通道表示看跌动量 三角形信号标记通道边界重测 圆形信号标记结构性趋势推进 技术特点: 基于200周期ATR的波动率计算 智能步长调整算法 可自定义的视觉显示选项 多重信号确认机制 使用建议: 在趋势明确的市场中效果最佳 结合其他指标进行信号确认 根据不同时间框架调整参数 注
FREE

朋友们好,这是MT5终端的更新版本。 这是我在第一个指标基础上开发的新产品,是为黄金优化的精简版本,没有多余的设置。 该指标支持发送通知。 使用建议: 交易品种 - XAUUSD (主要品种,已为其优化) 交易品种 - XAUEUR (次要品种,未为其优化,但结果令我满意) 图表周期 - H4。 将指标加载到图表上即可,无需任何操作。 买入信号 - 蓝色箭头。 卖出信号 - 红色箭头。 可作为寻找入场点的主要来源。 止损: 黄色点 - 建议遵循它们。 使用场景: 预测下一根K线的方向和收盘价。因此,当收到信号时,平仓时间应以您收到信号的那根K线的收盘为准。 止盈: 止盈是酌情设置的,但总比没有好。如果您不知道在哪里设置止盈或平仓,请参考最后一根已收盘K线的最高/最低点。 简洁明了,没有多余的东西。 可用指标设置: SL - 基于ATR指标的建议止损,我推荐参考它,因为它表现良好。 TP - 基于ATR指标的建议止盈。 TextFontSize - 图表上显示文本的字体大小。 Font_style - 图表上显示文本的字体样式。 btext
FREE
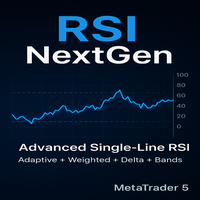
RSI NextGen Advanced RSI Indicator
The RSI NextGen is an advanced and modernized version of the classic Relative Strength Index (RSI). It comes with enhanced features that deliver far more accurate and reliable signals across different market conditions. This indicator has been designed to provide traders with a dynamic and adaptive view of overbought and oversold zones, instead of relying on the static and rigid settings of the traditional RSI.
Unlike the standard RSI, which is calculated us
FREE

VWAP (Volume Weighted Average Price) indicator with ±1σ and ±2σ bands calculated from real traded volume and tick volume too for forex The start and end times of the session are fully configurable, as well as the standard deviation levels and the number of bands displayed. It shows the day’s volume-weighted average price and helps traders identify value areas, price extremes, and intraday trading opportunities with precision.
FREE

IDNR4 — Indicator Description (English)
The IDNR4 (Inside Day Narrow Range 4) is a volatility-compression pattern that identifies potential breakout conditions. It combines two concepts: NR4 (Narrow Range 4)
The current bar has the smallest high–low range compared to the previous three bars. Inside Bar (ID)
The current bar’s high and low are fully contained within the range of the previous bar. Signal Logic
• When the bar is NR4 only , it is highlighted as a normal contraction pattern.
• Wh
FREE

停止猜测,开始精准交易。
QTS Super Hybrid Platinum 不仅仅是一个指标,它更是一套完整的交易系统,专为追求精准和安全的短线交易者和日内交易者而设计。该工具结合了机构价格行为 (SNR) 和趋势动量 (三重 EMA) 的强大功能,过滤掉市场噪音,只为您提供高概率的交易机会。
为什么选择 QTS Super Hybrid Platinum?我们开发这款工具旨在解决交易者面临的三大难题:虚假信号、过度交易和错失良机。
白金版功能:
自动趋势和 SNR 逻辑:自动识别“大玩家”趋势(高时间框架偏好),并为您绘制关键支撑/阻力位。
移动推送通知:再也不会错过任何交易机会!当出现有效信号时,您的手机将立即收到提醒(“叮!”)。随时随地,轻松交易。
幽灵目标系统(自动止盈/止损):不知道在哪里退出?该指标会根据波动率(ATR)自动绘制“幽灵线”来设置止盈和止损点。
️ 智能过滤器(防陷阱):
RSI 过滤器:防止在顶部买入或在底部卖出。
波动率计:在市场横盘整理或剧烈波动时发出警告。
K 线计时器:使用精准的倒计时器避免假
FREE

Fibonacci Path Profile for MetaTrader 5 Overview Fibonacci Path Profile is a price-action analysis indicator designed to study how historical market swings develop after an ABC price structure forms. Instead of relying exclusively on fixed Fibonacci retracement levels, it examines comparable historical swing sequences and uses their subsequent price paths to build a forward-looking distribution of potential market movements. The objective is to provide traders with a structured way to evaluate p
FREE

JT360 VWAP V1.21 – Daily, Weekly & Monthly VWAP for MetaTrader 5 Precise VWAP Analysis Directly on Your Chart JT360 VWAP is a professional chart indicator for MetaTrader 5 that displays Daily, Weekly, and Monthly Volume Weighted Average Price (VWAP) levels. It also includes three pairs of daily standard deviation bands to help traders assess price position and deviation from the daily VWAP. Key Features Daily VWAP: Displays the volume-weighted average price for the current trading day. Weekly VW
FREE

This indicator is based on the logic of accumulation, manipulation, and liquidity in the European and US markets. It monitors the first hour of trading and displays an entry zone—specifically the high, the low, and the 50% mark of the candle body. The zone and line are removed after two touches, as they are no longer valid. It helps me determine the technical trend direction and potential reversals. I use it in combination with my other indicator and a supply and demand level indicator.
FREE

这不是又一个画区域却让你猜测的结构指标。 Smart Structure Concepts 为你阅读市场 — 在 XAUUSD(黄金)、外汇、指数、加密货币以及任何其他市场 实时标记 Smart Money Concepts (SMC / ICT) 结构。忘掉进入输入参数来配置每个区域:通过其 图表上的交互式仪表板面板 ,你只需一键即可决定显示、隐藏或调整内容 — 无需打开属性,无需重启指标。 此工具是 MetaTrader 5 不断扩展的指标和面板系列的一部分 — 所有工具都配有 11 种语言的教育性工具提示,并在每个图表中内置可视化导师。 每个工具都在你交易时教你:将鼠标悬停在任何区域、信号或水平上,解释会直接出现在图表上。没有黑匣子,没有盲目下单。你在交易中学习。 在此发现完整产品线: https://www.mql5.com/en/users/09151993a/seller
问题: 手动绘制和标记市场结构是最让交易者疲惫的事,无论是新手还是有经验者。每次切换图表或时间框架,都必须重新开始 — 标记区域、画线、手动识别 BOS 和 CHoCH — 一次误读就可能毁掉一个好的设
FREE

Strong Fade Signals for MetaTrader 5 Overview Strong Fade Signals is a price-action indicator designed to identify potential reversal opportunities when price becomes unusually extended relative to its volatility-adjusted reference level. Strong directional moves can carry price far beyond its typical range. When that extension begins to lose momentum, the market may offer an opportunity for a countertrend move toward the reference level or a broader mean-reversion target. The indicator combines
FREE

Set your risk before you place a trade. RiskLot shows the lot size as you move Entry, Stop Loss, and Take Profit on your MT5 chart. It is a calculator, not a trading robot. It does not open, change, or close orders. Choose risk as a percentage of balance, a percentage of equity, or a fixed cash amount. Move the Entry, Stop Loss, and Take Profit lines on the chart. See money at risk, potential reward, and the reward-to-risk ratio in one panel. Check the price distance and current spread before pl
FREE

Sweep Reversal Map for MetaTrader 5 Overview Sweep Reversal Map is a multi-timeframe price-action indicator designed to identify potential reversals following liquidity sweeps. Markets frequently move beyond established swing highs or lows before reversing back through the swept level. These moves can trap breakout traders and may indicate that price is rejecting the breakout area. The indicator analyses this sequence through three key stages: liquidity sweep, reclaim, and market structure confi
FREE
Alert for the lines This is an MetaTrader 5 indicator that **detects price crosses with any horizontal line you draw directly on the chart**. No need to manually input levels — simply draw a horizontal line using MT5’s built-in tool, and the indicator does the rest.
**How it works:**
1. **Draw a horizontal line** on your chart using MT5’s native tool (Insert → Objects → Horizontal Line). 2. The indicator **monitors the Bid price in real time**. 3. **Only 1 alert per line per candle** is s
FREE

The "MA Gaussiano" indicator is a custom tool for MetaTrader 5 (MQL5) that combines a Gaussian Moving Average with colored trend candles, designed to identify market trends in a visual and innovative way. It was developed with xAI assistance in 2025 and focuses on providing a smooth and sensitive representation of prices, ideal for traders looking to filter noise in charts of currencies, stocks, or cryptocurrencies. Main Components: Gaussian MA (Colored Line): Plots a line representing the Gauss
FREE
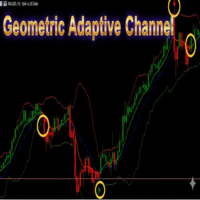
Geometric Adaptive Channel MT5 By Grok(xAI)
*A next-generation adaptive channel based on multiplicative geometry and spectral analysis using the Discrete Fourier Transform (DFT).* NOTE: The MA Gaussiana indicator is also shown in the screenshots. ---
### What Is It and How Does It Work? **Geometric Dynamic Channel MT5** is an **innovative channel indicator** that **does not use moving averages, RSI, MACD, or ATR**. Instead, it applies **advanced geometric calculations** on log-scale price
FREE
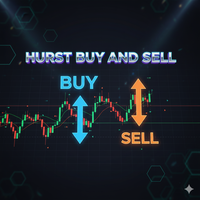
Hurst Buy and Sell This innovative indicator, inspired by xAI Grok intelligence, uses the Hurst exponent to identify the nature of the market and generate buy/sell signals. The EA for this indicator (Hurst Razer PRO EA MT5) is now available, you can see it by clicking here! https://www.mql5.com/es/market/product/153441?source=Site+Profile+Seller If you want more signals from the indicator, change the minimum number of bars between consecutive signals. The lower the value, the more signals it
FREE
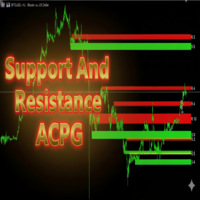
Support And Resistance ACPG Indicator
The Support And Resistance ACPG Indicator (developed by Grok by xAI) is an advanced tool for the MetaTrader 5 (MQL5) platform, designed to identify and visualize support and resistance zones on a price chart. Unlike traditional support and resistance indicators, the ACPG method combines a dynamic approach based on swing points, volatility analysis using the Average True Range (ATR), and an adaptive clustering system to detect high-relevance zones in the
FREE
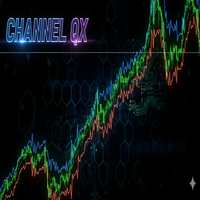
Channel QX The EA (Hurst Razer PRO EA MT5) is now available, you can see it by clicking here! https://www.mql5.com/es/market/product/153441?source=Site+Profile+Seller Channel QX combines trend analysis with dynamic volume-based adaptation to provide accurate signals in highly volatile markets.
Key Features
Dynamic Volume Adaptation Automatically adjusts channel width based on tick volume momentum Responds instantly to changes in market activity Prevents false signals duri
FREE

Volume Profile Horizon Where Volume Concentrates. Manual ranges. Daily volume profiles. Multiple market periods on one MetaTrader 5 chart. Volume Profile Horizon is an interactive fixed-range volume analysis indicator for MetaTrader 5. It converts available broker tick-volume data into a horizontal distribution across price levels, helping traders examine where estimated market activity was concentrated within a chosen period. Instead of applying a single profile to an entire chart, you decide p
FREE

Apex Fibonacci Precision in Every Level. Automatic or manual Fibonacci ranges. Multi-timeframe price levels. Custom retracement zones and optional alerts for MetaTrader 5. Apex Fibonacci is an interactive Fibonacci analysis indicator designed to make price retracements and extensions easier to examine on the chart. It combines a rolling automatic range, manual A/B anchors, selectable Fibonacci levels, multi-timeframe overlays, colored retracement bands, and price-interaction notifications within
FREE

Supply and demand zones for MetaTrader 5, with zone-touch alerts. SMC Nexus Supply Demand finds swing highs and lows on the current timeframe and turns them into supply and demand zones sized by volatility (ATR). Every zone carries a point-of-interest (POI) mid-line, a broken zone leaves a short POI history line, and an alert tells you when price comes back to a zone. Everything is calculated on closed bars: once a bar has closed, the zones, breaks and alerts on it do not change. What you get Su
FREE

Opening Lines VT draws horizontal lines at the opening price of up to 8 configurable trading sessions, so you can see where each session began directly on your chart. Features 8 session lines with freely adjustable times and colors Touched filter: historical lines disappear once price has touched them (threshold adjustable in the inputs) Today’s lines are solid, historical lines are dashed Time labels at the end of each line High and low of the visible chart range as dotted lines Automatic time
FREE

GT MiniCharts Panel for MT5 — Ultimate Multi-Timeframe Precision at Your Fingertips! Supercharge your technical analysis and market execution with the GT MiniCharts Panel — an ultra-slick, high-performance canvas tool built for traders who demand absolute clarity across every timeframe! Why Traders Love It: Instant Multi-Timeframe Alignment : Track price action simultaneously from M1 to Monthly on a single clean, high-resolution canvas panel. Ultra-Smooth Drag & Drop : Drag th
FREE
MetaTrader市场是独有的自动交易和技术指标商店。
阅读MQL5.community用户备忘更多地了解我们提供给交易者的独特的服务:复制交易信号,自由职业者开发的自定义应用程序,通过支付系统完成的自动付款和MQL5云网络。
