Fibonnaci path profile
- 指标
-
Shipra Gupta
 我是 Shipra Gupta,一名交易员和量化策略开发者,拥有扎实的数学、经济学以及算法交易系统背景。多年来,我长期专注于外汇、黄金、指数、大宗商品及加密货币市场,致力于构建以数据驱动、强调稳定性、精准度与纪律执行的交易策略。
我的专长包括开发 MetaTrader 5 Expert Advisors(EA)、量化交易模型、剥头皮交易系统、趋势跟随算法、波动率策略以及风险控制自动化框架。我开发的每一个系统都基于市场结构分析、统计研究、历史回测、优化以及真实市场验证。 - 版本: 1.0
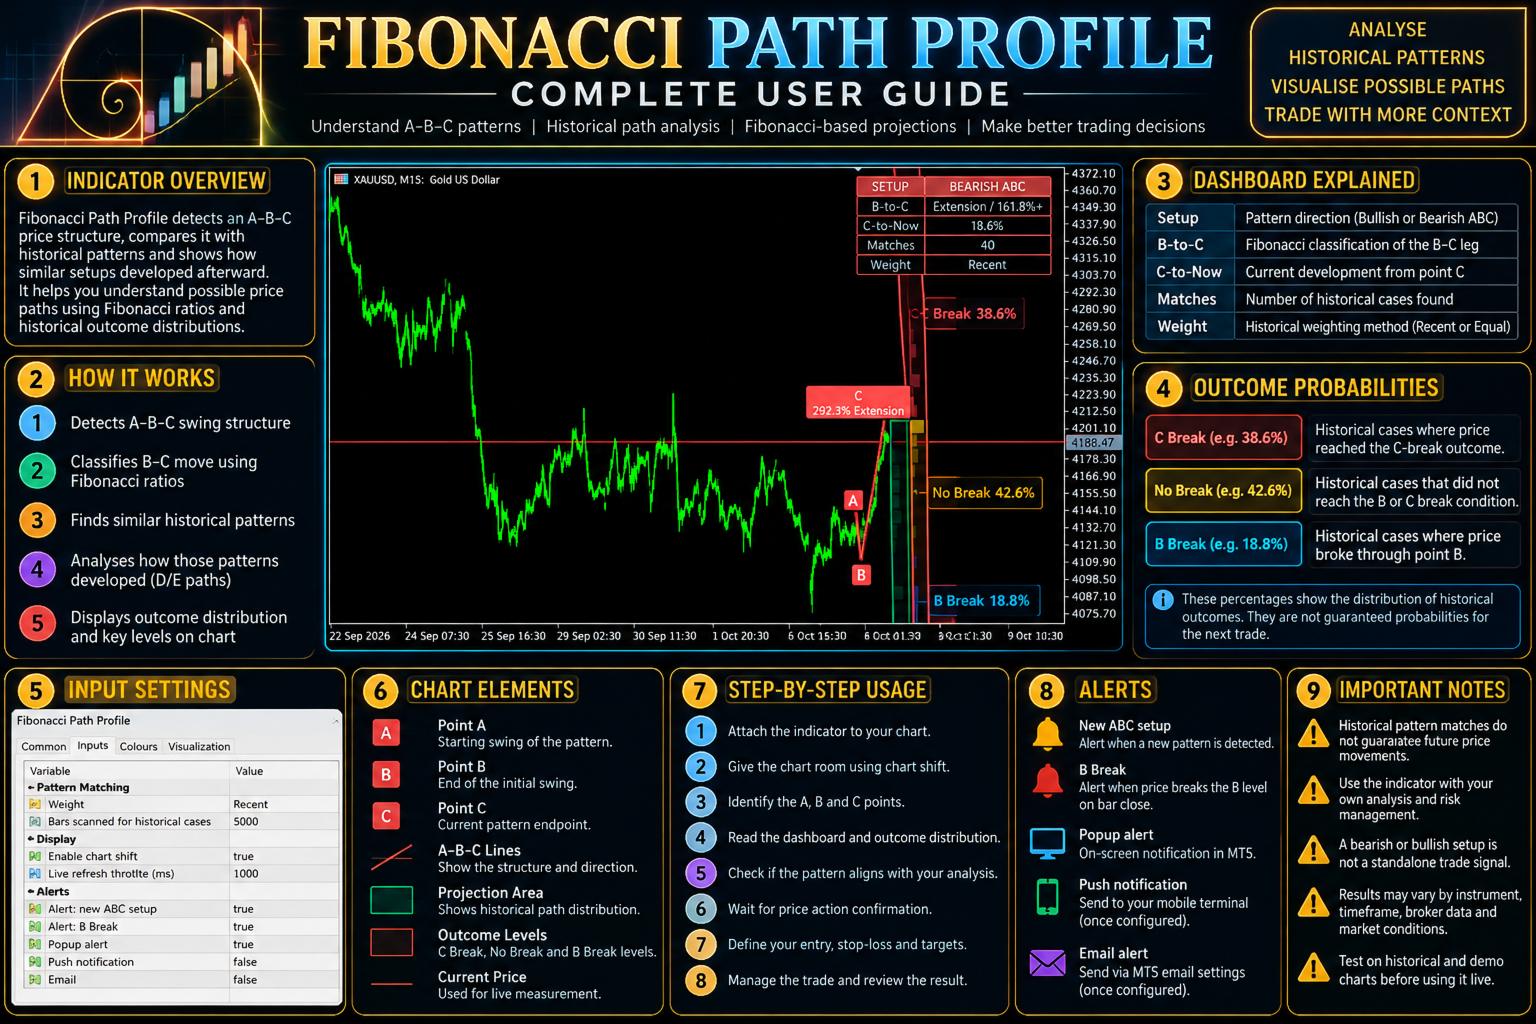
Fibonacci Path Profile for MetaTrader 5
Overview
Fibonacci Path Profile is a price-action analysis indicator designed to study how historical market swings develop after an ABC price structure forms. Instead of relying exclusively on fixed Fibonacci retracement levels, it examines comparable historical swing sequences and uses their subsequent price paths to build a forward-looking distribution of potential market movements.
The objective is to provide traders with a structured way to evaluate possible continuation, retracement, and reversal scenarios using historical price behaviour.
Rather than presenting a single fixed-price forecast, Fibonacci Path Profile focuses on the distribution of outcomes observed across comparable historical patterns.
How It Works
1. ABC Swing Identification
The indicator identifies alternating price pivots and evaluates the relationship between the A–B impulse and the B–C retracement.
The depth of the retracement is classified into Fibonacci-based ranges, allowing the indicator to group historical examples with similar swing characteristics.
2. Historical Pattern Matching
The indicator scans historical price data to identify comparable swing structures. The number of bars considered can be adjusted to control the historical sample.
Two weighting methods are available:
-
Recent: Gives greater weight to more recent historical cases, with older cases gradually receiving less influence.
-
Equal: Gives each qualifying historical case equal weight.
This allows traders to choose between a recency-sensitive analysis and a more uniform historical sample.
3. D/E Path Distribution
Once a qualifying ABC structure is identified, the indicator evaluates the subsequent development of comparable historical patterns.
The D and E stages help describe how price progressed after the initial structure, including extension behaviour and alternative paths following the retracement.
The resulting projection is intended to illustrate a range of historically observed possibilities rather than guarantee a specific future price.
4. Fibonacci-Based Classification
Historical retracements are grouped using levels including:
-
23.6%
-
38.2%
-
50.0%
-
61.8%
-
78.6%
-
100.0%
-
127.2%
-
161.8%
These classifications help distinguish shallow retracements, deeper corrections, and extended price movements.
Key Features
-
Historical swing matching: Compares current structures with qualifying historical cases.
-
Adaptive historical weighting: Choose recent-case weighting or equal weighting.
-
Forward path analysis: Visualises possible price development based on historical analogues.
-
Fibonacci retracement classification: Organises patterns into defined retracement and extension categories.
-
Live ABC setup monitoring: Detects new qualifying structures.
-
Breakout alerts: Can alert when price breaks the relevant B level on a bar close.
-
Configurable historical sample: Adjust the number of historical bars scanned.
-
Chart-space management: Optional chart shift creates room for forward projections.
-
Customisable notifications: Supports popup alerts, push notifications, and email alerts.
Input Settings
Pattern Matching
-
Weight: Select Recent or Equal historical weighting.
-
Calculation Bars: Set the number of historical bars scanned for comparable cases.
Display
-
Enable Chart Shift: Creates additional space for forward path visualisation.
-
Refresh Interval: Controls the minimum interval between live refreshes when no new bar has formed.
Alerts
-
New ABC Setup: Enables alerts when a qualifying setup appears.
-
B Break: Enables alerts when the relevant B level is broken on a bar close.
-
Popup Alert: Displays alerts within MT5.
-
Push Notification: Sends alerts to a configured MT5 mobile terminal.
-
Email: Sends alerts through configured MT5 email settings.
Suggested Trading Workflow
-
Identify a qualifying ABC structure.
-
Examine the retracement classification and historical path distribution.
-
Assess whether the projected paths align with the broader trend and nearby support or resistance.
-
Wait for independent price-action confirmation before considering an entry.
-
Define invalidation and risk before taking a position.
Suitable For
-
Fibonacci and swing-structure traders.
-
Traders studying historical price analogues.
-
Discretionary traders planning continuation or reversal scenarios.
-
Traders who prefer probability-oriented context over a single deterministic target.
Important Notes
Fibonacci Path Profile is an analytical indicator, not an automated trading system. Historical similarities do not ensure that future price movements will follow the same path. Projections depend on the available historical sample, selected weighting method, and market conditions.
The indicator does not guarantee profitable signals or future price accuracy. Always combine its analysis with appropriate risk management and independent confirmation.