Fibonacci Apex
- 指标
- 版本: 1.0

Apex Fibonacci
Precision in Every Level.
Automatic or manual Fibonacci ranges. Multi-timeframe price levels. Custom retracement zones and optional alerts for MetaTrader 5.
Apex Fibonacci is an interactive Fibonacci analysis indicator designed to make price retracements and extensions easier to examine on the chart. It combines a rolling automatic range, manual A/B anchors, selectable Fibonacci levels, multi-timeframe overlays, colored retracement bands, and price-interaction notifications within one floating workspace.
The indicator does not select trade entries for you. Instead, it provides configurable reference levels and a consistent visual framework for analyzing a price movement.
1. Choose Your Fibonacci Range
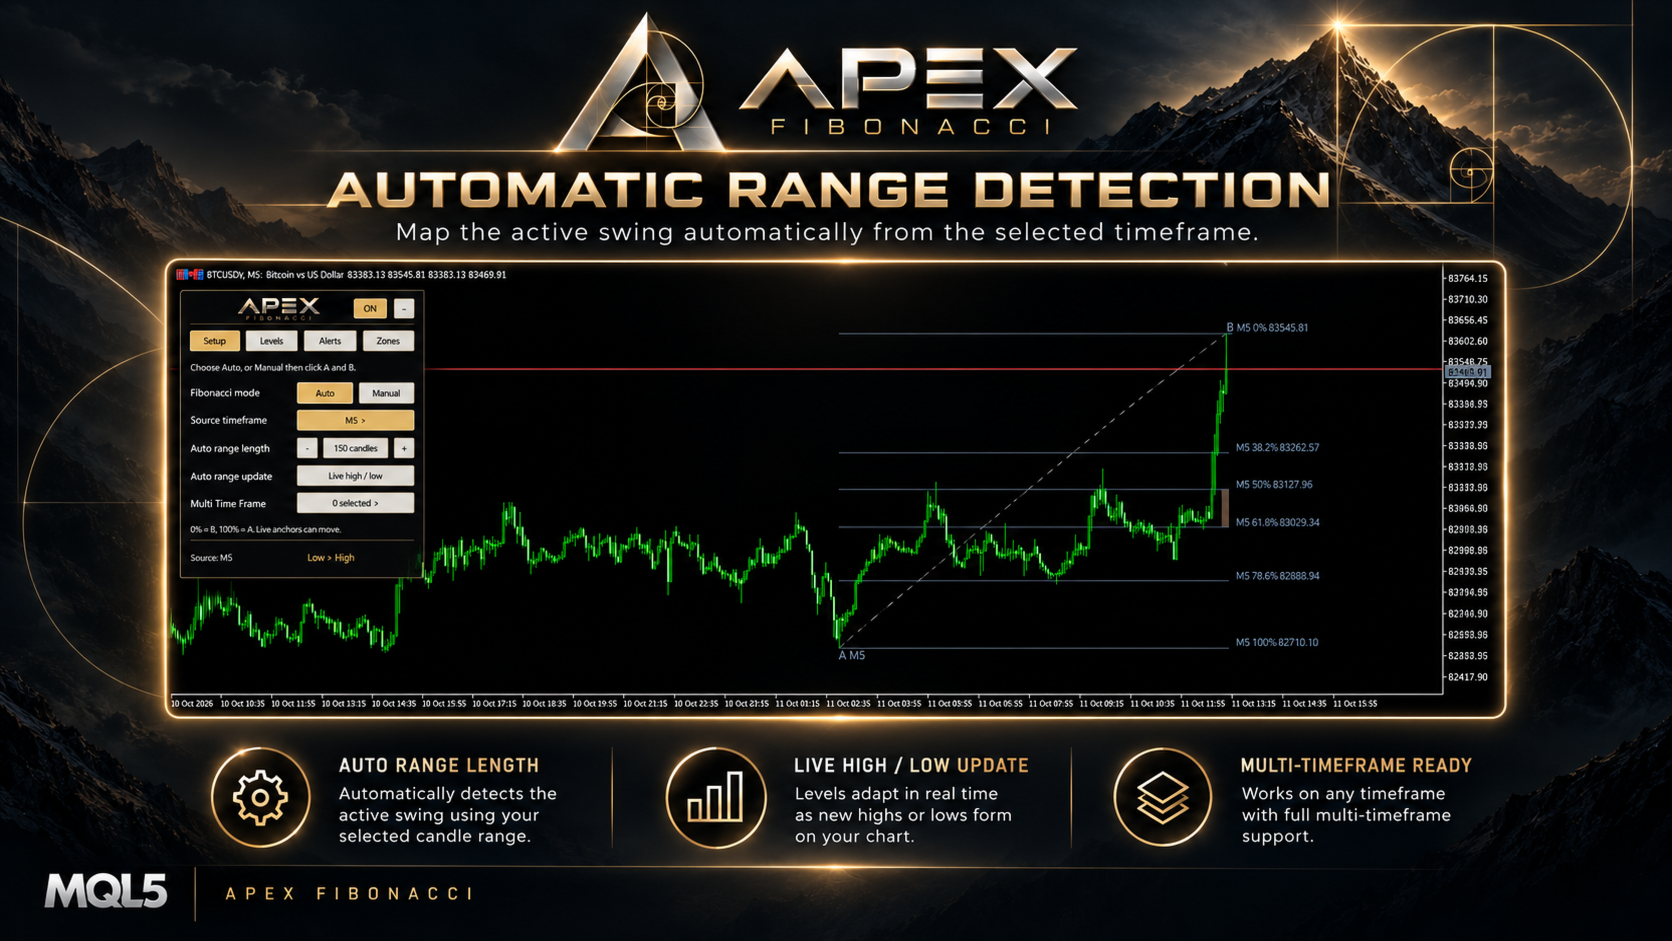
Apex Fibonacci offers two range selection methods. Switch between them from the Setup tab without opening a separate drawing tool.
| Mode | How the range is defined | Typical use |
|---|---|---|
| Auto | Highest high and lowest low within a selected lookback window | Following a developing price range |
| Manual | Two chart points chosen by the trader: A and B | Measuring a particular swing or price movement |
In both modes, the Fibonacci scale is measured backward from the end of the selected movement: 0% is point B and 100% is point A. The price direction determines whether levels are measured down from a bullish high or up from a bearish low.
2. Auto Mode: A Rolling Price Range
In Auto mode, the indicator scans the selected source timeframe for its highest and lowest prices. Their chronological order defines the direction of the A-to-B movement: low-to-high for a bullish movement, or high-to-low for a bearish movement.
Adjustable lookback: Choose from 25 to 500 source candles. Use the controls in Setup to change the number of candles included in the calculation.
Live high / low: The initial mode includes the developing source candle. The range can update as a new high or low appears, so its anchor points and projected levels may move.
Closed candles: This alternative calculates the range from completed source candles only. It excludes the still-forming source candle from the range scan and updates as new candles close.
Source timeframe: Follow the current chart period, or select a fixed timeframe from the source-timeframe menu. The chosen source timeframe determines which candles are scanned; it is separate from the optional multi-timeframe overlays.
If enough history is not available, or the highest and lowest points do not define a valid movement, the indicator waits rather than displaying an unsupported range.
3. Manual Mode: Place A and B Directly on the Chart
Manual mode is useful for examining a move that you want to define yourself, rather than using the rolling highest/lowest window.
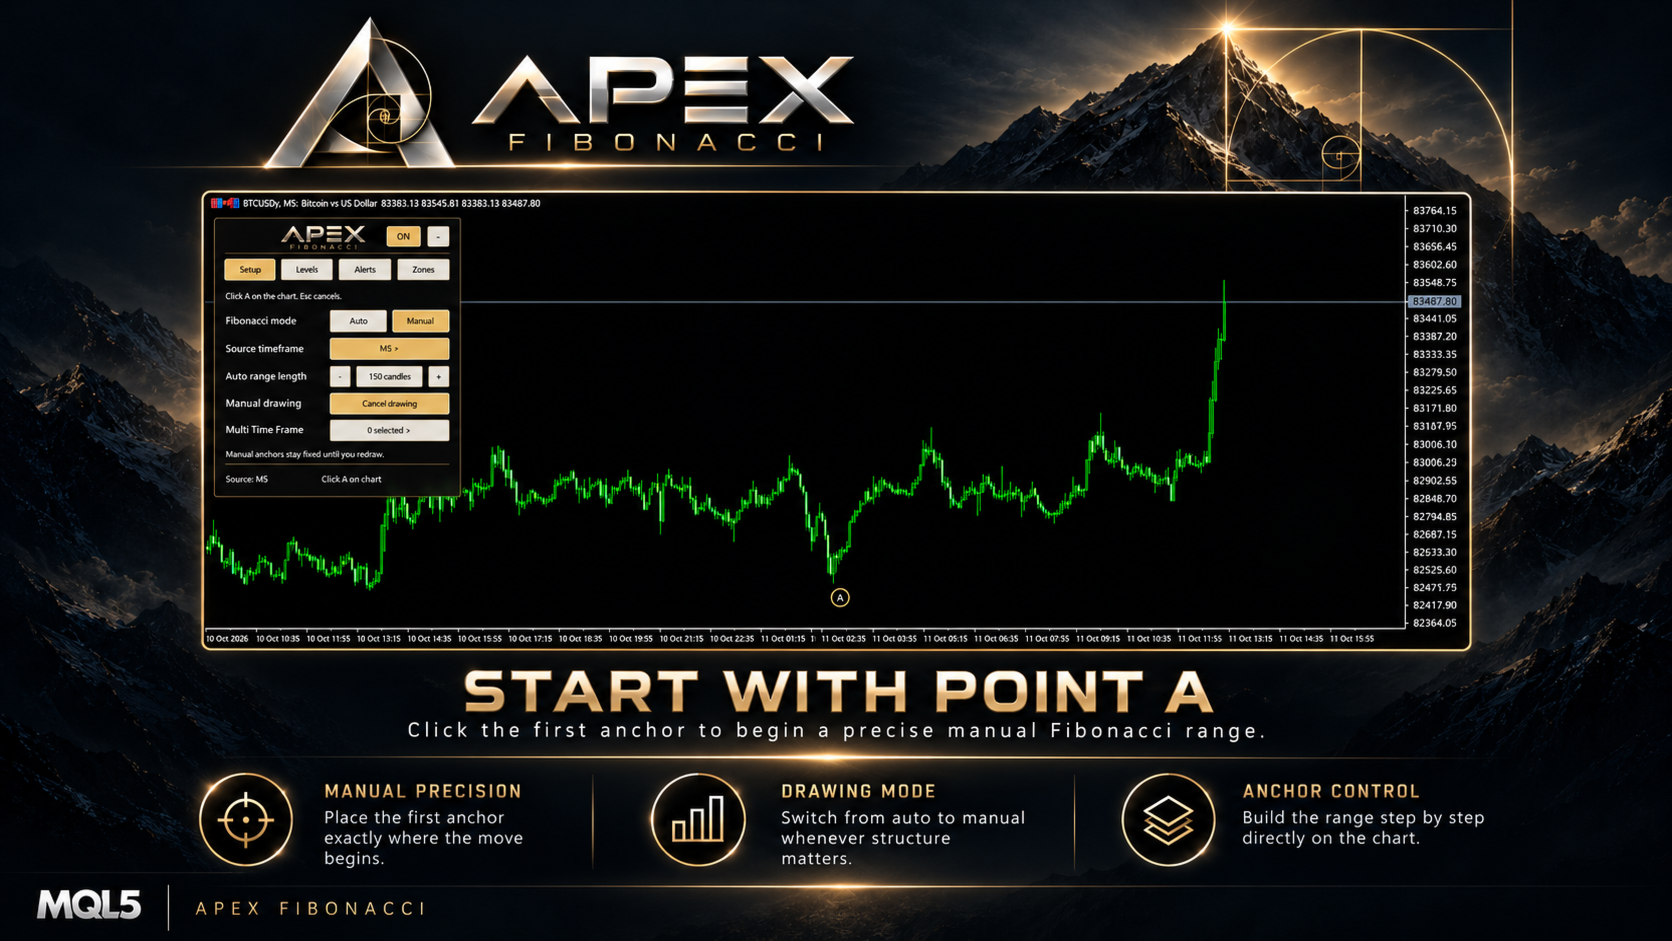
- Open the Setup tab and choose Manual.
- Click on the chart to place A, the beginning of your chosen price movement.
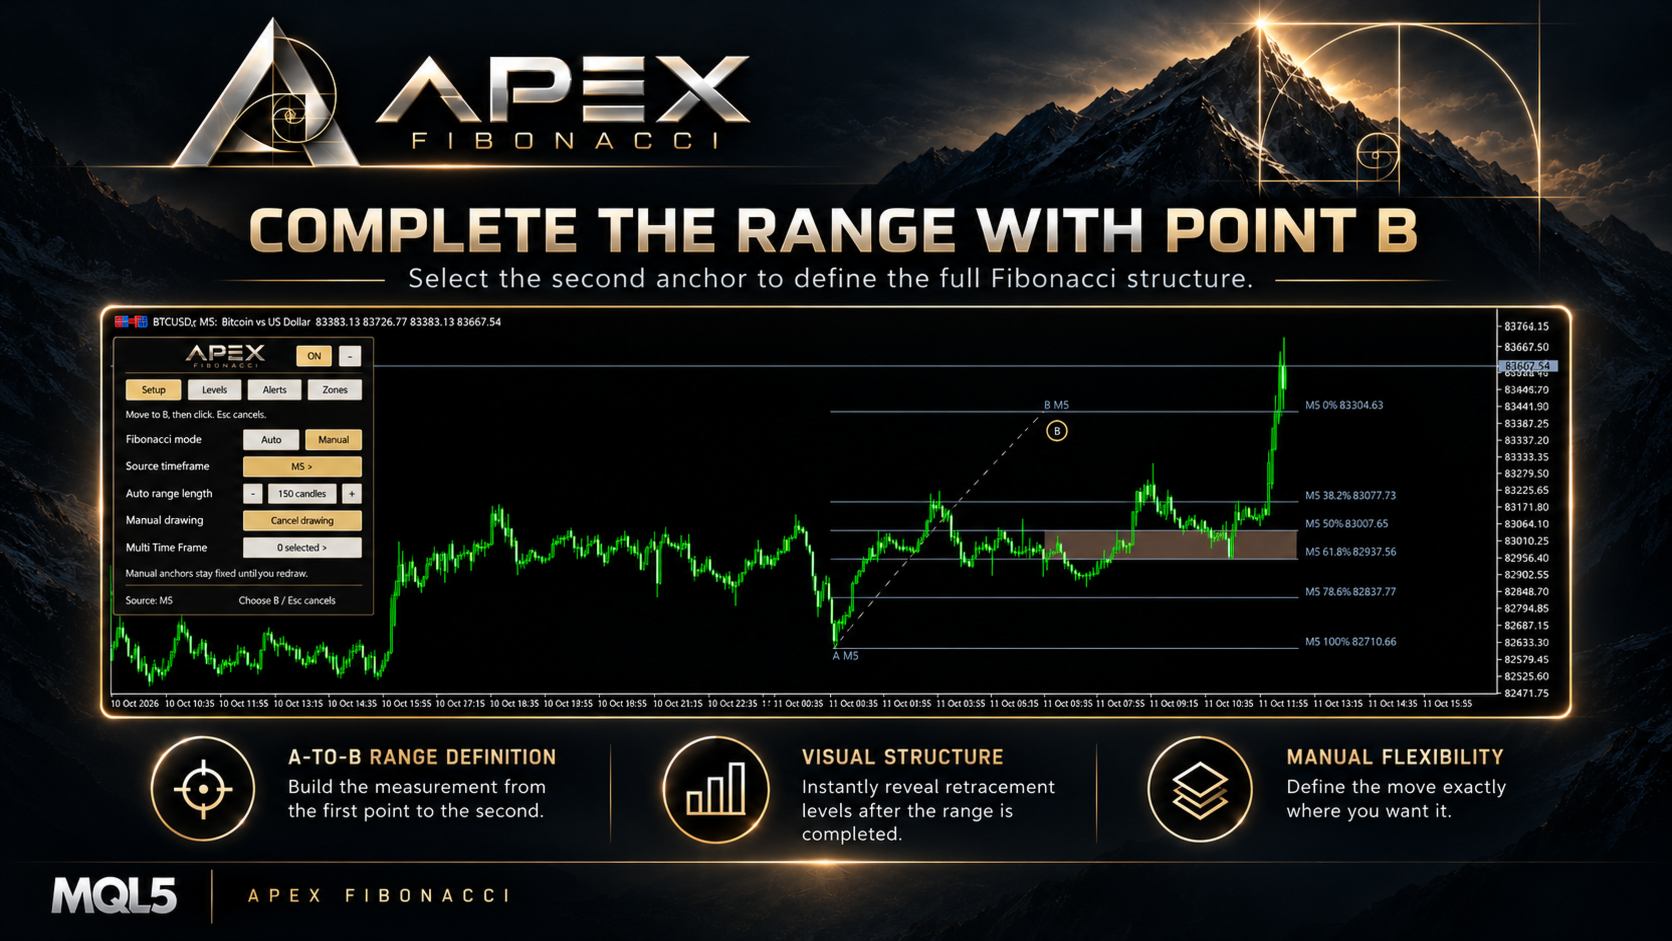
- Move the pointer to preview the second anchor, then click to place B.
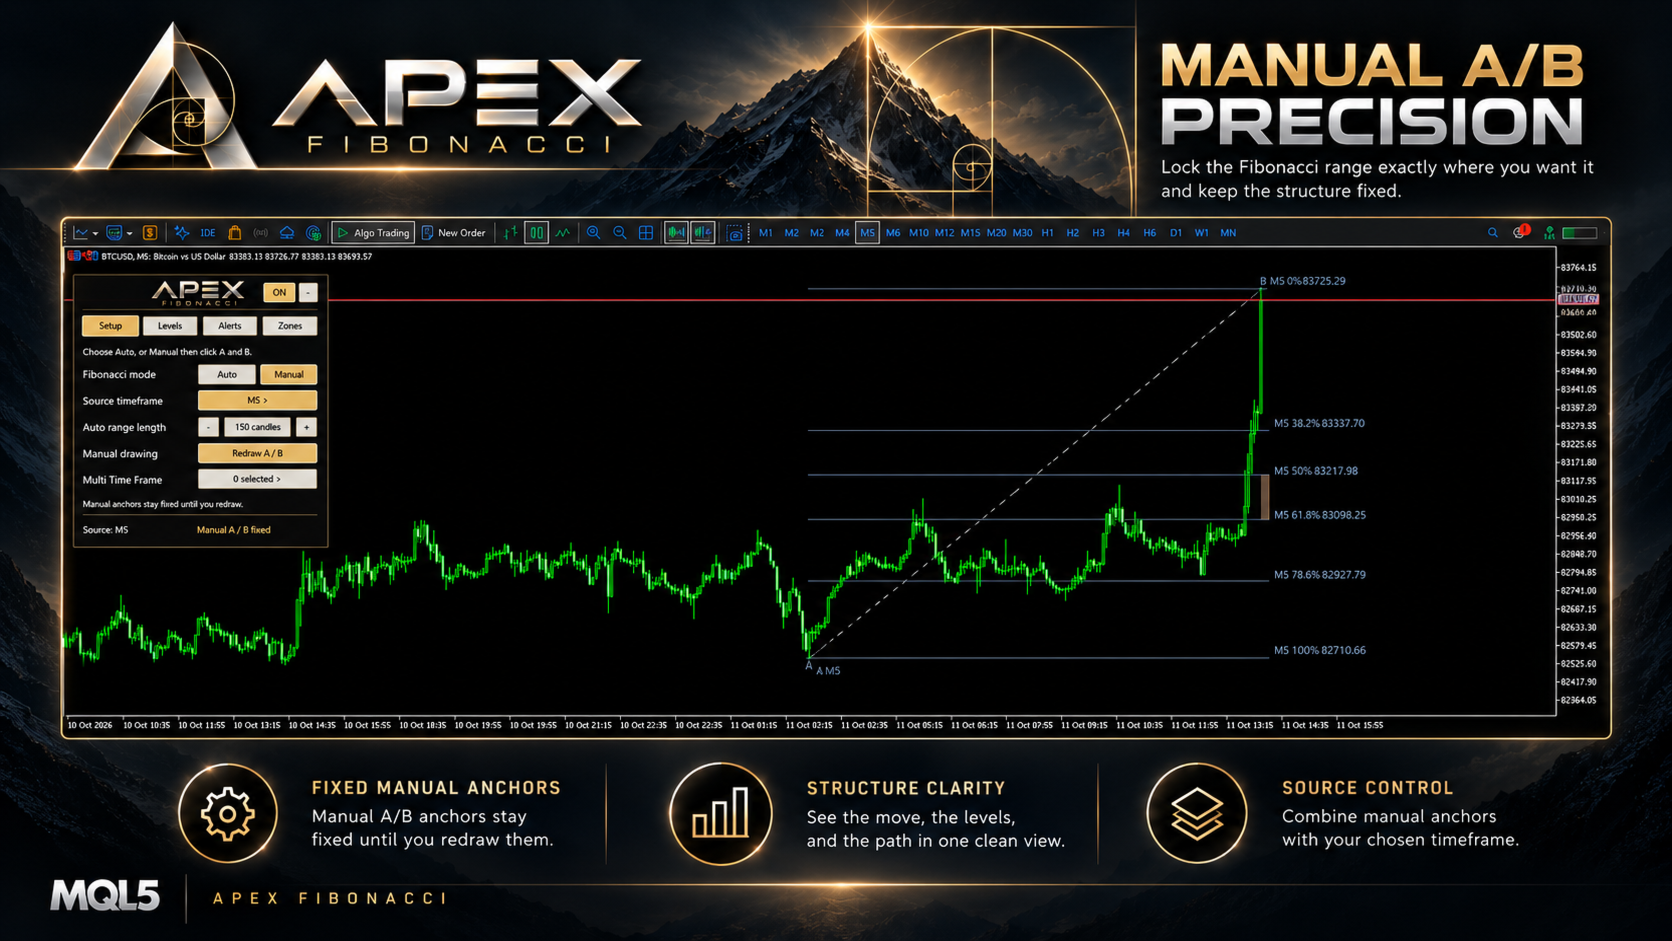
- Review the Fibonacci lines drawn from your selected prices. Use Redraw A / B when you want to define another movement.
Flexible drawing: The two points are read from chart time and price coordinates. A higher B price creates a bullish range; a lower B price creates a bearish range. The points do not have to be clicked from left to right, but they must have different prices.
Cancel safely: Press Esc during selection to cancel the unfinished drawing. A small chart-side A/B guide follows the selection process.
Fixed anchors: Once the manual drawing is complete, its A and B price coordinates remain fixed until you redraw or change the mode. The manual source timeframe is retained for that selection.
4. Multi-Timeframe Fibonacci on One Chart
Open Multi Time Frame in Setup to select additional Fibonacci overlays. The selector supports the 21 native MetaTrader 5 timeframes, from M1 through MN1, and includes Select All and Cancel All controls.
Independent timeframe selection: Add or remove timeframe overlays with one click. The visible selection remains associated with the selected timeframes even when you change the chart period.
One symbol, several perspectives: Each selected timeframe uses the current chart symbol and its own available candle history to calculate its automatic range. Selected levels appear on the same chart for comparison with the main Fibonacci range.
Clearer overlays: The main range uses its selected line color, while additional timeframe lines are drawn with a muted, dashed appearance. Labels identify their timeframes when there is enough chart space.
Only the timeframes you select are displayed. Additional overlays start disabled on a fresh installation, and duplicate automatic overlays are avoided when they match the main automatic source timeframe.
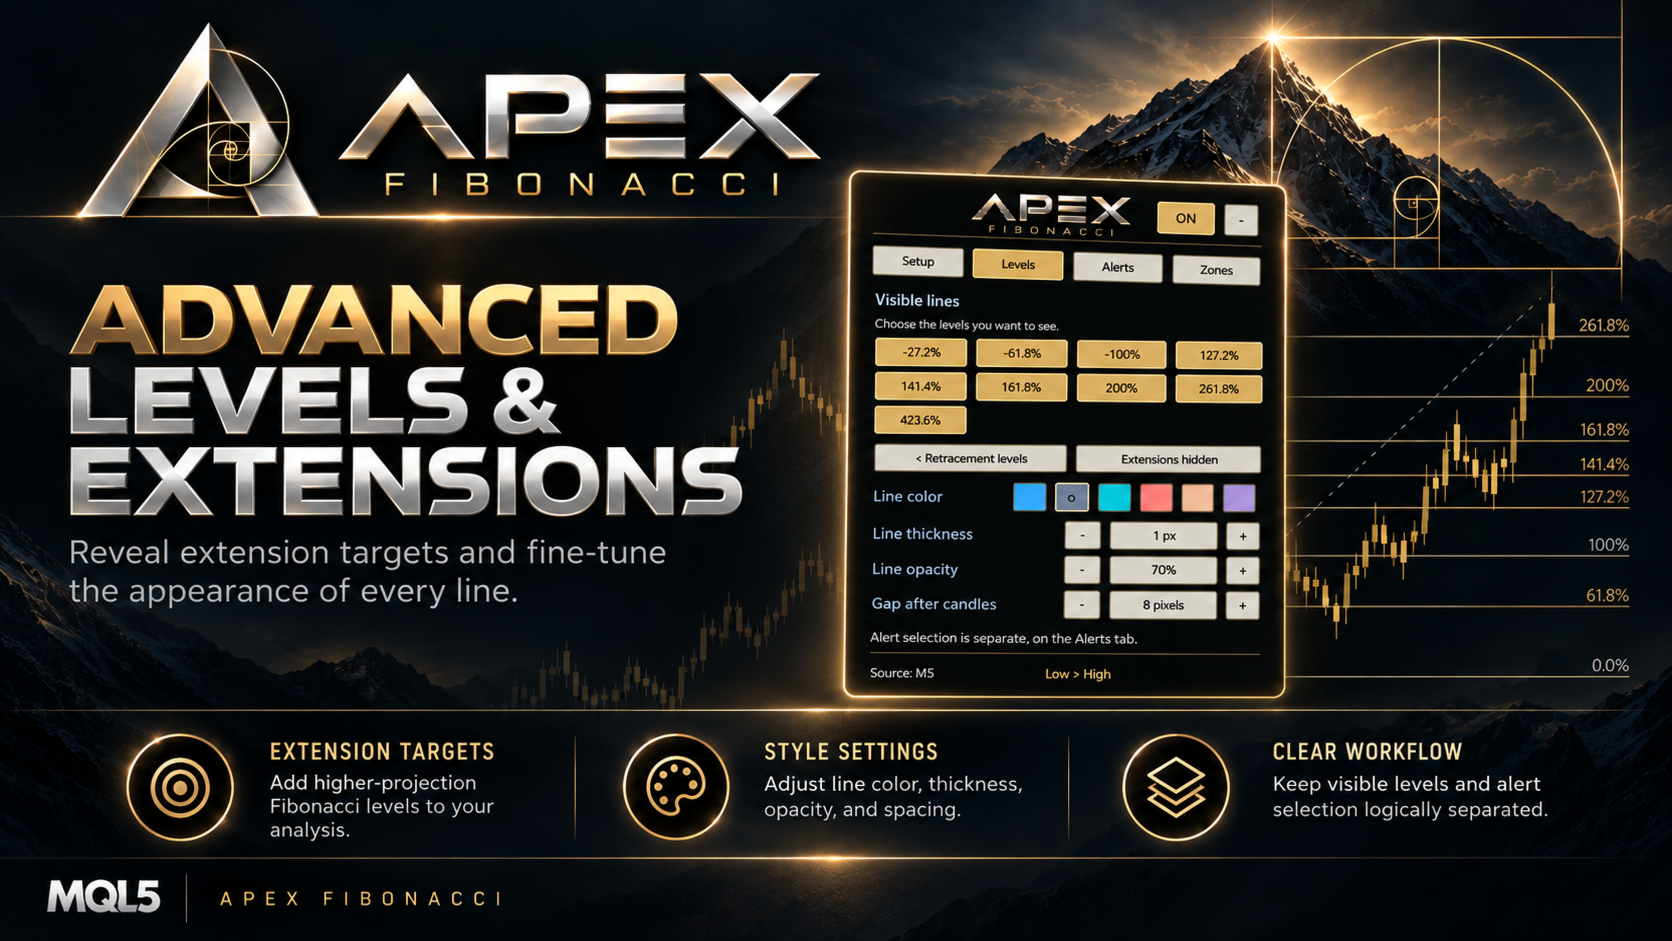
5. Retracement Levels and Extensions
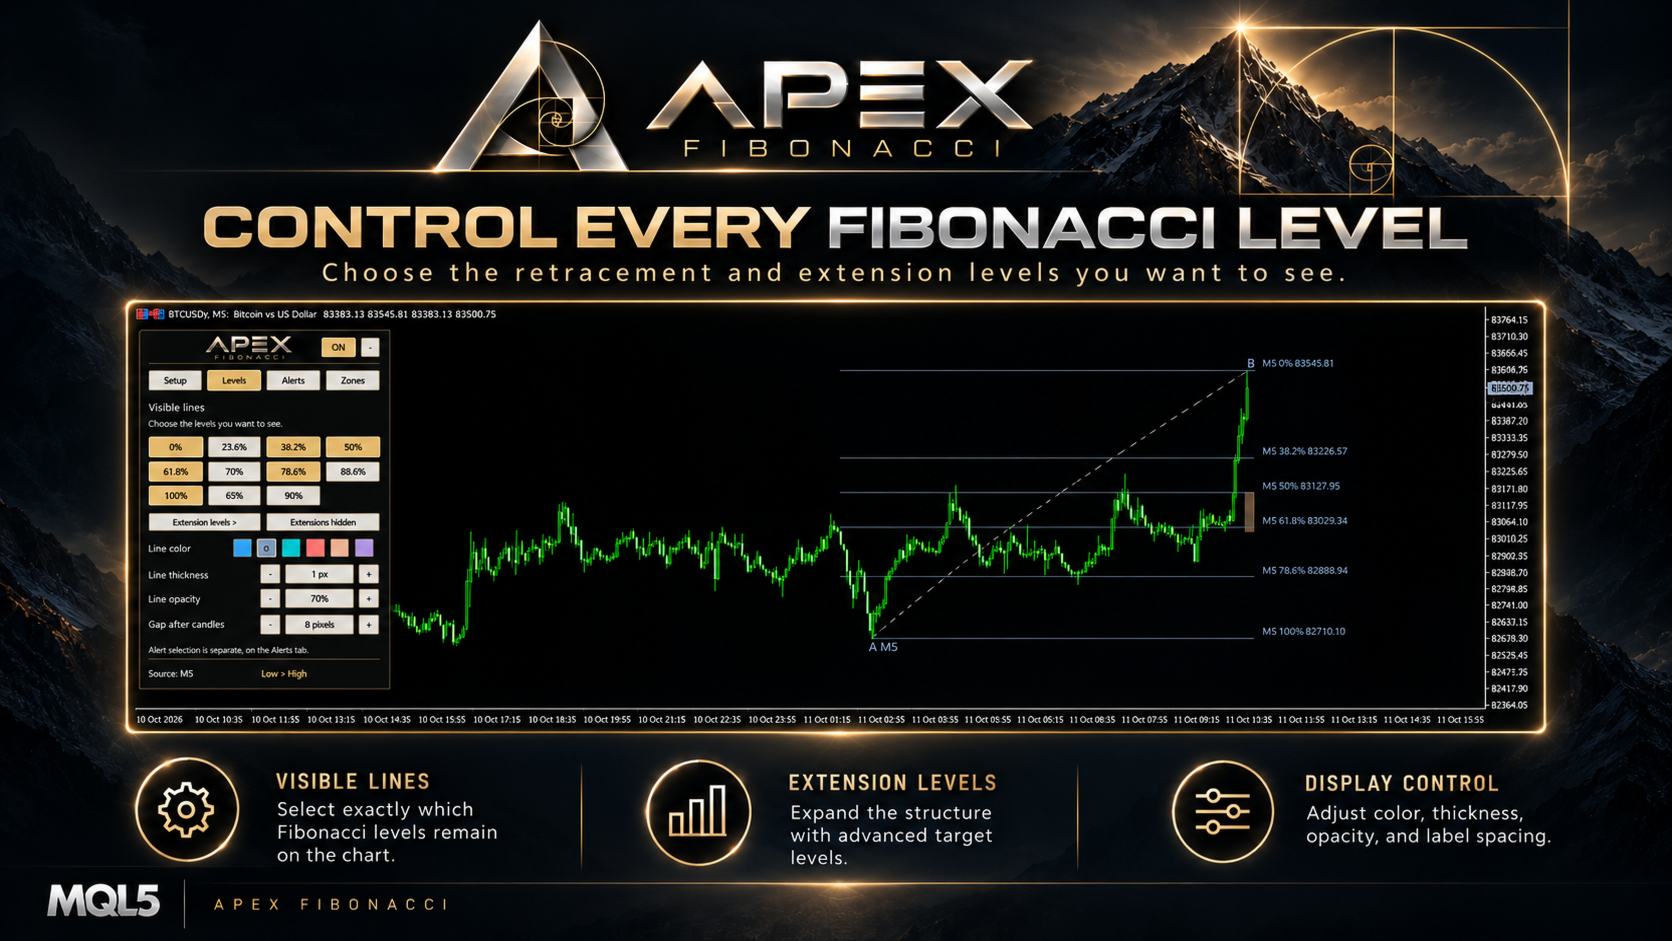
The Levels tab controls which Fibonacci lines appear on the chart. It provides 20 available level positions, with separate controls for the main retracement page and the extension page.
Retracement levels: 0%, 23.6%, 38.2%, 50%, 61.8%, 70%, 78.6%, 88.6%, and 100%, plus two customizable percentages.
Custom retracements: Configure two additional values between 0% and 100% through the indicator Inputs. Their initial values are 65% and 90%. Enable or disable them from the Levels tab.
Optional extensions: Turn on extension drawing to use -27.2%, -61.8%, -100%, 127.2%, 141.4%, 161.8%, 200%, 261.8%, and 423.6%. Extension visibility is disabled initially.
No duplicate lines: If a custom percentage matches another enabled level, the same price level is not drawn twice.
Choose visible lines according to the structure you are analyzing. The lines displayed in Levels and the percentages selected for alerts are controlled independently.
6. Four Customizable Retracement Zones
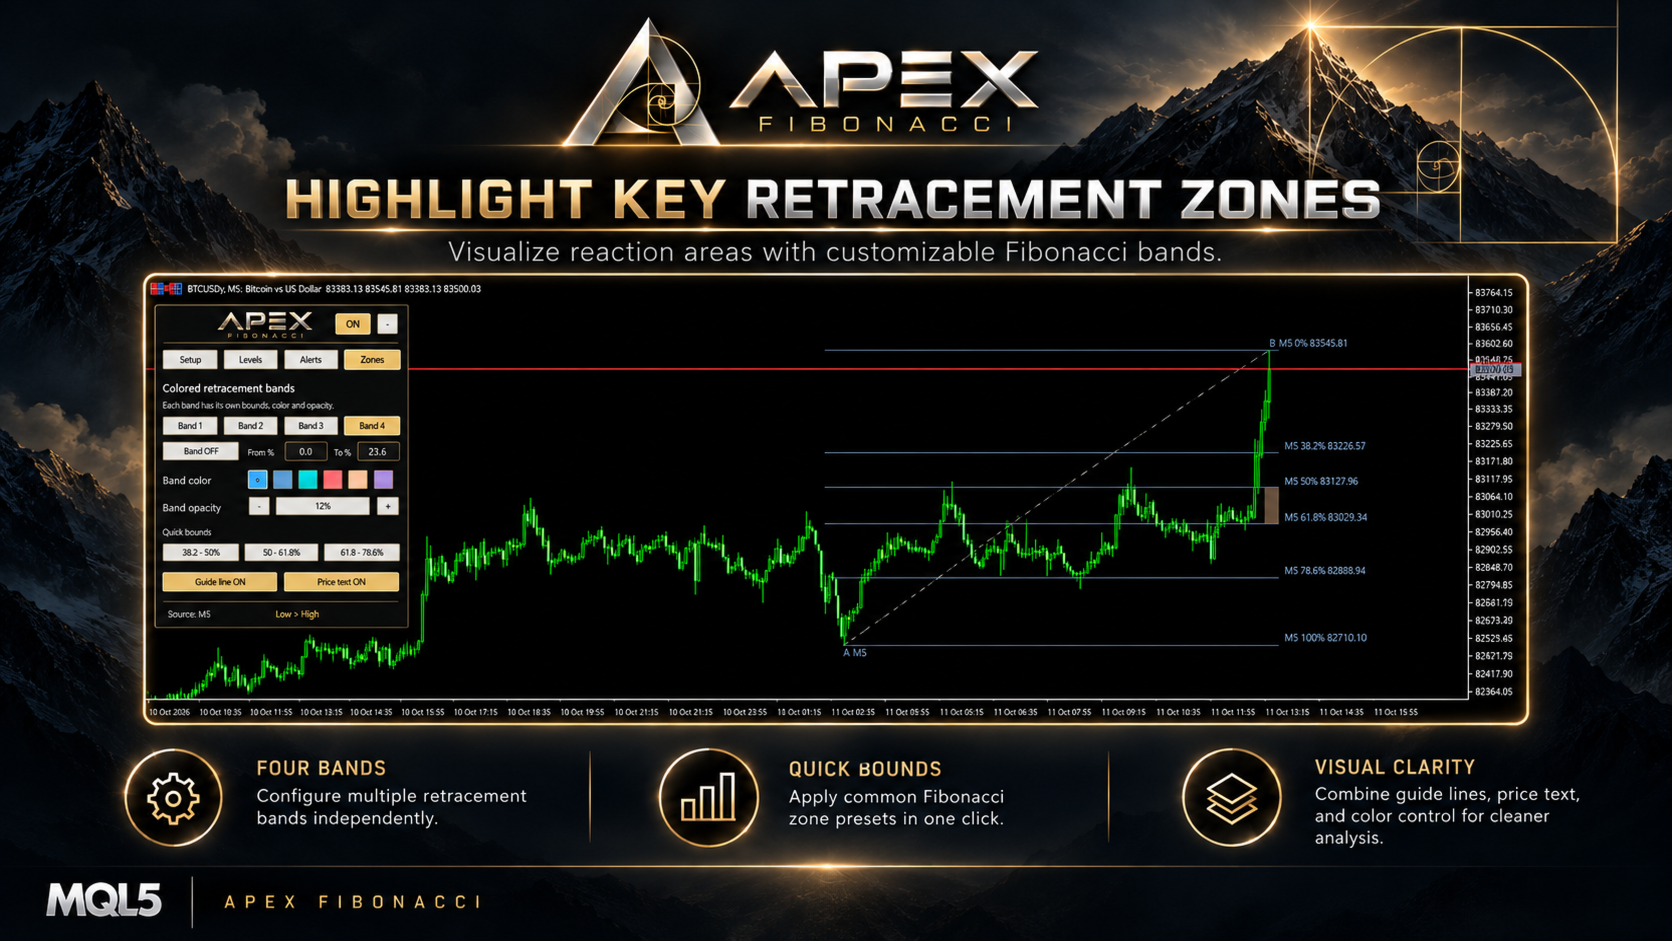
The Zones tab provides up to four independent colored retracement bands around the main Fibonacci range. They help distinguish selected intervals visually without changing the underlying level calculations.
Initial band: Band 1 starts enabled at 61.8% to 78.6%. Bands 2, 3, and 4 start disabled and can be turned on as required.
Editable boundaries: Set the From and To percentages for each band. Zone boundaries accept values from 0% to 100%, and the two limits must be different.
Quick presets: Apply 38.2%-50%, 50%-61.8%, or 61.8%-78.6% to the selected band with one button.
Independent appearance: Select each band's color, opacity, and visibility separately. The filled bands are drawn for the main Fibonacci range; they are not separate filled zones for every additional timeframe.
Use the same tab to show or hide the A-to-B guide line and the price values beside Fibonacci percentage labels.
7. Price Alerts with Separate Level Selection
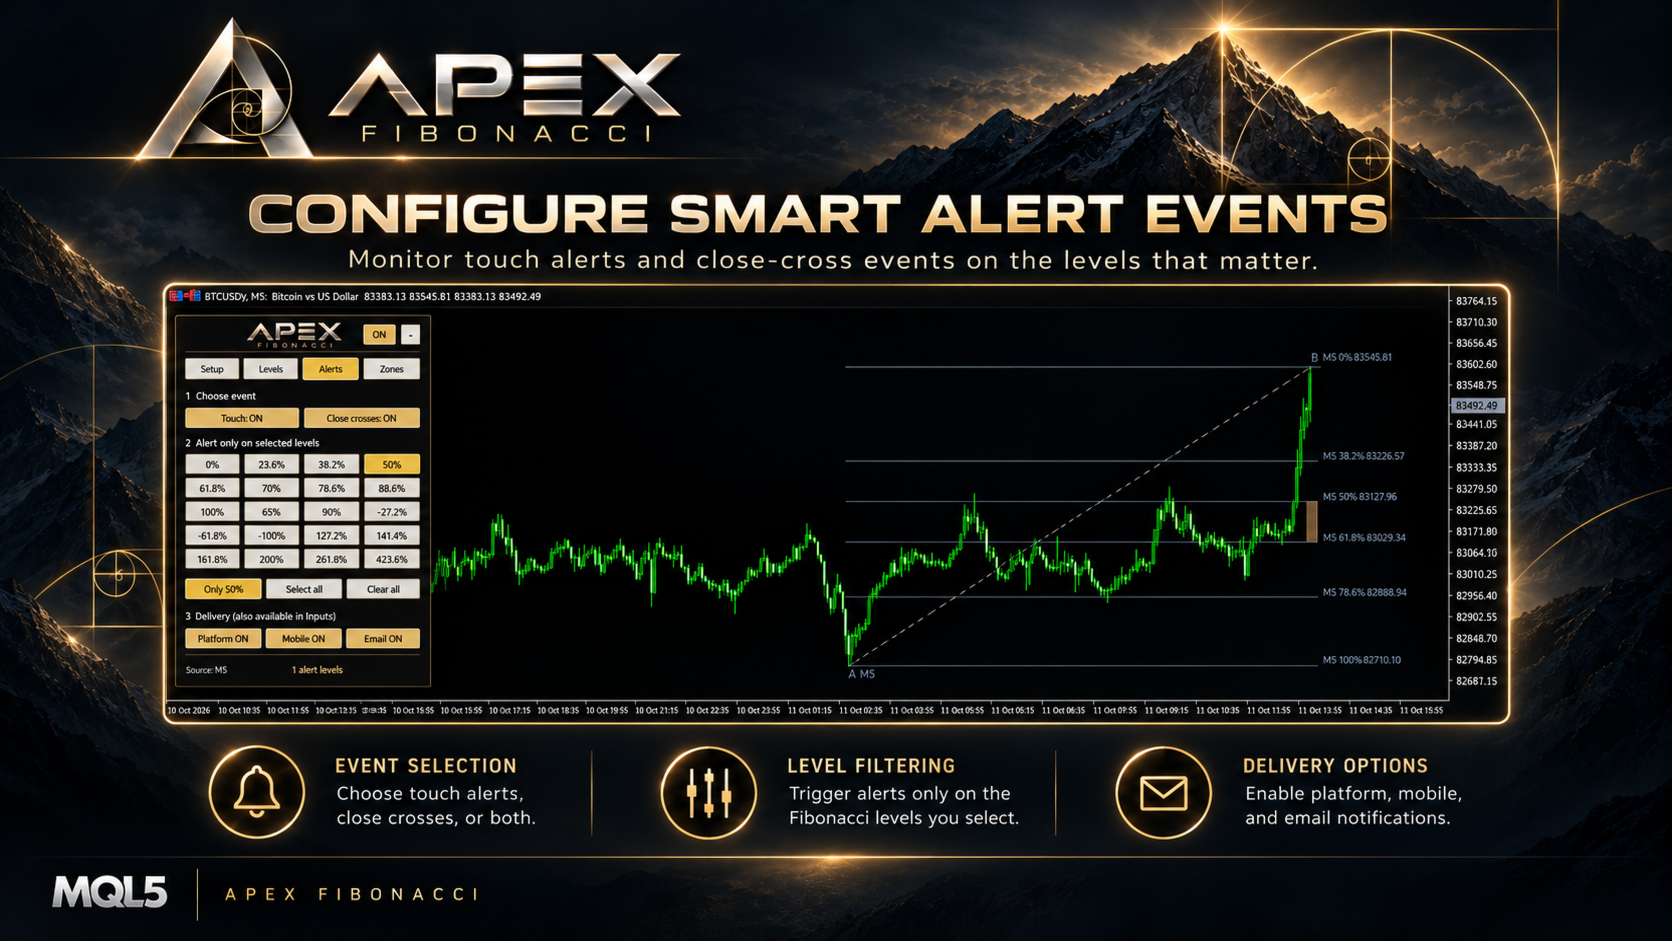
The Alerts tab lets you select which Fibonacci percentages should be monitored for price interaction, regardless of whether those particular lines are currently visible.
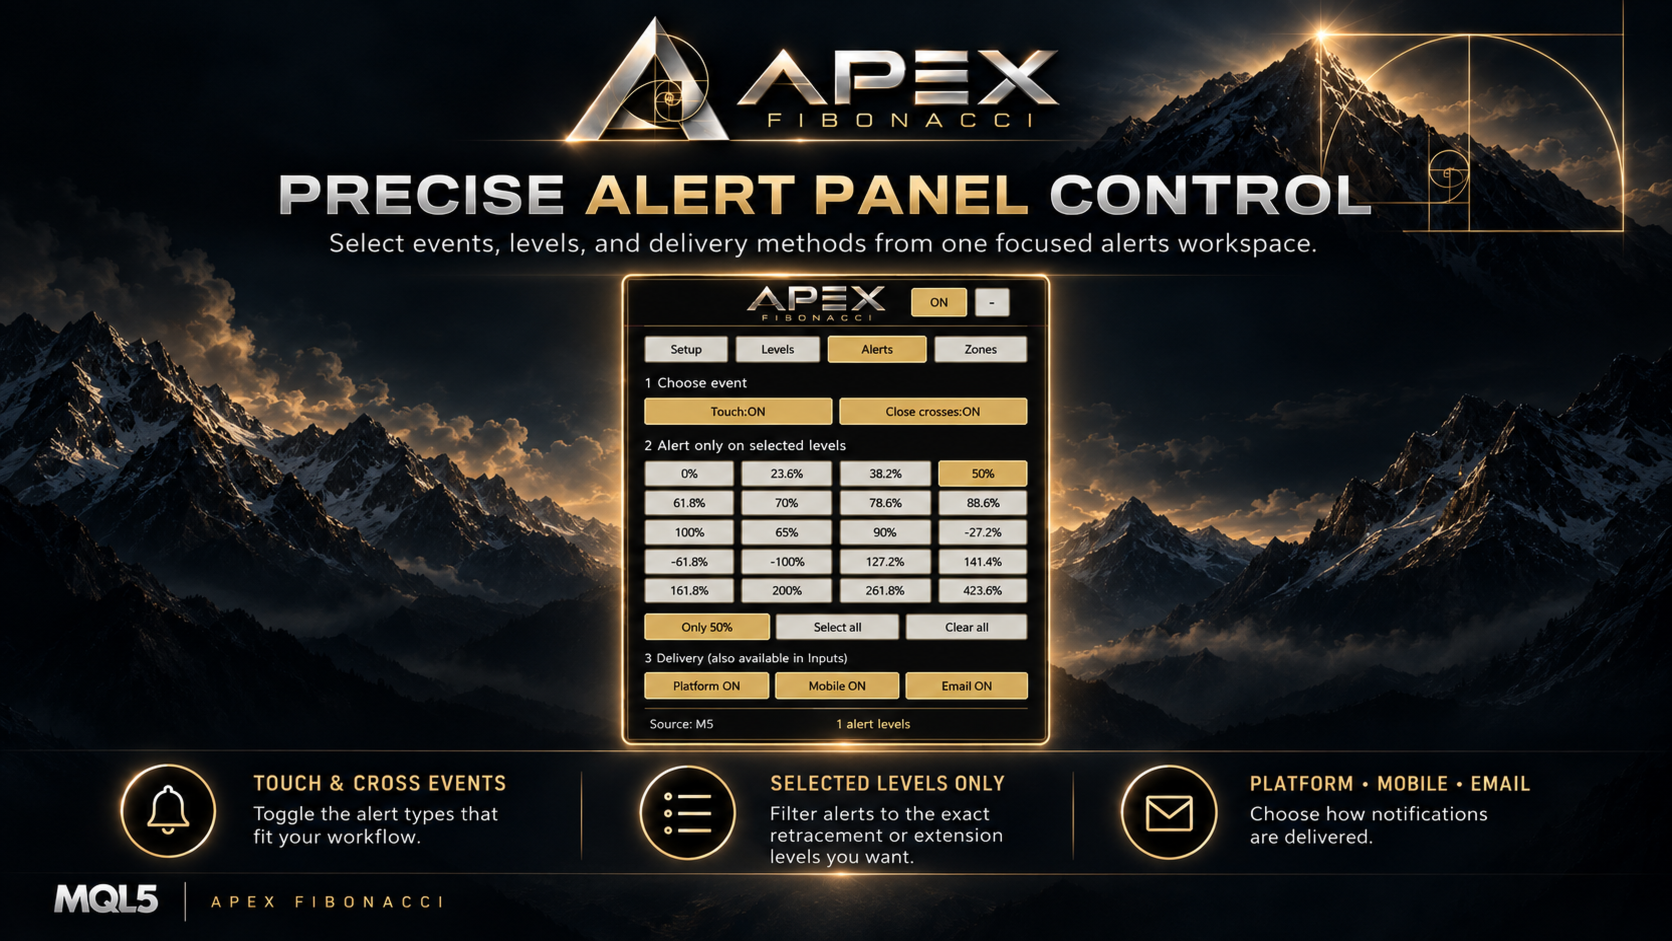
Touch alerts: Receive a notification when price first reaches a monitored level under the indicator's current range-state logic.
Closed-candle cross alerts: Monitor upward or downward crossings confirmed by the closing prices of consecutive source candles. A moving Fibonacci line by itself does not count as a completed candle cross.
Level selection: Select individual percentages or use Only 50%, Select all, and Clear all. Active source and selected multi-timeframe calculations can be monitored.
Delivery options: Choose platform popup alerts, mobile push notifications, and email from the panel. An optional sound file is available in the indicator Inputs. Mobile and email delivery require prior configuration in MetaTrader 5.
Initial state: Touch and cross alerts are disabled by default. The initial 50% alert-level selection does not send notifications unless an event type is enabled. Historical events are not replayed as new alerts when the indicator is attached.
8. A Floating Panel Organized into Four Tabs
Setup: Switch Auto/Manual mode, select the source timeframe, change the auto lookback, choose Live or Closed Candles, and open the multi-timeframe selector.
Levels: Control retracement and extension visibility, line color, thickness, opacity, and the gap after the most recent visible candle.
Alerts: Enable touch or closed-candle cross events, choose monitored levels, and select notification delivery methods.
Zones: Enable and edit four retracement bands, use quick range presets, and switch the guide line or price labels on and off.
The expanded panel can be repositioned by dragging its header. It can also be collapsed into a compact logo and reopened by clicking it. Panel sizing adapts to the chart area and the terminal display scale.
Chart labels are positioned near the most recent visible candles. When there is insufficient space, overlapping or out-of-view labels may be omitted rather than moved to an incorrect price position; the corresponding line tooltip retains the level and price information.
9. Personalize the Chart Display
Line styling: Set thickness from 1 to 5 pixels, line opacity from 0% to 100%, and choose a color from the available palette. Additional timeframe overlays use their own muted presentation.
Zone appearance: Change each band's opacity, color, and range independently. The main A/B guide and price display can be toggled.
10. Practical Ways to Use Apex Fibonacci
Follow a developing movement: Choose Auto mode and a source timeframe, set the lookback period, and compare how the range behaves in Live mode and Closed Candles mode.
Measure a specific swing: Select Manual mode, place A and B around the movement you want to study, and highlight the retracement interval that matters to your analysis.
Compare timeframes: Keep the main Fibonacci range visible, then add selected higher or lower timeframe overlays to observe where levels are near each other.
Monitor a reference level: Enable a selected alert percentage, choose touch or closed-candle cross events, and activate the preferred notification method.
11. Quick Start
- Attach Apex Fibonacci to a MetaTrader 5 chart.
- In Setup, choose Auto or Manual and select the timeframe or A/B anchors.
- Open Levels to select the percentages and optional extensions to display.
- Use Zones to highlight one or more retracement intervals.
- Open Multi Time Frame when you want to compare additional periods.
- Configure Alerts only if you want notifications for chosen price interactions.
12. Important Information
Apex Fibonacci is a visual price-analysis indicator. Its automatic anchors are based on a rolling window of broker price candles and can change when new price extremes occur. Closed Candles mode excludes the current forming source candle, while a finished manual A/B selection remains fixed until it is redrawn.
Fibonacci lines are analytical reference levels, not confirmed support or resistance and not trade signals. The indicator does not open, manage, or close trades. Price alerts report interactions with the configured levels and should not be interpreted as buy or sell instructions.
Calculations and visibility depend on the available broker price history, selected timeframes, chart space, and terminal notification configuration.