 MetaTrader 5
 专家
专家
 指标
指标
 程序库
程序库
 实用工具
实用工具
 窗口小部件
窗口小部件
 规则
规则
适用于MetaTrader 4的免费技术指标 - 15
 下面列出的技术指标信号对MetaTrader 4平台的开仓交易和平仓交易起着至关重要的作用。
指标的本质就是一种交易品种的数学转换,旨在预测价格变化。
下面列出的技术指标信号对MetaTrader 4平台的开仓交易和平仓交易起着至关重要的作用。
指标的本质就是一种交易品种的数学转换,旨在预测价格变化。 
Heiken Ashi Direct Standard Heiken Ashi candles with two extra data lines your other tools can read directly. What it does This indicator draws classic Heiken Ashi candles on your chart, calculated the same way MetaTrader's built-in Heiken Ashi indicator does. On top of that, it quietly keeps two extra values available — the real high and low of each Heiken Ashi candle — so that any Expert Advisor or other indicator you run can read them directly, without doing any extra math on its own. It does
FREE

Key Features A better paid version: https://www.mql5.com/zh/market/product/200126?source=Site +Market+My+Products+Page https://www.mql5.com/zh/market/product/200129?source=Site +Market+My+Products+Page 1. Confluence Signal Engine To effectively minimize false breakouts and reduce overtrading during low-volatility periods, signals are generated only when the following criteria align simultaneously: Core Momentum (EMA Crossover): Triggers on a Golden Cross (Buy) or Death Cross (Sell) between t
FREE

“Gold Miner Robot” is a very powerful AI-Based robot designed and built to accurately analyze the market and trade on gold. Developed by “Keyvan Systems” after more than 3 years of research and development on each tick of the gold chart. "Gold Miner Robot" uses a complex algorithmic approach based on price analysis, trend analysis. We have also provided two other personalized indicators called "GoldMinerRobot SI 1" and "GoldMinerRobot SI 2" for better market analysis, which you can download free
FREE
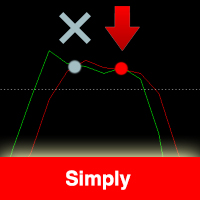
The indicator is based on the Stochastic indicator. I also recommend to see my EA Night Zen Strategy: It contains a strategy for crossing the K and D lines in the overbought (for sales) and oversold (for purchases) zones. The indicator gives a signal at the second intersection.
The signals are not rewritten, they appear after confirming the intersection of the K and D lines.
Settings: Stochastic Indicator Settings Indicator period Notification and Alert Settings
FREE

LockMaster — See Every Outcome Before You Touch a Locked Position Do you love untangling complex locks — or are you forced to? Either way, this tool is for you! Managing a hedge lock (opposing Buy and Sell positions on the same pair) is one of the trickiest situations in manual trading. Which leg do you close first? What happens to your Break-Even, Margin Call and Stop Out levels if you unwind one side now — or wait for a Take Profit to hit? Guessing wrong costs money. LockMaster removes the gue
FREE
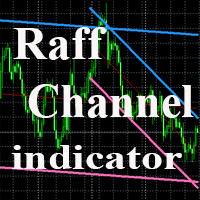
The indicator plots a trend channel using the technique by Gilbert Raff. The channel axis is a first-order regression. The upper and lower lines show the maximum distance the Close line had moved away from the axis line. Therefore, the upper and lower lines can be considered as resistance and support lines, respectively. A similar version of the indicator for the MT5 terminal
As a rule, most movements of the price occur within a channel, going beyond the support or resistance line only for a sh
FREE
Multi-Timeframe EMA Momentum Filter — Version 1.0 This indicator is designed to help traders evaluate short-term EMA crossovers in the context of higher timeframe momentum. Its purpose is to reduce noise and highlight setups that align with the broader market trend. How it works: On the main chart, arrows appear when a fast EMA crosses a slow EMA on the current timeframe, provided that higher timeframe momentum confirms the direction. In the subwindow, a histogram displays the difference betwee
FREE

加入 考拉交易解决方案频道 在MQL5社群中,获取有关所有考拉产品的最新信号和新闻,加入链接如下: https://www.mql5.com/en/channels/koalatradingsolution 描述 :
我们很高兴推出基于外汇市场 (PSAR) 中专业和流行指标之一的新免费指标 该指标是对原始抛物线 SAR 指标的新修改,在专业 SAR 指标中,您可以看到点和价格图表之间的交叉,这交叉不是信号,而是谈论运动结束的可能性,您可以从新的蓝点开始买入,并在第一个蓝点之前设置止损,最后您可以在点交叉价格图表时退出。
如何打开买入或卖出信号? 通过第一个蓝点打开买入交易并通过第一个红点打开卖出交易
正确的止损在哪里? 安全止损可以在第一个点上,(在第一个蓝点的买入情况下和在第一个红点的卖出情况下)
正确的止盈在哪里? 止盈可以根据止损距离和RR进行调整,所以我的建议是2 RR,是止损的2倍
如果我们盈利但仍未达到 tp,那么退出点在哪里? 第一个退出警报可以在点和价格图表之间交叉。
该指标何时释放警报? 一旦新的点出现在新的方向,指标就会释放警报
我们如何
FREE

Indicator Rua Alert Line. This indicator will notify when the High-price of candle breaks any TrendLine or HorizontalLine on the chart. Notifications will be sent to the phone and on MT4. And it have ArrowBuy/ArrowSell on chart. It is very useful for those of you who use the TrendLine or HorizontalLine but do not have time to observe the chart. Timeframe M1 to W1 Symbol: All
FREE

The Hull Moving Average (HMA), developed by Alan Hull from 2005, one of the most fast-moving Average, reduce lag and easy to use to identify Trend for both Short & Long term. This Indicator is built based on exact formula of Hull Moving Average with 3 phases of calculation: Calculate Weighted Moving Average (WMA_01) with period n/2 & (WMA_02) with period n Calculate RAW-HMA: RAW-HMA = 2 * WMA_01(n/2) - WMA_02(n)
Weighted Moving Average with period sqrt(n) of RAW HMA HMA = WMA (RAW-HMA, sqrt(n)
FREE

Check Out Our Other Products: Click Here TradingCalendar Visualize Your Trading Performance: TradingCalendar automatically transforms your MetaTrader trading history into a clean monthly calendar, making it easy to see your trading performance at a glance. Daily Profit & Loss: Each trading day displays your daily P&L and number of trades. Profitable and losing days are clearly highlighted for quick performance review. Monthly Statistics: View your total monthly P&L and number of active tradin
FREE

WONNFX iSTATS - Account Statistics Indicator [MT4] Indicator Description:
is a informational indicator that displays detailed account statistics directly on your chart. The indicator shows profit/loss across different timeframes (day, week, month, quarter, year), in various units of measurement (pips, lots, deposit currency, percentages), as well as advanced risk metrics.
Unlike the terminal's built-in tools, iSTATS provides a complete picture of your trading performance in real-time and over se
FREE
How To Trade
Execute your trades in 3 Easy Steps!
Step 1: Trade Setup Entry Buy in Signal price and TP1 in price indicator, You can use trailing stop in TP1. Entry Sell in Signal price and TP1 in price indicator, You can use trailing stop in TP1. Success Rate ≥ 75% 100:25 Step 2: Set Stop Loss Stop loss BUY ----> You can set stop loss on Line Order SELL. Stop loss SELL ----> You can set stop loss on Line Order BUY. Step 3: Set Take Profit Option 1: Take profit on TP1. Option 2: Partial take pr
FREE
具有多时间框架支持、可自定义视觉信号和可配置警报系统的Williams %R指标。
自由职业编程服务、更新和其他TrueTL产品可在我的 MQL5主页 获取。
非常欢迎您的反馈和评价!
什么是Williams %R? Williams %R是由拉里·威廉姆斯开发的动量振荡器。它在-100到0的范围内运动。接近0的值表示超买状态,接近-100的值表示超卖状态。Williams %R是一个反向随机振荡器,测量收盘价相对于特定时期高低点范围的位置。超买/超卖水平(-20和-80)的穿越产生交易信号。 该指标帮助交易者识别潜在的反转点:当%R向下穿越-20线时,可能预示着即将到来的调整;当它向上穿越-80线时,可能表明可能的反弹。Williams %R与价格之间的背离可能在趋势反转前提供强烈的预警信号。 功能特点: 带箭头和垂直线的视觉信号标记 三个独立信号缓冲区,具有可配置触发器 信号检测选项:方向变化、级别穿越、峰/谷 每个信号可配置警报(电子邮件、推送、声音、弹出窗口) 具有插值方法的多时间框架(MTF) 柱状图或折线图显示模式 多种颜色模式(单色、基于方向、基于级别) 通过iCu
FREE

XMaster Scalping NEW - a simple indicator that determines the beginning and end of a trend. It can be said very well, even ideal for both scalping and medium / long-term trading. When plotted on a chart, it is located in the basement, which gives you the opportunity to draw trend lines / levels on the price and look into the basement at the indicator.
How to use: It's simple. Sale yellow, buy green. The colors can be changed in the settings.
Additional trading information: Works best on t
FREE
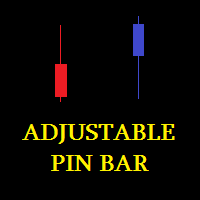
Check my p a id tools they work perfect please r ate Adjustable PIN BAR indicator is usefull tool alowing to search for pin bars you wish to find on the price chart, it has 2 parameters to filter out what type of pin bars you wish to search for: 1) MinTailProc 75% (default) which means to show pin bars that has minimum size of the Nose (Tail) as 75% of full candle size. If Upper Nose (Tail) size of the candle is minimum 75% of the candle size fully than candle is painted in RED. If Lower Nose
FREE
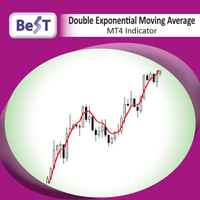
Double Exponential Moving Average ( DEMA ) is a moving average (MA) that gives the most weight to recent price data.Like exponential moving average (EMA), it is more reactive to all price fluctuations than a simple moving average (SMA) and so DEMA can help traders to spot reversals sooner, because it is faster responding to any changes in market activity. DEMA was developed by Patrick Mulloy in an attempt to reduce the amount of lag time found in traditional MAs. ( TASC_Feb. 1994 ). DEMA can al
FREE

每位交易者都熟悉这套流程:打开指标设置,改一个数字,点 OK,盯着图表眯眼看半天,觉得不对,再打开设置。OsMA——Moving Average of Oscillator,也就是单独拿出来的 MACD 柱状图——和 MACD 一样要设三个数字,所以每次想试另一组参数,同样要付出三个数字来回改的代价。OsMA Live Tuner 终结了这一切。 它就是可以 直接在图表上实时调节 的 OsMA 柱状图(MACD 线减去它的 Signal 线)。图表上有一个小面板,带三个滑块:Fast EMA、Slow EMA 和 Signal 周期。拖动其中任意一个,柱状图就会立即重算并重绘,全程尽在眼前。「用 12/26/9 还是用自己的数」——在自己的图表上几秒钟就有答案,不必去论坛翻帖子。 真正的 OsMA,不是套壳。 指标采用自己的教科书式实现:Fast EMA 减 Slow EMA 得到 MACD 线,对该线取 SMA 得到 Signal,两者之差即为 OsMA——中间没有任何内置句柄。你调的就是你看到的。不重绘。 还有实时样式编辑器。 用 16 色调色板和 RGB 滑块调整柱状图的颜色和粗
FREE

Flat Reminder Overview Flat Reminder is a powerful technical analysis tool that identifies and highlights price consolidation zones on your chart. It detects when price action slows down and moves sideways, indicating potential reversal points, continuation setups, or key decision zones in the market. Key Features Consolidation Detection : Automatically identifies flat price zones where market momentum decreases Range Measurement : Calculates and displays the exact range of each consolidation in
FREE

Indicator signal analyzer (ISA) MT4 策略构建器 + 分析器 + 信号生成器(三合一) 。
前10件售价仅需33美元! 抓紧时间,之后价格将上涨!!!
这一强大的指标使每位交易者都能基于任何指标深入分析和测试自己的交易策略。 主要特点: 您可以选择任何标准 MT4 指标(RSI、MACD、布林带、一目均衡表、移动平均线等)或任何自定义指标(包括市场指标——只需正确输入名称,例如:“市场指标名称”)。 使用以下方法创建高度灵活的买入(看涨)和卖出(看跌)信号条件: 指标缓冲区值 蜡烛图形态(十字星、锤子线、丸头线等) 与开盘价、收盘价、最高价、最低价(当前或前一根K线)的比较 不同缓冲器之间的比较 最多可添加 3 个额外的滤波指示器来确认主信号。 在 MT4 策略测试器中测试任何策略的盈利能力(即使是您尚未购买的指标——只需输入名称并在可视化模式下进行测试)。 实时在图表上直接接收清晰的箭头信号和警报(声音、电子邮件、推送通知)。 它是为谁准备的? 想要测试新指标或已购买指标的真实效力的交易者。 那些基于多个指标构建复杂策略的人。 任何需要灵活的信
FREE

This indicator finds Three Drives patterns. The Three Drives pattern is a 6-point reversal pattern characterised by a series of higher highs or lower lows that complete at a 127% or 161.8% Fibonacci extension. It signals that the market is exhausted and a reversal can happen. [ Installation Guide | Update Guide | Troubleshooting | FAQ | All Products | Get Help ] Customizable pattern sizes
Customizable colors and sizes
Customizable breakout periods Customizable 1-2-3 and 0-A-B ratios
It impl
FREE

The Supply and Demand with Swap zones MTF indicator is a powerful tool for technical analysis that has been modified and enhanced to provide traders with even more valuable information. This tool is based on the rule of supply and demand and allows traders to analyze a chart on three different timeframes at once, providing a more comprehensive view of the market. One of the key features of this indicator is the so-called swap zones, which are areas that have been broken through by the price but
FREE

CustomMultiBarFractal Indicator Description
Overview The CustomMultiBarFractal indicator identifies and displays fractal patterns on price charts. Fractals represent significant price reversal points that can serve as signals for trading strategies.
Key Features - Detects fractals based on a user-defined analysis period - Displays upper and lower fractals with customizable colors - Allows offset adjustment from price extremes - Provides flexible visualization settings - Support
FREE

Multi Time Frame Indicator acts as a Scanner based on the Ichimoku Trading System. The outcome is displayed on a board. This helps you to make "at a glance" a mental picture of the System without having to open the chart. Up to 10 Currencies can be watched. Scanned elements And Legend "KUMO Futur" - Green : The Kumo Futur is Bullish. "KUMO Futur" - Red : The Kumo Futur is Bearish. "PRICE Cross KJ" - Green : The Price is Above the Kijun Sen. "PRICE Cross KJ" - Red : The Price is Below the Kijun
FREE
交易时段 3:可视化全球市场活动 交易时段 3 是一款直观的 MQL5 指标,旨在清晰显示关键的日内交易时段: 亚洲、伦敦和纽约 。全面了解全球市场活动,并精确定位波动性增加的时期,以便做出战略性交易决策。 主要特点: 全球时段可视化: 直接在您的图表上轻松识别亚洲、伦敦和纽约时段的活跃交易时间。 波动性洞察: 了解在每个时段内,哪些货币通常会经历最显著的价格变动: 亚洲时段: 澳元 (AUD)、新西兰元 (NZD) 和日元 (JPY) 货币对通常波动性较高。 伦敦时段: 英镑 (GBP) 和欧元 (EUR) 货币对的波动性增加。 纽约时段: 美元 (USD) 通常是此交易时段波动性最大的货币。 可自定义交易时间: 使用灵活的 HH:MM 输入字段,根据您的特定需求调整时段时间。 可选显示日期: 选择在一周中的哪些天显示交易时段,以便进行有针对性的分析。 输入: 亚洲时段开始/结束: (例如, 00:00 , 09:00 )- 设置亚洲时段的开始和结束时间。 伦敦时段开始/结束: (例如, 08:00 , 17:00 )- 设置伦敦时段的开始和结束时间。 纽约时段开始/结束: (例如,
FREE

Multi Timeframe Indicator Suite 把更高时间周期的移动平均线、通道、一目均衡表 (Ichimoku)、VWAP 和振荡指标显示在您交易的 MetaTrader 4 图表上。H4 的一目均衡表云图、日线移动平均线和四重随机指标 (quad stochastic) 可以同时放在一张 M15 图表上,每个指标都按自己的周期计算,无需切换图表就能看到大周期的走势。振荡指标显示在主图底部的指标栏 (dock) 中,而不是子窗口(副图)里。 功能 每个条目单独设置周期。 每个指标都有自己的周期、参数和颜色,同一个指标可以添加多次。 指标栏位于图表内。 振荡指标叠放在主窗口底部、由您设定大小的区域内,K 线始终显示在它们上方。 完整的一目均衡表。 转换线 (Tenkan)、基准线 (Kijun)、先行带 A 和 B、向前平移到价格前方的云图,以及迟行线。 锚定 VWAP。 可锚定到日、周、月、季、年,或您输入的日期和时间,可选显示一倍和两倍标准差通道。点击图表或切换周期都不会移动锚点。 预设。 内置布局,例如 Ichimoku Trend、Scalper、Swing 和
FREE
Forex and Gold OBI is an innovative indicator based on a study of price and market dynamics, utilizing the RSI indicator. This indicator helps you find the best moment to enter the forex market by signaling when the market is in overbought or oversold conditions. Moreover, The indicator calculates two possible targets and the stop loss for each trade, allowing you to optimize your risk/reward ratio. Price This indicator is easy to use and set up, working with any currency pair and timeframe. If
FREE
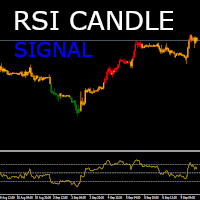
RSI Candle Signal Indicator will change bars’ color when set overbought or oversold levels reach.
How to Use RSI Candle Signal Uptrend/Downtrends - RSI may be used to detect trending markets. For example, the RSI may stay above the mid line 50 in an uptrend. Top and Buttoms - RSI may help in identifying the tops around the overbought readings (usually above 70), and the bottoms around the oversold area (usually below 30). Divergence - divergence occurs when RSI directional movement is not co
FREE

Awesome AO 4-Color AUTO REFRESH Indicator Advanced Momentum & Zero-Cross Visualization Tool for MT4 The Awesome AO 4-Color AUTO REFRESH indicator is a powerful upgraded version of the classic Awesome Oscillator designed for professional Forex traders who want cleaner momentum visualization, automatic chart marking, and better trade confirmation. Built by FXSignalSpot , this indicator transforms the standard AO into a more advanced trading assistant by adding: 4-color momentum histogram logic Aut
FREE

Force Index MTF 是经典力度指数(Force Index)振荡器的进阶实现,增强了多周期(MTF, Multi-Timeframe)能力。它通过计算价格变动与成交量的乘积,量化市场波动背后的原始力量,帮助交易者区分显著的趋势延续与轻微的回调。
作为一款动量-成交量振荡器,Force Index 衡量买方和卖方的力量。正值表示买盘压力占主导(吸筹/accumulation),负值表示卖盘压力占主导(派发/distribution),而零轴穿越则预示市场控制权可能发生转变——常被用于识别回调的结束。
本指标包含一个独立的 MTF 引擎,让您无需切换窗口,即可在当前图表上直接监控任意更高周期(HTF)的 Force Index 数据。它提供双模式灵敏度:短周期(例如 2)高度灵敏,适合在日内交易中捕捉短期回调;标准周期(例如 13)数据更平滑,针对波段趋势和结构转变进行了优化。彩色编码的柱状图让市场压力一目了然,优化的输出缓冲区(output buffers)使本指标可与智能交易系统(Expert Advisor / EA)连接。
在实际使用中,本指标可作为趋势跟随过滤
FREE

FTU báichī gāi zhǐbiāo shìyòng yú MT4 píngtái, kěyǐ dāndú shǐyòng, dàn zuì hǎo yǔ qítā zhǐbiāo huò cèlüè jiéhé shǐyòng jiéhé MACD,ADX děng duō zhǒng zhǐbiāo huìzhì jiàntóu, tíshì jìn chǎng huò qūshì biànhuà zài YouTube shàng guānkàn jiǎnduǎn de jièshào shìpín: Https://Youtu.Be/lCRJ3mFNyOQ zhǐbiāo tèdiǎn: Mài chū hé mǎi rù jiàntóu shìjué hé shēngyīn jǐngbào qūshì yánxù/zǎoqí qūshì biànhuà xìnhào xīn gōngnéng: Xiànzhì lìshǐ zhù de shùliàng gēnggǎi jiàntóu yǔ tiáo de jùlí yòngtú: Gāi zhǐbiāo kěyòn
FREE
Optimize your trading strategy of your custom indicators with the "Indicator Combiner Into One Indicator". This advanced tool combines multiple indicators, including your custom indicators, into a single, user-friendly interface. It generates an arrow signal based on your custom indicators, simplifying your decision-making process. Ideal for traders of all levels, this indicator offers:
Arrow Signals : Get a clear, single arrow signal that combines insights from your custom indicators, mak
FREE
Trend Signal PRO – Professional Trend Detection System Introduction
The Trend Signal PRO is an advanced MetaTrader indicator that brings precision, transparency, and professionalism to your technical analysis.
With permanent arrows, intelligent confirmations, and automated risk management, it is designed for traders who demand accuracy and consistency. Core Features High-Precision Signals Permanent colored arrows that never repaint Intelligent multi-layer confirmation system Customizable trend
FREE

Engulfing Overlap Zone MT4 by RWBTradeLab
A clean, non-repainting engulfing OVERLAP detector for MetaTrader 4 — the most selective member of the RWBTradeLab engulfing family. It finds the rare, high-interest moment when a FAILED engulfing zone is overlapped by a CONFIRMED opposite engulfing zone: trapped traders on one side, fresh confirmed pressure on the other, both at the same price area. Every overlap is sorted into 8 types and graded by how much price the two zones actually share. All fro
FREE
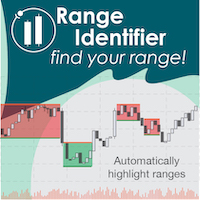
Whether trading stocks, futures, options, or FX, traders confront the single most important question: to trade trend or range? This tool helps you identify ranges to either trade within, or, wait for breakouts signaling trend onset.
Free download for a limited time! We hope you enjoy, with our very best wishes during this pandemic!
The issue with identifying ranges is some ranges and patterns are easy to miss, and subject to human error when calculated on the fly. The Automatic Range Identifi
FREE

The volume weighted average price (VWAP) is a trading benchmark used by traders that gives the average price a security has traded at throughout the day, based on both volume and price. VWAP is calculated by adding up the dollars traded for every transaction (price multiplied by the number of shares traded) and then dividing by the total shares traded. You can see more of my publications here: https://www.mql5.com/en/users/joaquinmetayer/seller
FREE

G2 ENTRY SIGNAL by Ida Bagus Putu Mahardika STRATEGY DESCRIPTION G2 Entry Signal is a professional multi-strategy entry dashboard that combines top-down analysis with 3 proven trading strategies in one powerful indicator. Designed for traders who demand clarity, accuracy, and actionable signals, this tool filters market noise and delivers high-probability entry opportunities directly on your chart. KEY ADVANTAGES 1. 3 STRATEGIES IN ONE DASHBOARD Strategy 1 – London Session Breakout: Capt
FREE

How To Trade
Execute your trades in 3 Easy Steps!
Step 1: Trade Setup Entry Buy in Line color Blue Touch on line color Red. Entry Sell in Line color Blue Touch on line color Green. Success Rate ≥ 80% 100:20 depend your experience and fast your take. Step 2: Set Stop Loss Stop loss BUY ----> You can not put stoploss with a fixed price, your speed in determining the closing request------>Line color Blue Touch on line color Green. Stop loss SELL ----> You can not put stoploss with a fixed price, yo
FREE

This indicator calculates directly the value of the dollar index by using the ICE formula to plot the chart, this can help you as reference. You do not need your broker to provide the ICE DX to use this indicator, is a way to have it calculated. Little discrepancies could be found in the exact value of the candles or time due closing time of the trading floor and the use of decimals, but generally will give you good reference. You need your broker offers the feed for the following pairs in orde
FREE

用于M5图表的交易指标。
该指标帮助交易者快速评估当前市场中多空双方的实力对比。它以双色柱状图(柱形图)的形式显示在价格图表下方的单独窗口中:
蓝色柱形图——看涨区域(价格可能上涨)。
红色柱形图——看跌区域(价格可能下跌)。
该指标能够平滑随机波动,并显示整体市场情绪。柱形图越高,信号越强。柱形图颜色从蓝色变为红色(或反之亦然)可以作为入场交易的信号。
工作原理:
对于每个柱形图,计算最近N根K线价格范围内的平均价格((最高价+最低价)/2)。
该值经过特殊滤波器(指数平滑)处理,以消除过度波动。
然后,信号再次被转换和平滑,最终形成一条围绕零点波动的平滑曲线。如果该曲线位于零点上方,则柱形图为蓝色(多头);如果低于此值,则显示为红色(熊市)。
指标设置:
强度(默认值 20)——此数值表示指标分析用于确定最高价和最低价的K线数量。数值越低,指标对局部波动越敏感(反应速度更快,但可能产生错误信号)。数值越高,信号越平滑可靠,但会有延迟。对于5分钟图表,14-20 为最佳值。
Alpha(默认值 0.1)——信号平滑系数。它决定了指标遗忘旧数据并对新数据做出反应
FREE

Galaxy Force Analyzer - is an intelligent indicator for analyzing market volume and strength. It combines data from indicators like Force, OBV, MFI, AD, and others with advanced algorithms for acceleration and filtering to show the energy of price movement — the moment when a trend gains strength or begins to weaken. The indicator doesn’t just display volume — it measures impulse power, acceleration, and the speed of pressure changes between buyers and sellers.
Signals: Everything on the chart
FREE

It is a custom non-repaint indicator to identify trade opportunities in swing action as prices move within an upper and lower band. Inspired by the Keltner Channel, the most popular channel Indicator introduced by Chester Keltner. It is different with a Bollinger Bands. It represents volatility using the high and low prices, while Bollinger's studies rely on the standard deviation. The algorithm for this indicator is also available in the EntryMaximator EA. Including the option to use it or not.
FREE
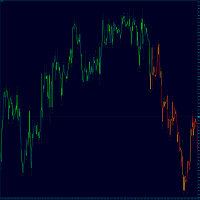
TrendFinder VolumeI are Colored candlesticks showing the trend based on Volume and Slope of Trend
This indicator will give you the color change on the next bar on the confirmation candle and will never repaint Lime Green = Possible Buy (Volume up), Teal Green = Bullish Weak (Volume Decreasing), Red = Possible Sell (Volume up) , Orange = Bearish Weak (Volume Decreasing)
TrendFinder Volume is optimize to trade on any market and to be used trending and None trending markets. For best results use
FREE
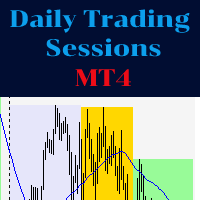
The indicator represents the session boxes for the Asian, European and American sessions. It is possible to change the time of each session, such as color. It is also possible to disable the display of each session. You will find in input parameters variables to modify time sessions in format hh:mm and the color of boxes of each sessions. If you need some implementations please contact me.
FREE
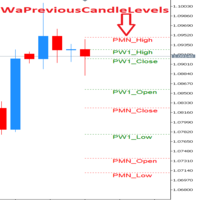
WaPreviousCandleLevels MT4 shows the previous candle levels, it shows the previous candle Open High Low Close levels (OHLC Levels) in different time frame. It's designed to help the trader to analyse the market and pay attention to the previous candle levels in different time frame. We all know that the OHLC Levels in Monthly, Weekly and Daily are really strong and must of the time, the price strongly reacts at those levels. In the technical analysis, the user can use them as a support and res
FREE

Всем привет. Предлагаю на обозрения очень достойный индикатор входы очень четкие можно по мартину отрабатывать 30 мин до и после новостей не торгуем можно накинуть индикатор новостей больше вам не чего не надо есть сигнал стрелка за крепилась на следующую входим Экспирация любая валюта тоже любая. осцилляторы и авторский алгоритм.И еще можно через бот авто торговля на скрине.И еще друзья после приобретения или аренды пишем мне свои контакты я вам помогу все настроить что бы работало на авто то
FREE

Calculation of Lot Size for many traders is a big challenge.
A case that is very important in money management. What many traders ignore.
Choosing an appropriate Lot Size in trades can improve results and it will ultimately lead to success.
This indicator calculates the authorized Lot Size for your trades.
The indicator uses the following values to get the appropriate Lot Size for positioning:
The distance of Stop Loss.
The Pip Value.
The amount of Risk Allowed For Each Trade.
The amoun
FREE
具有多时间框架支持、可自定义视觉信号和可配置警报系统的平均趋向指数(ADX)指标。
免费编程服务、更新及其他 TrueTL 产品请访问 MQL5 个人主页 。
非常感谢您的反馈和评价!
什么是 ADX? 平均趋向指数(ADX)由 J. Welles Wilder 开发,是一种技术指标,用于衡量趋势的强度,而不考虑其方向。ADX 由正向指标(+DI)和负向指标(-DI)衍生而来,但只显示强度,不显示方向。 ADX 值介于 0 到 100 之间。一般来说,低于 20–25 的值表示趋势弱或无趋势(横盘市场),而高于 25 的值则表示趋势强劲。超过 50 的值表示趋势非常强劲。ADX 在识别市场是处于趋势还是横盘整理阶段时特别有用,帮助交易者决定采用趋势跟踪策略还是区间交易策略。与方向性指标不同,无论是上涨趋势还是下跌趋势增强,ADX 均会上升。 功能特点: 带箭头标记和垂直线的视觉信号标记 具有可配置触发条件的三个独立信号缓冲区 信号检测选项:方向变化、水平线穿越、峰值/谷值 每个信号可配置警报功能(邮件、推送、声音、弹窗) 支持插值方法的多时间框架(MTF)功能 直方图或折线绘制模
FREE

MASi Three Screens is based on the trading strategy by Dr. Alexander Elder. This indicator is a collection of algorithms. Algorithms are based on the analysis of charts of several timeframes. You can apply any of the provided algorithms.
List of versions of algorithms:
ThreeScreens v1.0 - A simple implementation, with analysis of the MACD line; ThreeScreens v1.1 - A simple implementation, with analysis of the MACD histogram; ThreeScreens v1.2 - Combines the first two algorithms in
FREE

产品描述
CM Ultimate MA MTF V2 是一款高度优化的双移动平均线技术指标,专为 MetaTrader 4 平台原生开发。它在同一图表上显示两条独立的移动平均线(短期和长期),并采用自适应三色趋势可视化,可即时追踪市场动能的变化。
该指标利用高性能的多时间框架 (MTF) 技术,为交易者提供清晰、无噪声的趋势方向,且不会引入终端滞后。
主要技术优势
严格的 4 缓冲区架构:采用精确的 4 个内部指标缓冲区(2 个用于数据图,2 个用于颜色索引),确保完全符合 MT5 的布局架构。
双移动平均线汇合:通过两条主要趋势线过滤市场噪声,简化您的图表:
Ultimate MA 1(短期):图表宽度 4(实线)——对即时价格波动高度敏感,专为精准把握市场入场时机而设计。
终极移动平均线 2(长期):线宽 2(虚线)——作为动态支撑/阻力锚点和宏观趋势边界。
自适应三色可视化:线条颜色根据斜率和变化率计算自动调整:
浅绿色:强劲上涨动能(上升斜率)
红色:强劲下跌动能(下降斜率)
青色:中性动能或横盘整理(状态不变)
真正的多时间框架 (MTF) 引擎:将
FREE
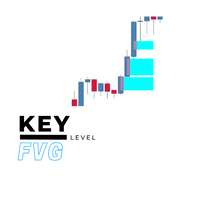
Key Level FVG Tired of manually scanning your charts for Fair Value Gaps (FVGs)? The Key Level FVG is a powerful and easy-to-use tool designed to automatically detect and display these critical price imbalances for you. Based on popular smart money concepts, this indicator highlights high-probability areas where the price is likely to return, providing you with clear and actionable trading zones. Whether you're a seasoned price action trader or just starting with FVG analysis, this indicator wi
FREE
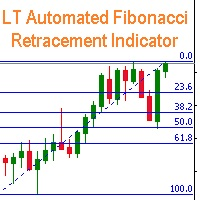
Fibonacci Retracement object is an object that has been provided by metatrader 4 platform. But Fibonacci Retracement object doesn't automated adjust the chart. You have to put and manage it manually to the chart. Because of that, this indicator was created. If you like using filbonacci retracement indicator, highly recommended to use Automated Fibonacci Retracement Indicator if you want to get better result in here:
https://www.mql5.com/en/market/product/95515
LT Automated Fibonacci Retraceme
FREE
交易实用必备工具指标 波浪自动计算指标,通道趋势交易 完美的趋势-波浪自动计算通道计算 , MT4版本 完美的趋势-波浪自动计算通道计算 , MT5版本 本地跟单复制交易 Easy And Fast Copy , MT4版本 Easy And Fast Copy , MT5版本 本地跟单复制交易 模拟试用 Easy And Fast Copy , MT4 模拟账号运行 Easy And Fast Copy , MT5 模拟账号运行
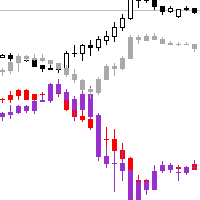
可以设置其他周期品种的K线图 覆盖到本窗口中,观察到关联性波动 品种名留空则放弃显示该品种
"Cooperative QQ:556024" "Cooperation wechat:556024" "Cooperative email:556024@qq.com"
FREE

此指标显示世界主要市场的当前时间。它也显示当前时段。 使用非常容易。它不会占用太多图表空间。 它可以与 EA 或其它面板一起工作, 比如 虚拟交易板 。 此版本在图表上显示模拟时钟。 Dear friends and users of our EAs, please add your ratings in the Reviews section. All updates to our forex software are free ! This is a free trading utility! 其它功能: 输入参数中有一个选项: 显示/隐藏鼠标覆盖按钮提示, 您也可以选择提示的语言英语 / 俄语; 关闭按钮终止此应用程序; 最大化/最小化按钮在图表上缩放格板; 格板可以在图表上移动。要想移动,在面板上部靠近关闭和最小化按钮的地方用鼠标拖拽,移动到期望的位置。 Expforex,Vladon,Indicator,Utility
FREE
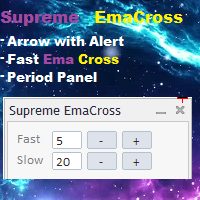
Supreme EmaCross是一个基于两条指数移动平均线交叉的指标,它根据ema交叉生成买入和卖出箭头,并在信号出现时发出警报,该指标不会重新绘制或回画,并且箭头不会延迟,该指标具有快速的特点。 EMA 周期更改面板,交易者可以在不进行指标设置的情况下更改 EMA 值,该面板是可移动的。
=================================================== ====
参数 :
快速周期:快速 EMA 周期
慢周期:慢 ema 周期
通知和警报设置
EMA 线开/关
ema 线颜色
EMA 十字箭头开/关
ema十字箭头颜色
=================================================== =========
FREE

Use GANN 369 to use a combination of 30's,60's,90's time to cross 3's,6's,9's. Any larger combination of these cross smaller combinations of these
Using GANN 369 Method for Trading Reversals The GANN 369 method, inspired by the works of W.D. Gann and Nikola Tesla's 3, 6, 9 numerical patterns, can be employed to identify potential reversals in financial markets. By combining specific periods (30, 60, and 90) with the numbers 3, 6, and 9, traders can seek opportunities for trend changes.
FREE

is designed to enhance the visual representation of financial charts in MetaTrader 4 by dynamically altering the colors of various chart elements, including candlesticks, bars, line charts, and volume bars. Its primary purpose is to improve trader intuition and engagement during market analysis by introducing smooth, cyclical color transitions that can highlight momentum shifts, trends, or volatility without overwhelming the display. This functionality is particularly beneficial for traders who
FREE

WAD 背离 + 随机指标 概述 WAD 背离 + 随机指标是一款技术分析工具,用于帮助交易者识别潜在的市场反转点。它结合价格行为与动量确认,以突出买卖压力可能变化的区域。 该指标直接显示在图表上,并提供清晰的视觉信号,帮助在快速变化的市场中做出决策。
工作原理 该指标分析价格走势与市场内部压力之间的关系,并应用额外的确认过滤条件。当条件满足时,会在图表上用箭头标记潜在交易区域。 蓝色箭头表示可能上涨 红色箭头表示可能下跌 每个信号均在多个条件满足后生成,以减少噪音。
主要特点 收盘后信号不重绘 实时信号生成 内置入场、止损和目标位显示 可选趋势过滤器 适用于多种品种和周期
使用方法 1. 入场信号 等待K线收盘后出现箭头: 蓝色箭头表示可能买入 红色箭头表示可能卖出 建议在下一根K线开盘时入场。 2. 风险管理 止损根据市场波动自动设置 提供多个止盈目标 交易者可以: 分批止盈 或手动管理交易 提高 SDC_Multi 至 3 或启用 EMA 过滤器可提升信号质量 所有参数均可自定义 3. 市场条件 高周期分析 支撑与阻力位 4. 建议使用 适合日内交易 适用于多种市场 结合风
FREE

Dynamic Trend Follower 主图指标深度解析:双均线变色 + 金叉死叉标记 + 买卖信号 + 趋势转换 + 强势金/死叉 指标概述 Dynamic Trend Follower 是一款专为 MT4平台 设计的高品质主图均线交叉综合信号指标。它突破了传统单一均线或简单交叉的局限,通过整合 双均线趋势变色系统 、 金叉死叉"+"标记与差值百分比 、 买卖信号箭头 、 趋势转换提示 以及 强势金叉/死叉识别 ,结合均线状态判定和多层信号标注机制,在主图上直观呈现市场趋势方向、交叉爆发点和关键反转预警。其核心价值在于利用多维度均线算法融合和信号过滤机制,帮助交易者在复杂行情中精准识别高概率的趋势跟随和反转机会。 1. 核心信号系统 1.1 双均线趋势变色系统 短期均线(Short MA) — 线宽2:上涨 lime绿色 / 下跌 红色 / 走平 蓝色 长期均线(Long MA) — 线宽3:上涨 lime绿色 / 下跌 红色 / 走平 蓝色 交易意义 :通过颜色直观判断均线方向,绿色代表多头趋势,红色代表空头趋势,蓝色代表
FREE

Limited-time free initial release. Williams Vix Fix Capitulation Signals MT4 is free while MetaCoderStore collects trader feedback. Please leave a product comment with symbol, timeframe, alert, or buffer requests you want prioritized. Williams Vix Fix Capitulation Signals MT4 turns the classic Williams Vix Fix volatility-spike idea into a clean two-sided MetaTrader indicator with optional arrows, trigger bands, and EA-readable signal output. Use cases Spot potential capitulation exits after shar
FREE

在您的平台上提供新版 MT4 标准指标的目的,是在子窗口里显示多时间帧的相同指标。参看下面例中的图片。 但是它的显示不像简单的多时间帧指标。它是指标在其时间帧的实际显示。 在 FFx 指标里提供了一些选项: 选择显示的时间帧 (M1 至 每月) 定义每个时间帧箱体的宽度 (柱线数量) 提示弹出/声音/邮件/推送 (价格穿越中带 和/或 上边/下边带) 直接在图表上激活/停用提示 修改所有颜色 ... 当然还有所有标准指标的常用设置 如何设置提示: 在弹出的参数设置 : 选择您希望的提示和模式 (弹出、声音、邮件或推送通知) 之后在图表上 : 选择铃铛图标 (双击) 然后将其拖拽到任意位置。在下一个报价来临,它将恢复它的原始位置,但用不同颜色信号改变它的状态。红到绿意为它现在已激活 … 绿到红意为它现在未激活。
FREE

Investment Castle 支撑与阻力 — 自动买卖位
不再手动绘制支撑与阻力。该指标自动为您标出关键的买入和卖出价位,并按方向为K线着色,让市场倾向的一侧一目了然。它与 Investment Castle EA 内置的支撑与阻力引擎完全相同。
它能为您做什么 自动买卖位: 支撑与阻力自动检测并绘制——无需手动画线。 方向颜色提示: K线默认买入变蓝、卖出变红(可在参数中调整)。 更快决策: 立刻看清价格可能反应的位置以及偏向哪个方向。 体系的一部分: Investment Castle EA 的支撑与阻力核心,与心理关键价位配合使用。 处处适用: 任何品种、任何周期。
适合人群: 希望获得干净、客观的支撑/阻力位而免去手动绘图的交易者。
风险提示: 交易存在重大亏损风险。请务必先在模拟账户上测试,并使用您能接受的风险设置。过往表现不代表未来结果。
FREE
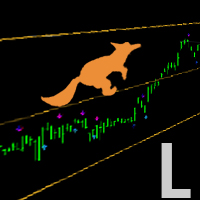
Search for an entry with low risk for trading by Lisek Moving Average Indicator. There are many ways to trade with Lisek Moving Average Indicator: Trend continuation (Trend trading). Trade pullbacks (Range trading). Trade breakouts. Trade reversals. Take profits or set stop-loss based on your MA.
Moving Averages are a frequently used technical indicator in forex trading, especially over 10, 50, 100, and 200 periods. Moving Averages are lagging indicators, which means they don't predict where p
FREE
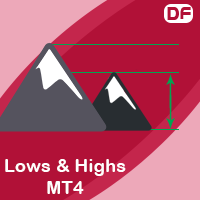
This indicator draws on the chart high and low prices of different periods . And If you want, Indicator can alert you when the current price arrive these levels. Alert Options: Send Mobil Message, Send E-mail, Show Message, Sound Alert Time Periods: M1, M5, M15, M30, H1, H4, D1, W1, MN Inputs: TimeShift: You can set start hour for calculating. And that way you can see levels independently from broker server's time-zone. PipDeviation: You can set price sensibility for alert (Default: 3) Lines
FREE

The MP Andean Oscillator is used to estimate the direction and also the degree of variations of trends. It contains 3 components: Bull component, Bear component and Signal component. A rising Bull component indicates that the market is up-trending while a rising Bear component indicates the presence of down-trending market. Settings: Oscillator period: Specifies the importance of the trends degree of variations measured by the indicator. Signal line per: Moving average period of the Signal line
FREE

The indicator gives buy or sell signals based on the Parabolic SAR indicator, and it also contains strategies with Moving Average. There are alerts and alerts to the mobile terminal and to the mail. Arrows are drawn on the chart after the signal is confirmed. They don't redraw. I recommend watching my advisor - Night Zen EA
To keep up to date with my latest products and ideas, join my telegram channel and subscribe to my profile. The link in my profile contacts - My profile The indicator in
FREE

The indicator displays overbought and oversold levels, calculating them using the Fibonacci golden ratio formula.
It enables both trend-following and counter-trend trading, accommodating breakouts and rebounds from these levels.
It operates on all timeframes, across various currency pairs, metals, and cryptocurrencies.
Suitable for binary options trading.
Key Features: Based on the Fibonacci golden ratio Shows overbought and oversold levels Suitable for market and pending orders Simple
FREE

Smart Liquidity Zones (SLZ) — Your All‑in‑One SMC/ICT Radar for MT4
Why SLZ? Tired of squinting at charts trying to spot liquidity grabs, break‑of‑structure candles and Fair Value Gaps before the smart‑money sharks do? SLZ turns your chart into a tactical map —drawing every high‑probability zone and screaming (politely) when price dives in. Core Edge Powered by a rule‑set distilled from Smart Money Concepts (SMC) and ICT mentorship material, SLZ auto‑marks: Component What it shows Why it
FREE

WHAT IS NEXT MOVE? SIMPLE ANSWER IS, THIS PROGRAM IS BASED ON PRICE ACTION THEREFORE FINDING NEXT MOVE IS EASY TO IDENTIFY THIS PROGRAM IS USING STANDARD CALCULATIONS FOR SUPPORT RESISTANCE IN SHAPE OF 2 WAYS TREND LINES SELECT HORIZONTAL LINES TREND LINES WILL GUIDE TRADERS TO TRADE IN RANGE WITH PIVOT LEVEL ALSO HORIZONTAL LINES GUIDE YOU ABOUT SUPPORT RESISTANCE OF DIFFERENT TIMEFRAMES FOR EXAMPLE: IF TRADER INTERESTED TO TRADE IN 15 MINUTES TIME FRAME, THEN HE CAN SELECT 15 MINUTES IN PR
FREE

每位交易者都熟悉这个流程:打开指标设置、改一个数字、点击确定、盯着图表看、觉得不对、再打开设置。如果您在 MetaTrader 4 上交易,这件事您已经做了很多年 — 而在这些来回的对话框中,没有哪个指标比 RSI 更折腾。周期用 14 还是 9?水平线放 70/30 还是 80/20?RSI Live Tuner 终结了这个流程。 这是一个可以 直接在图表上实时调节 的相对强弱指数。图表上有一个小面板,带有 RSI 周期和两条水平线的滑块。拖动滑块,指标会立刻重新计算并重绘,就在您眼前完成。14 还是 9、70/30 还是 80/20,这些问题在您自己的行情上几秒钟就有答案,不必去翻论坛帖子。 可选的 MA 信号线。 可直接在面板上开启或关闭 RSI 的移动平均线,用独立滑块设置其周期,并用一个按钮循环切换算法 — SMA、EMA、SMMA、LWMA。每一次更改都会立即反映在图表上。 自有 RSI 实现,而非套壳。 本指标采用自己实现的标准 Wilder RSI — 真正的 Wilder 平滑平均涨跌幅,并与标准 RSI 做过数值校验 — 所以您调的就是您看到的。不重绘。 还有实时样
FREE
您知道为什么MetaTrader市场是出售交易策略和技术指标的最佳场所吗?不需要广告或软件保护,没有支付的麻烦。一切都在MetaTrader市场提供。
