适用于MetaTrader 4的免费技术指标 - 17
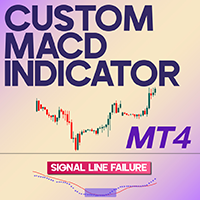
Custom MACD Indicator for MetaTrader 4 The Custom MACD Indicator for MetaTrader 4 is a powerful analytical tool used widely in technical trading to evaluate trend momentum, direction, and strength. It consists of two essential elements:
• MACD Line (blue): Derived from the gap between two exponential moving averages
• Signal Line (red): A smoothed average of the MACD line, aiding in pinpointing trend reversals with greater accuracy. «Indicator Installation & User Guide»
MT4 Indicator Installat
FREE

This indicator is designed to detect high probability reversal patterns: Double Tops/Bottoms with fake breakouts . This is the FREE version of the indicator: https://www.mql5.com/en/market/product/26371 The free version works only on EURUSD and GBPUSD! Please read also the blog post " Professional Trading With Double Tops/Bottoms And Divergences! " which explains the concepts behind the ULTIMATE Double Top/Bottom indicator and how you can use a professional top-down approach. The provided video
FREE

The parabolic stop and reverse (PSAR) indicator was developed by J. Welles Wilder, Jr. as a tool to find price reversals which can be utilized as stop-loss levels as well as trade triggers. The notable difference about the PSAR indicator is the utilization of time decay. The PSAR indicator forms a parabola composed of small dots that are either above or below the trading price. When the parabola is below the stock price, it acts as a support and trail-stop area, while indicating bullish up t
FREE

经过7年的时间,我决定免费发布一些我自己的指标和EA。
如果您觉得它们有用,请 通过五星评级表达支持!您的反馈将继续带来免费工具! 也查看我的其他免费工具 这里
_________________________________ 波林格带宽度指标——高级市场波动性分析工具 在MQL4中精心开发的波林格带宽度指标,是一款先进的工具,旨在提升外汇交易分析的水平。它利用波林格带测量波动性的能力,为交易者提供关于市场动态和潜在交易场景的关键洞见。 喜欢这个免费指标吗?请用五星评价来表示支持!您的反馈是我们提供免费工具的动力! 主要特点: 精准波动性测量 : 计算波林格带宽度(上带 - 下带)/ 中带,准确评估市场波动性。 市场状况洞见 : 识别战略性交易所需的高波动性(潜在突破)和低波动性(市场整合)时期。 全面趋势背景 : 加强对市场趋势的理解,较宽的带表明更大的波动性和潜在趋势强度。 与交易策略集成 ️: 作为各种交易策略的有价值组成部分,尤其是与其他指标结合时,用于细致分析。 使用和信号解读: 设置 ️: 轻松将波林格
FREE
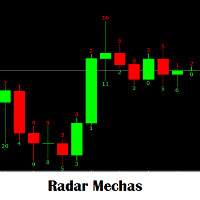
指示器,用于根据生成警报以进行手动输入的大小来查看离开蜡烛的灯芯的大小。 最大限度地利用它,策略会造成与前一根蜡烛或同一根当前蜡烛的烛芯大小相同的真空。 进入买卖。 它是对新条目进行的任何分析所必需的指标。 这将是您最喜欢的工具。 Zhǐshì qì, yòng yú gēnjù shēngchéng jǐngbào yǐ jìnxíng shǒudòng shūrù de dàxiǎo lái chákàn líkāi làzhú de dēngxīn de dàxiǎo. Zuìdà xiàndù dì lìyòng tā, cèlüè huì zàochéng yǔ qián yī gēn làzhú huò tóngyī gēn dāngqián làzhú de zhú xīn dàxiǎo xiāngtóng de zhēnkōng. Jìnrù mǎimài. Tā shì duì xīn tiáomù jìnxíng de rènhé fēnxī suǒ bìxū de zhǐbiāo. Zhè jiāng shì nín zuì xǐhuān de gōngjù.
FREE

Now there is no need to check volatility on third-party websites in order to determine the average movement rage of a certain currency pair. The Truly Volatility indicator is designed for determining volatility for the specified period and is displayed in a separate window as a histogram and line. If attached to a chart with the Н1 timeframe, the indicator displays the average price movement for each hour (from 0 to 23) based on the history data. On the D1 timeframe it displays the average movem
FREE

The Colored MACD indicator is a versatile and powerful tool designed to enhance your technical analysis by providing an intuitive visualization of market momentum and trend changes. Built on the foundation of the popular Moving Average Convergence Divergence (MACD) indicator, this version introduces color-coded histograms to easily distinguish between bullish and bearish momentum. Key Features: Color-Coded Visualization : The indicator features a lime-colored histogram when the MACD is above the
FREE

*This is tradingview indicator converted to mql5*
The Trend Magic Indicator is a popular technical analysis tool used to identify the direction of a market trend and potential trend reversals. It is a versatile indicator that can be applied to various financial instruments and timeframes. The Trend Magic Indicator consists of a combination of moving averages and a volatility-based filter. It aims to smooth out price fluctuations and provide a clearer visualization of the underlying trend. Here
FREE

The indicator displays the size of the spread for the current instrument on the chart. Very flexible in settings. It is possible to set the maximum value of the spread, upon exceeding which, the color of the spread label will change, and a signal will sound (if enabled in the settings). The indicator will be very convenient for people who trade on the news. You will never enter a trade with a large spread, as the indicator will notify you of this both visually and soundly. Input parameters: Aler
FREE

What does this do? It shows you on the chart which stop belongs to which entry. Have you ever had multiple positions or trades open on a single pair and were confused which stop loss goes with what entry? Even worse, the stop loss orders for buy and sells are the same color on the chart. Well, your problem has been solved! This indicator will show you which stop belongs to which entry. It will place a vertical line and an arrow on the chart for each open trade. A yellow line connects the entry
FREE
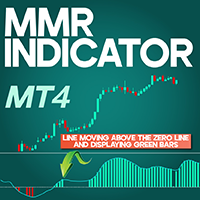
MMR Indicator MetaTrader 4 The MMR Indicator on MetaTrader 4 integrates four key technical analysis tools: MACD, EMA, LWMA, and RSI. Its output is visualized as a histogram, displaying potential entry points with green and red bars based on the prevailing market trend.By combining these four analytical tools, the MMR Indicator reduces signal noise and offers a clearer perspective on market conditions. «Indicator Installation & User Guide»
MT4 Indicator Installation | MMR Indicator MT5 | A
FREE

Volatility under control. The indicator shows the optimal depth for setting goals within the day and on the average trend. It also builds pivot zones for the estimated correction depth. As an accompaniment, the key levels of the structure are displayed for several timeframes. Classical volatility indicators ATR & ADX on fixed timeframes are used for calculation. The calculation takes into account the spread, and if the market is slightly volatile, you will see a warning about the risk. You can c
FREE

MQLTA Candle Timer is an indicator that can show you the details about a symbol/pair and alert you before the close of a candle. Used in swing trading and not only, it can help your strategies knowing and be ready before the close of a candle.
How does it work Simply add the indicator to the chart and set the notifications options. You can load a minimalistic interface or a full interface. The alert will be sent once per candle.
Parameters All the parameters, that you can see in the picture, a
FREE

The indicator displays crossing zero level by Moving Average of Oscillator (OsMA) in the form of arrows. The indicator notifies about a signal by means of a pop-up Alert window, or sending notification to e-mail.
Parameters Fast EMA Period - fast EMA. This is an exponential moving average from a price with a short period. Slow EMA Period - slow EMA. This is also an exponential moving average of a market price but with a longer period. Signal SMA Period - MACD SMA. This is a signal line which is
FREE

Indicator draws Round Number lines by distance of pips. 1. You can enable / disable indicator to show / hide the lines. 2. You can set distance of pips between the lines. 3. You can edit the number of lines. 4. You can edit properties of lines by inputs (style (DASH, DOT, SOLID, ...) , width (1 for DASH, DOT, 2 is not for DASH, DOT, it only SOLID), color). When indicator is deleted from the chart, the lines will be removed.
FREE

An indicator for visualizing time ranges of key trading sessions: Asian, European, and American. The indicator features functionality for setting the start and end times of each trading session, as well as an adjustable timezone of the trading server. The main advantages of the indicator include the ability to operate with minimal CPU load and memory usage. Moreover, it offers the option to specify the number of displayed historical days, providing the user with flexible market dynamics analysis
FREE
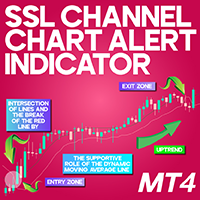
SSL Channel Chart Alert Indicator for MetaTrader 4 The SSL Channel Chart Alert Indicator is an MT4-based tool that leverages Moving Averages (MA) to help traders analyze price movements. This indicator is composed of two Moving Average lines-one green and one red -calculated based on price highs and lows. «Indicator Installation & User Guide»
MT4 Indicator Installation | SSL Channel Chart Alert Indicator MT5 | ALL Products By TradingFinderLab | Best MT4 Indicator: Refined Order Block In
FREE

The Sextet is an MT4 indicator that displays 6 levels of Moving Averages, where the second is the moving average of the first, the third of the second, and so on. It gives a signal when all the moving average levels align in order. Get a Free Sextet EA, and read discussions about using The Sextet Indicator on Forex Factory:
The Sextet EA @ Forex Factory Check out the The Sextet Scalper Pro for a more elaborate scalping strategy also with Free EA . Key Features: Is a Moving Average of a Movin
FREE
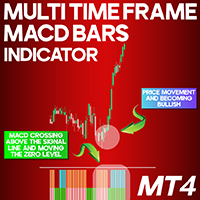
Multi-Time Frame MACD Bars indicator for MetaTrader 4 The Multi-Time Frame MACD Bars indicator for MetaTrader 4 (MT4) is an advanced trading tool built on the foundation of the MACD indicator. It enables users to interpret market momentum by presenting MACD data across several timeframes in a multi-colored histogram. By leveraging its visual color cues, traders can gain clearer insights into market direction and potential turning points, helping refine trade entries and exits. The flexibility to
FREE

CCI Histogram Indicator for MetaTrader 4 The CCI Histogram Indicator is a refined version of the Commodity Channel Index (CCI), tailored specifically for the MetaTrader 4 platform. It helps traders monitor price deviations and offers visual cues for identifying potential Buy and Sell signals across various financial markets. «Indicator Installation & User Guide»
MT4 Indicator Installation | CCI Histogram Indicator MT5 | ALL Products By TradingFinderLab | Best MT4 Indicator: Refined Order
FREE

Bollinger Breakout Trader tells the trader when the market is about to breakout from a non-volatile period. Non volatility usually means its building up steam for more good moves in future. A signal is formed when this switch from non-volatile to volatile occurs. These periods are measured by both Bollinger Bands and Keltner Channels. Bollinger Bands measure the standard deviation of price from the Moving Average which results in an expanding and contracting channel. Keltner Channels are based o
FREE

M1Arrows is a MT4 trend arrows Indicator
* Smart Scalper Setup (M1) :: Signal 5 Main 20 + Signal 20 Main 80 + Fibonacci ZigArcs 20
(Screenshot1) Add the indicator with first setting,
then add it again to the same graph with other settings.
You can add as many as you want, but 2 M1Arrows in just one graph is enought
Never open orders againt the slow setting trend
Do not open more than 3 orders per slow setting trend
It will work better in Europe/USA markets, * M15 Day Trade Setup: Signal 20 ma
FREE

This is an indicator detecting trend direction. It uses the popular Bill Williams Alligator. It shows market state on all timeframes on one chart. As is well known, traders gain the main profit on the Forex market trading by trend, and losses usually occur when the market is flat. So, in order to gain profit a trader should learn to detect trend market and direction of a current trend in a rapid manner. This indicator has been developed for this purpose. MTF Alligator helps to: Profitably trade
FREE

The script tries to determine the overall direction of the market, using smoothed Heiken Ashi candles. The coloring system (using bright and dark colors) is an attempt to detect strong market and weak market conditions. There's also an oscillator within the script
These are the features: Alert condition Features: You can now set alerts in the alert dialog for events like trend switch, trend strengthening and weakening; all for both Bullish and Bearish trend.
I also added the code for custom a
FREE

The Currency Strength Lines (CSL) indicator is a very useful tool for both beginners and experienced traders. It is able to calculate the strength of single currencies and show them on a chart, so that you can see the trend and spot trading opportunities.
How does it work? The CSL Indicator will run calculations on all the 28 pairs, resulting in the overall strength across the market of individual currencies at any given moment. You can use this data to spot currencies that are strong, getting
FREE

图表覆盖 指标在同一张图表上显示几种工具的价格走势,使您能够评估货币对相对彼此波动的差异。 [ 安装指南 | 更新指南 | 故障排除 | 常见问题 | 所有产品 ]
轻松找到超买或超卖的货币对 在同一图表上绘制最多六个货币对 必要时显示倒置符号 适应图表大小,缩放和时间表 自动价格水平计算 可定制的价格水平密度 可自定义的颜色和尺寸
什么是反向货币对? 反转货币对意味着显示两种货币之间的汇率,从而反转交易的主要货币。例如,如果要将EURUSD,GBPUSD和USDJPY绘制到同一覆盖图中,则有必要反转USDJPY以使价格反映反向汇率:JPYUSD。这样,日元/美元价格将与覆盖图的其他两个符号呈正相关关系移动,从而使图表更易于研究。
测试指标 该指标使用来自多个交易品种的价格数据绘制单个图表。由于MetaTrader 4测试仪(在撰写本文时)不支持多货币回溯测试,因此该指标无法回溯测试,因为它将不会收到来自其他本应覆盖的交易品种的报价。要测试它,请租用一个月。
输入 符号设置-键入要在覆盖图上显示的货币对或符号的名称。您需要至少输入其中之一,以便覆盖图具有两个货币对(本机和外
FREE
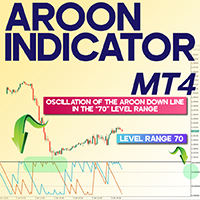
Aroon Oscillator in MetaTrader 4
T he Aroon Indicator, featuring two distinct colored lines, is a dependable tool in MetaTrader 4 for identifying market trends in both bullish and bearish conditions. Displayed in a separate panel below the main chart, it measures trend strength on a scale from 0 to 100. The positioning of the Aroon Up and Aroon Down lines provides clear signals for potential Buy or Sell opportunities. «Indicator Installation & User Guide»
MT4 Indicator Installation | Aroon I
FREE

An “inside bar” pattern is a two-bar price action trading strategy in which the inside bar is smaller and within the high to low range of the prior bar, i.e. the high is lower than the previous bar’s high, and the low is higher than the previous bar’s low. Its relative position can be at the top, the middle or the bottom of the prior bar.
The prior bar, the bar before the inside bar, is often referred to as the “mother bar”. You will sometimes see an inside bar referred to as an “ib” and its m
FREE

Developed by Etienne Botes and Douglas Siepman, the Vortex Indicator consists of two oscillators that capture positive and negative trend movement. In creating this indicator, Botes and Seipman drew on the work of Welles Wilder and Viktor Schauberger, who is considered the father of implosion technology. Despite a rather involved formula, the indicator is quite straightforward to understand and easy to interpret. A bullish signal triggers when the positive trend indicator (VI+ green line) crosse
FREE

Pivot Classic, Woodie, Camarilla, Fibonacci and Demark
Floor/Classic Pivot points, or simply pivots, are useful for identifying potential support/resistance levels, trading ranges, trend reversals, and market sentiment by examining an asset's high, low, and closing values. The Floor/Classic Pivot Points can be calculated as follows. Pivot Point (P) = (High + Low + Close)/3 S1 = P * 2 - High S2 = P - (High - Low) S3 = Low – 2*(High - P) R1 = P * 2 - Low R2 = P + (High - Low) R3 = High + 2*(P - L
FREE

In a departure from the conventional approach, traders can leverage the bearish engulfing candlestick pattern as a buy signal for short-term mean reversion trades. Here's how this alternative strategy unfolds: The bearish engulfing pattern, (typically signaling a reversal of bullish momentum) , is interpreted differently in this context. Instead of viewing it as a precursor to further downward movement, we perceive it as an indication of a potential short-term bounce or mean reversion in prices.
FREE

速度阻力线是确定趋势和阻力线的有力工具。 该指标使用图表极值和特殊的数学公式构建线条。 该指标可用于确定趋势方向和枢轴点。
<---------------------------->
指标参数:
"Depth of search" -搜索图表极值的深度(以条形为单位) "Back step of search" -极值之间的最小距离(以条为单位) "Deviation of price" -同一类型极端之间的允许价格差异 "Line color" -带有相应索引的线条颜色 "Line style" -带有相应索引的线条样式 "Line width" -具有相应索引的线宽 <---------------------------->
你可以在"艾德森*古尔德的稀有作品集"一书中找到更多信息,也可以在私人信息中与我联系。
<---------------------------->
提前感谢所有有兴趣的人,祝你好运征服市场!
FREE
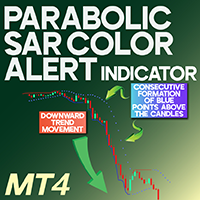
Parabolic SAR Color Alert Indicator MT4 The Parabolic SAR Color Alert Indicator MT4 applies dynamic-colored dots to visually represent the direction of the market trend. In this indicator, the dots appear either above or beneath the candlesticks to signal momentum shifts. Specifically, blue dots below the candles highlight bullish movement, while pink dots above the candles confirm bearish momentum. «Indicator Installation & User Guide» MT4 Indicator Installation | Parabolic SAR Color Alert In
FREE

GAP DETECTOR
FVG in trading refers to "Fair Value Gap", . It is a concept used in technical analysis to identify areas on a price chart where there is a discrepancy or gap between supply and demand. These gaps can occur due to rapid movements in price, usually as a result of important news or economic events, and are usually filled later as the market stabilizes. The GAP DETECTOR indicator is designed to identify fair value gaps (FVG) on the price chart and filter them using volatility to dete
FREE

The Spots Indicator can be used for Entering and Exiting your trades based on the common candlestick patterns such as: engulfing, hanging man, doji etc. It is designed to publish desktop and mobile notification every time a signal is triggered. However, it is worth noting that this indicator is recommended to be used with other indicator for confirming the entries. It is best to use it with the Investment Castle Trend Lines indicator and the Supply and Demand indicator
FREE
TMA_KC PRT is non-redrawn channel indicator and can be used to identify trend and support and resistance levels.
Indicator settings allow you to assign a specific coefficient to each price channel, which makes it possible to narrow or expand each channel separately. The TMA_KC PRT indicator is a multicurrency instrument, so the choice of a timeframe depends solely on the trader’s preference. TMA_KC PRT indicator can be used on any time frame, so you can easily make the indicator an i
FREE

Aroon Classic 指标概述 Aroon Classic 指标是一种技术工具,可定量识别图表上趋势的出现和持续性。它使用两条线——“Aroon Up”和“Aroon Down”——在 0–100 范围内显示趋势强度和转折点。Aroon Up 值越高,表示上升趋势越强;Aroon Down 值越高,表示下降趋势越强。 主要特点 直观区分趋势的形成和反转 可自定义计算周期(默认:14) 灵活设置线条颜色、宽度和样式 指标参数 参数 说明 默认值 Period 用于 Aroon 计算的周期条数 14 Aroon Up Color Aroon Up 线的颜色 DodgerBlue Aroon Down Color Aroon Down 线的颜色 Tomato Line Width 线条宽度(像素) 2 计算方法 Aroon Up 根据指定周期内自最高点以来的条数计算,公式如下:
Aroon Up = ((Period – BarsSinceHighestHigh) / Period) × 100
同理,Aroon Down 根据自最低点以来的条数计算:
Aroon Down = ((P
FREE

Questo indicatore avanzato è un potente strumento progettato per aiutare i trader a identificare i livelli chiave di supporto e resistenza nel mercato. Questo indicatore è versatile e offre un'interfaccia personalizzabile e intuitiva, consentendo ai trader di scegliere tra sei diversi metodi di calcolo del punto pivot: Classic, Camarilla, Woodie, Floor, Fibonacci, Fibonacci Retracement.
FREE
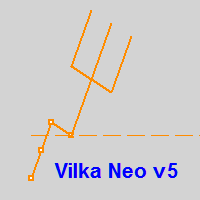
Вилка Нео v5, разрабатывалась для торговой системы "Оракул", но постепенно дополнялась, например - углами Ганна и другими опциями...
Можно создавать графические объекты с заданным цветом, стилем и толщиной, такие как: прямоугольники с заливкой и без, отрезки трендлиний и нестандартный инструмент - "вилка Нео" в виде трезубца, так же есть возможность интерактивно настраивать цветовую палитру прямо с графика, настраивать видимость объектов для разных ТФ, толщину и стили... Панель переключается кла
FREE

MACD is well known indicator that still can be use for prediction where price will go next few minutes, hours or even weekly With colored bar of Macd, your eyes can easily catch when color is changed based what market price movement to find any early trend on market. here is the parameter of the indicator: TF_MACD , default is 1 Hour , this mean you can see clearly MACD of 1 Hour TimeFrame on Lower TimeFrame. InpPrice , default is Price Close , this is original MACD parameter from Metaquotes st
FREE

This indicator helps you to scan all symbols which are in the Market Watch window and filter out a trend with alerts. It works on five most effective indicators which are used by most of traders for trading: Moving Average Average Directional Moment (ADX) Relative Strength Index (RSI) Parabolic SAR MACD It calculates two bars for scanning. When box colour changes to coral or royal blue colour, it indicates you for trend change for long and short entry. And also you will get alert on screen. When
FREE

Forex Target Zones Indicator – Master Key Support & Resistance Levels
Unlock the power of precise trading with the Forex Target Zones Indicator, the ultimate tool for identifying high-probability buy and sell zones based on previous weekly and daily highs and lows. Designed for both scalpers and swing traders, this indicator highlights critical levels where price is likely to react, giving you a competitive edge in the forex market.
Key Features: Smart Weekly & Daily Zones – Instantly
FREE
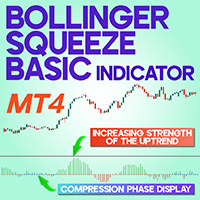
Bollinger Squeeze Basic Indicator for MT4
The Bollinger Squeeze Basic indicator is built on the concept of market compression. When Bollinger Bands fall within the channels of the Keltner indicator, it may indicate a short-term decline in volatility and the likelihood of a strong price move.
This technical analysis tool visualizes squeeze conditions and volatility changes through colored bars and dots in the oscillator window. «Indicator Installation & User Guide» MT4 Indicator Installati
FREE

Cat趋势VZ是一个不断改进的指标,具有准确和有利可图的入场信号。
Cat Trend vz指标线根据趋势方向改变颜色,指标在价格反转点绘制箭头。
此外,Cat趋势VZ指标实现了关于箭头外观的声音和文本警报。
重要提示:指标不重绘。
猫趋势VZ的主要特点: 分析函数
它可以在任何货币对和时间框架上使用; 指标不重绘; 这是其他指标的一个很好的补充; 不需要过滤器进入; 图形功能
占据图表上最小数量的位置; 柔性酊剂; 简单易学;
猫趋势VZ的主要特点: 设置
长度-平滑深度; 相位是在-100内变化的参数。.. +100,影响过渡过程的质量; 移位-指示器沿时间轴的移位; 输入价格海关-计算指标的价格选择(0-"关闭",1-"开放",2-"(高+低)/2",3-"高",4-"低"); JMA移动线No.1-设置JMA的第一个移动平均线; JMA移动线2号-设置第二个JMA移动平均线; CCF移动平均线-设置CCF移动平均线; Cjcf移动平均线-设置CJCF移动平均线; 平均周期MA-平均MA的周期; 计数条-要读取的条数; 线路显示
行-显示行真/假;
FREE
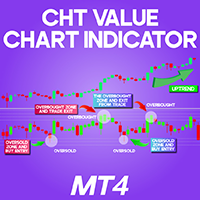
CHT Value Chart Indicator for MetaTrader 4 The CHT Value Chart Indicator is a powerful tool available on the MetaTrader 4 platform, designed to help traders identify overbought and oversold market conditions. This indicator provides a dynamic value chart, offering visual cues for potential trading opportunities. Using color-coded bars or candles displayed in the oscillator window, the CHT Value Chart Indicator highlights significant price reversal points . This enables traders to
FREE

the AK CAP toolbox free to use;
it includes the same indicators we use for our daily trading and we think the simpler the better. Lightweight indicator for use on all timeframes. that includes VWAP with vwap value indicator on top right. 3 EMA: FAST, MEDIUM, SLOW the candle timer to show how much time left in a candle.
colors and positions are fully customizable.
enjoy
FREE
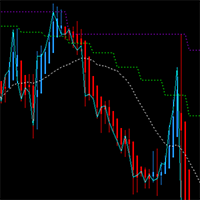
This MT4 chart trend checker cuts through the noise of market volatility to provide a clearer picture of trends and price movements. It includes the following features that can provide more clarity during market assessments: 1 customizable multi-period moving average Optional Heikin-Ashi candles 3 switchable focus modes Distinct colors for easy analysis
Link to MT5 version: https://www.mql5.com/en/market/product/106707/
This indicator shows your preferred moving average from multiple time fram
FREE
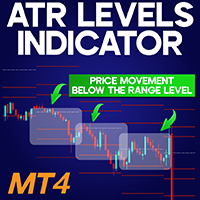
ATR Levels Indicator (ATRL) for Download MetaTrader 4 The ATR Levels Indicator (ATRL) is a dynamic tool designed for the MetaTrader 4 (MT4) platform that displays significant price zones based on the 20-period daily Average True Range (ATR) . This indicator draws six levels: three plotted above and three below a midline derived from recent market data. The ATRL is ideal for determining logical areas to place stop loss (SL) and take profit (TP) orders. The central level is based on the average of
FREE

RoundNumbers indicator is a simple and powerful psychological price levels. Trader usually use these levels as a Support and Resistance (SnR). Indicator Input: Levels - Numbers of levels drawn on chart. Default 30 levels. BoxSize - Box size drawn on each levels, indicate buffers around levels. Default value 1pips (10point) above and below each levels. ZoneSize - Distance between each levels, default value 10pips (100point). Style & Colours - User inputs customization.
For MT5 version, please re
FREE
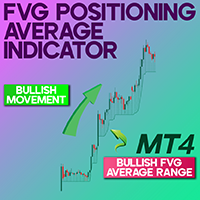
FVG Positioning Average Indicator MT4 The Fair Value Gap Positioning Average Indicator is built upon Smart Money methodology, providing traders with a clear visual of dynamic bullish and bearish zones derived from the average positioning of Fair Value Gaps. These zones highlight significant market reaction points, enabling traders to spot high-probability trading opportunities. «Indicator Installation & User Guide» MT4 Indicator Installation | FVG Positioning Average Indicator MT5 | ALL Prod
FREE

If you like this project, leave a 5 star review. Often times we are using brokers that are outside of the GMT-0 timezone, this
not only complicates things, but, it can make seeing when a trading session starts
a bit more difficult than it should. This indicator allows you to set a timezone offset it will draw a vertical line for the: Day. Week. Month. Quarter. year.
FREE
通过 Pip Movement Alert MT4 领先市场动能,这是一款多币种指标,专为跟踪和提醒交易者多个符号的精确点数移动而设计,适用于外汇、股票、加密货币和商品交易。在 Forex Factory 和 Reddit 的 r/Forex 等交易社区中备受赞誉,并在 Investopedia 和 TradingView 的讨论中因其检测突发市场变化的能力而受到关注,该指标是希望利用快速价格变化的交易者的必备工具。用户报告称,识别基于点数的重大移动(例如,10点增量)的可靠性高达95%,许多人指出通过利用实时警报捕捉波动性激增,交易时机提高了20-30%。主要优势包括多币种监控、可定制的点数阈值以及轻量级设计,无需持续分析图表即可简化跟踪,非常适合剥头皮、日内交易和波段交易者。 Pip Movement Alert MT4 监控用户定义的符号(默认:EURUSD、GBPUSD、USDJPY、USDCHF),并在价格移动指定点数值(默认:10点)时触发警报,检测绝对价格水平(例如,1.178500、1.178600)。它使用实时计算来识别上升或下降移动,通过弹出窗口、推送通知和电子邮件
FREE

MetaTrader indicator that detects WRBs (Wide Range Bodies/Bars) and Hidden Gaps.
WRB Hidden Gap MetaTrader indicator detects WRB and marks it. WRB can be either a Wide Range Bar (a very large bar) or a Wide Range Body (a candlestick that has a very long body). WRB alone do not provide much information so the indicator uses WRB to detect Hidden Gaps. The indicator also displays filled and unfilled Hidden Gaps in a different way, making it easier to view the market situation at a glance
FREE

动信道。 通道宽度会根据价格变动自动变化。 与通道中间的偏差越大,边界变得越宽。 指标调整到您设置的图表部分的运动( " Bars for calculations " 参数). 因此,如果价格在给定的时间间隔内出现大幅波动,该通道将扩大,预计会出现进一步的强烈波动。 也就是说,它的参数将始终对应于当前的市场情况。
该频道不打算用于历史数据分析! 要检查其可操作性,请在测试仪中运行它!
通道既变宽又变窄,这取决于以前的动作。 这些移动取决于"周期"参数。 如果您设置"Bars for calculations"=200,那么通道将调整到最后200个柱的运动。 通道的上下边界将接近或移开,这取决于"周期"先前移动的最大偏差。 因此,价格越早偏离中线,通道就越宽,随着运动的平静,通道就会变窄。 与此同时,通道的本质保持不变-边界平均偏离均值线(TSF),但平均速度取决于价格变化率。 价格越快接近通道边界,它的扩展就越快。
您可以将其用作常规通道,无需自动扩展。 为此,请将"速度"参数设置为"固定"位置,并使用"宽度通道"参数手动设置通道宽度。
该指标基于一种方法,该方法在
FREE

UzFx-Total TP'SL & Timer-MT4 指标旨在实时跟踪所有未平仓和挂单交易的总获利(TP)和止损(SL)值。此外,它还包括一个蜡烛倒计时器,用于显示当前蜡烛收盘的剩余时间。
(访问简介并查看所有其他 MT4/MT5 产品) (请不要忘记给予评论)
主要功能:
自动计算所有有效交易和挂单的预期总盈亏。 显示当前蜡烛收盘的剩余时间,帮助交易者有效管理进出场。 用户可以配置文本颜色、字体大小和位置,以提高可视性。 设计简单轻便,不会使图表变得杂乱无章。
用户输入: 选择止盈和止损显示的颜色。 自定义蜡烛计时器文本颜色。 调整字体大小和在图表上的位置。 使用案例:
️ 适合希望快速了解风险和收益水平的交易者,无需手动检查每个订单。 ️ 适合依赖蜡烛收盘时间来精确执行交易的剥头皮交易者和日间交易者。 ️ 通过对潜在盈利和亏损水平的一目了然,加强风险管理。
FREE

Graphic Shapes -using history, it projects four types of graphical shapes at the moment, allowing you to determine the main ranges of price movement in the future, as well as gives an understanding of the main market reversals, while giving entry points by priority!The panel contains three types of figure sizes expressed by timeframes. They allow you to conduct a complete market analysis without using additional tools! The indicator is a powerful tool for forecasting price movements in the forex
FREE
指标功能:完成十字光标跟随,多个窗口鼠标位置的同步显示。 功能 开启 :点击"H"标签,标签变成"S",开启十字光标,通过鼠标点击,完成第二个以上窗口的位置同步。 可以大周期同步小周期 (注意:在大周期同步小周期时,要注意小周期中的数据是否足够多) , 也可以小周期同步大周期。 功能关闭:点击 "S"标签,会变成"H"。或者通过键盘的"ESC"键,关闭。
指标可以多个窗口加载,也可以单窗口加载。
参数设置: LabWindow:标签显示的窗口 LabConer :标签显示的角落位置 LabX :标签位置横坐标 LabY :标签位置竖坐标 LabShowBackup :标签背景显示于背景 LabFontName :标签的字体名称 LabFontSize :标签的字体大小
FREE
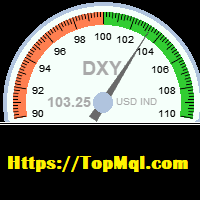
This indicator is used to calculate the dollar index according to the formula of currency pairs(EURUSD ,GBPUSD,USDJPY,USDSEK,USDCHF,USDCAD)Even if the broker does not have the dollar symbol. this Indicator displays the dollar index chart in a separate window at the bottom of the chart. It also displays the current dollar index graphically. In this indicator, it is possible to set the minimum and maximum value of the indicator as well as its size scale on the chart as an input parameter, and it
FREE
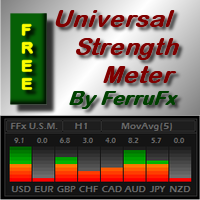
PRO version is available here: https://www.mql5.com/en/market/product/12648 FFx Universal Strength Meter is more than a basic strength meter. Instead of limiting the calculation to price, it can be based on any of the 19 integrated strength modes + 9 timeframes. With the FFx USM, you are able to define any period for any timeframe. For example, you can set the dashboard for the last 10 candles for M15… Full flexibility! Very easy to interpret... It gives a great idea about which currency is weak
FREE
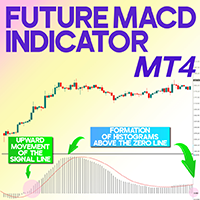
Future MACD Indicator for MT4 The Future MACD Indicator for MT4 represents an enhanced form of the classic MACD tool, specifically developed to forecast future price actions. This MetaTrader 4-compatible oscillator shifts signal outputs forward in time, assisting traders in spotting potential reversal zones and entry opportunities earlier. «Indicator Installation & User Guide»
MT4 Indicator Installation | Future MACD Indicator MT5 | ALL Products By TradingFinderLab | Best MT4 Indicator:
FREE

ATR Pyramid ️:您的门票,助您堆积利润高过打了兴奋剂的叠叠乐塔 ,将市场波动转化为趋势冲浪 ️和加仓派对 ,只有第一笔交易有翻船风险 ,而您通过像电梯一样上移止损 来保护其余交易,创造一个舒适区,这是让您的外汇账户增长速度超过喝了浓缩咖啡的兔子的唯一真正途径!!! 注意了,所有利润堆积者和趋势冲浪者! ️ 这个 ATR Pyramid 指标是为那些喜欢建立金融金字塔的人准备的(我们保证是合法的那种 )。 你知道人们怎么说ATR只显示市场波动性吗? 好吧,情节转折 – 这不是全部! 这个巧妙的小工具实际上能比咖啡因上头的猎犬还快地嗅出趋势方向。 猜猜怎么着?我们用它来堆积利润,就像在自助餐厅一样。 ️ 但等等,还有更多! 要建立一个像吉萨金字塔一样宏伟,甚至更高的金字塔,我们建议您查看最大的做市商在做什么。怎么查?使用来自 glimpz.net 的 Glimpz 指标! ️️ 这就像有一个秘密窗口,可以洞察市场巨头的想法。不要逆流而上,要和大鱼一起乘风破浪!
FREE

This indicator is the author's implementation of the classic indicator Parabolic Support and Resist (PSAR). A time-tested product that allows you to not only determine entry/exit points but also reasonable levels for setting protective stop orders. The indicator has two customizable ranges, which allows you to identify long-term and short-term trends. The indicator does not repaint on the data history. The indicator has the ability to give signals and send notifications about them to e-mail and
FREE
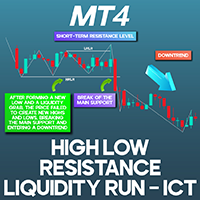
HRLR & LRLR ICT Indicator for MT4 The High Resistance Liquidity Run (HRLR) and Low Resistance Liquidity Run (LRLR) indicators are valuable tools for tracking price activity in liquidity zones, built on the ICT trading methodology . The HRLR indicator detects liquidity accumulation after the price establishes its lowest low. This phase initiates a sequence of higher lows and higher highs, indicating the start of an upward trend . Conversely, the LRLR indicator identifies price movements advancing
FREE
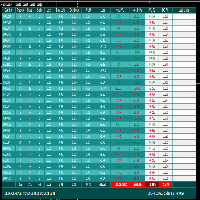
FCK Trade Report This indicator was developed by Fx Candle King. BEFORE CHOOSE CUSTOM PERIOD, GO TO TERMINAL WINDOW (ctrl+T), right click on ACCOUNT HISTORY and CHOOSE ALL HISTORY. This report searches the filtered data in your ACCOUNT CURRENT & HISTORY TRADE, Select your timespan for the report open and closed trades etc... Chose the report type - List only OPEN orders / List only CLOSED orders / List both OPEN and CLOSED orders
FREE

*This is TradingView indicator converted to mql4*
The SuperTrend V indicator is a popular technical analysis tool used to identify trends and potential trend reversals in financial markets. It is based on the concept of the SuperTrend indicator but incorporates additional features and variations. The SuperTrend V indicator uses a combination of price action and volatility to determine the trend direction and generate trading signals. Here are the key components and features of the indicator: Ca
FREE
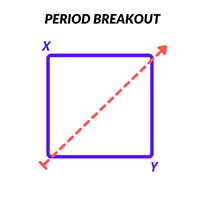
Overview
The Period Breakout Indicator is a versatile tool designed for traders seeking to identify breakout opportunities based on customizable time periods. This indicator automatically determines the highest and lowest prices within a user-defined period, allowing you to tailor it precisely to your trading strategy. Key Features
Customizable Time Periods: Define the start and end times based on your preferred trading hours or any specific period. The indicator will then calculate the highest
FREE

The indicator uses the Chester W. Keltner's channel calculation method, modified by the well-known trader Linda Raschke. Due to the modification, the calculated channel contains a much more complete overview of the price movements, which allows increasing the probability of an accurate prediction of the upcoming price movement. Unlike the classic Keltner method, the base line of the channel is plotted based on the Exponential Moving Average, and the Average True Range is used to calculate the up
FREE

概述 真正强弱指数 (True Strength Index, TSI) 指标是一种动量振荡器,在 MT4 的独立窗口中显示。它通过两次指数移动平均 (EMA) 平滑动量 (MTM) 及其绝对值,然后计算两者的比值并乘以 100。TSI 有助于可视化市场趋势的强度和潜在的转折点。 主要功能 双重 EMA 平滑,减少噪音,呈现更清晰的曲线 信号 EMA 叠加,辅助判断买卖时机 自动缩放至 –100 至 +100 范围内 在 0 和 ±50 位置绘制水平线,提升可读性 支持自定义快速 EMA、慢速 EMA 和信号 EMA 周期 安装方法 在 MT4 中选择“文件”→“打开数据文件夹”。 将 TSI.mq4 复制到 MQL4\Indicators 文件夹。 重启 MT4,或在“导航”面板中右键单击并选择“刷新”。 在指定图表上,依次点击“插入”→“自定义”→“TSI”,调整参数后点击“确定”。 参数说明 变量 默认值 说明 FastEMAPeriod 7 第1阶段(快速)EMA 平滑 MTM 的周期 SlowEMAPeriod 7 第2阶段(慢速)EMA 进一步平滑的周期 SignalEMA
FREE
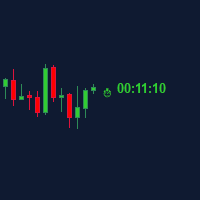
Candle Time (MT4) The Candle Time indicator shows the remaining time for the current candle on the active chart timeframe. It adapts automatically to the chart period and updates on every tick. This is a charting utility; it does not provide trading signals and does not guarantee any profit. Main functions Display the time remaining for the current candle on any timeframe (M1 to MN). Color-coded state: green when price is above the open (up), gray when unchanged, and red when below the open (do
FREE
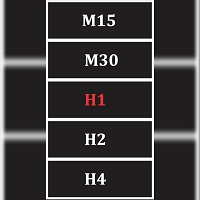
Seamlessly switch between 13 (9 mt4 default and 4 popular custom) time frame with this tool. Real ease of switching between default and custom time frames. Note indicator does not create custom time frame chart data, it only enables you to switch to and from them. Creating a custom time frame can be done using the default mt4 period converter script attached to a lesser default mt4 time frame. Example attach period converter on M1 and set period multiplier to 10 to have a custom M10 chart.
FREE
MetaTrader市场是独有的自动交易和技术指标商店。
阅读MQL5.community用户备忘更多地了解我们提供给交易者的独特的服务:复制交易信号,自由职业者开发的自定义应用程序,通过支付系统完成的自动付款和MQL5云网络。
您错过了交易机会:
- 免费交易应用程序
- 8,000+信号可供复制
- 探索金融市场的经济新闻
注册
登录