适用于MetaTrader 4的免费技术指标 - 16

Stochastic with Trend Filter: Precision Signals This is a powerful and easy-to-use indicator designed for traders who want more reliable signals from the classic Stochastic oscillator. How It Works: This indicator improves on the standard Stochastic by adding a powerful trend filter. It uses an Exponential Moving Average (EMA) to determine the overall direction of the market. The indicator will only generate a "buy" signal when both the Stochastic crossover is bullish and the price is above the
FREE

Free informative Indicator-helper. It'll be usefull for traders who trade many symbols or using grid systems (Averaging or Martingale). Indicator counts drawdown as percent and currency separate. It has a number of settings: Count deposite drawdown according equity value and send e-mail or notifications to user if DD more than set; Sending e-mail when max open orders reached; Shows price and remaining pips amount before MarginCall on current chart and Account generally; Display summary trade lot
FREE
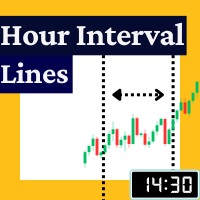
The Rayol Code Hour Interval Lines indicator was designed to assist your trading experience. It draws the range of hours chosen by the user directly on the chart, so that it enables traders to visualize price movements during their preferred trading hours, providing traders a more comprehensive view of price movements and market dynamics. This indicator allows the user to choose not only the Broker's time, but also the Local time. This way, the user no longer needs to calculate local time in re
FREE

Rsi indicator and Stochastic Combined into one indicator , the Supreme StochRsi doesnt repaint / Back-paint / delay. can be used as overbought oversold strategy , or trend following on 50 level cross. if you like this indicator please check my Supreme Trendhisto: here , and my Supreme Diamond indicator : here ========================================================================= Parameters : Stochastic K and D value , Stochastic period Rsi Period Rsi price ====================================
FREE

The Pivot Indicator is a vital tool for technical analysis used by traders in the financial markets. Designed to assist in identifying potential reversal points or trend changes, this indicator provides valuable insights into key levels in the market. Key features of the Pivot Indicator include: Automatic Calculations: The Pivot Indicator automatically calculates Pivot Point, Support, and Resistance levels based on the previous period's high, low, and close prices. This eliminates the complexity
FREE
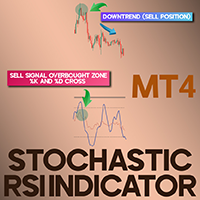
Stochastic-RSI Indicator for MetaTrader 4 The Stochastic RSI (StochRSI) indicator is one of the indicators in MetaTrader 4, which combines two popular indicators: The Relative Strength Index (RSI) and the Stochastic Oscillator. This indicator is designed to identify overbought and oversold points with higher sensitivity than the regular RSI. The StochRSI indicator consists of a blue line representing the RSI and a red dashed line representing the %D line of the Stochastic indicator. Values below
FREE

VArmadA的平衡输入
一个简单而强大的基于分形的支撑/阻力指标。
适用于1h及以上时间段,并对所有主要货币对进行测试。请注意信号。箭头表示多头或空头进入。
它是如何工作的。
箭头表示反向支撑/阻力。向上的箭头表示做多-向下的箭头表示做空交易。
操作说明:指标多头/指标空头
- 指标多头/指标空头:选择给定指标箭头的颜色。
- 显示阻力位。可视化用于确定进入信号的阻力位。
- 显示支撑位。可视化用于确定进入信号的支撑位。
..................................................................................................
FREE
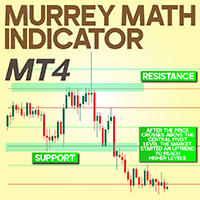
Murrey Math (MM) Indicator MetaTrader 4 The Murrey Math (MM) Indicator displays 13 horizontal support and resistance lines on the MetaTrader 4 (MT4) chart using six different colors, each representing a specific price level and function. At the center lies the blue pivot line—serving as the primary trend reference—with six lines above and six lines below it. When price trades above the pivot line, it suggests an uptrend; trading below the pivot line implies a downtrend. «Indicator Installation &
FREE

The Magic LWMA indicator is of great help in determining trend direction. It can be an excellent addition to your existing strategy or the basis of a new one. We humans can make better decisions when we see better visually. So we designed it to show a different color for rising and falling trends. Everyone can customize this in the way that suits them best. By setting the Trend Period, we can optimize it for longer or shorter trends for our strategy. It is great for all time frames.
IF YOU NEE
FREE

水平指标基于前一天的数据。 数学公式决定进场和出场水平。
交易建议。 在欧洲交易时段开始时,当波动出现时进行 Levels 交易。 在波动不足的情况下,使用一半的止盈位出场。 如果价格在一半止盈位反转,则在反转时也在一半止盈位寻找目标。 如果价格从进场水平反弹,那么在反方向上价格可以达到第二个止盈。
不应总是在突破时进场。建议等待回测(突破水平并从反方向测试)。 如果市场上有几个最低成交量水平,则回测效果很好。请参阅 UPD1 剖面水平指标。
输入参数 。
Start Hour - 一天从几点开始。 00 - 默认 。
Visual Button - 按钮显示(启用/禁用) 。 Corner - 按钮锚定角度 。 X indent - 以像素为单位的水平填充 。 Y indent - 以像素为单位的垂直填充 。
Label Visual - 显示级别标签 。 Label Font Size - 字体大小 。 Label Shift Bars - 在酒吧的铭文的缩进 。 Label Tooltip - 在关卡上方的光标下显示文本 。
FREE

基本主题构建器:简化您的图表自定义 通过 基本主题构建器 指标,彻底改变您的交易体验。这款多功能工具旨在简化您在MetaTrader 4 平台上自定义图表外观的过程。该指标提供了一个用户友好的面板,您可以轻松切换不同的主题和配色方案,提升交易环境的视觉吸引力和功能性。 Free MT5 version 基本主题构建器 指标是那些希望轻松个性化MetaTrader 4图表的交易者的终极工具。通过其简单的面板界面和各种主题预设,您可以迅速调整图表的外观,以匹配您的交易风格或心情。无论您偏爱经典外观还是现代美学,基本主题构建器提供了一系列选项,以增强您的视觉体验并提高专注度。立即优化您的交易设置,体验这款实用且易于使用的指标。
主要特点: 轻松管理主题: 使用便捷的面板界面,单击即可快速更改图表主题。 预定义预设: 从几种预配置的主题和配色方案中进行选择,包括经典、深色、浅色等,以适应您的交易偏好。 可自定义选项: 调整颜色和样式,按您的喜好定制图表外观。 用户友好界面: 享受简单直观的设计,无需复杂设置或配置。 提升交易专注度: 通过视觉吸引力强且无
FREE
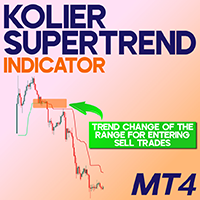
Kolier Supertrend Indicator for MetaTrader 4 The Kolier Supertrend Indicator for MetaTrader 4 serves as a trend-following tool designed to pinpoint directional movements and potential turning points in the market. It utilizes the ATR (Average True Range) value to determine volatility-based trend changes. With this trading utility on the MT4 platform, the indicator’s line shifts to green when an upward trend initiates, and flips to red when bearish momentum takes over. «Indicator Installation & U
FREE

As you know, the price always moves in a certain channel and when the price goes out of the channel, it always tends to return back to the trading channel The Ind Channel Exit indicator will help you not to miss the price going out of the channel It can show an alert or send a message to the terminal on your smartphone that the next bar has closed above or below the channel levels It has a minimum number of settings and the main parameter is the Channel Multiplier , which determines the width o
FREE

[Deviation of each indicator MT4]集合了18种指标,可以任意选择其中的一种指标来参与计算。能计算出各个指标的背离形态,并且可以提示警报。 参数设置说明: 【indicators】是选择18种指标里的一种参与计算 (这个参数非常重要) 。 【period】是每种指标公共的周期。 【Method】是某些指标的MA模式。 【Apply_to】是某些指标的应用价格。 【Fast_EMA】【Slow_EMA】【MACD_SMA】【K_period】【D_period】【Slowing】这些是部分指标需要的参数,需要这些参数的指标很少。 【Forward_disparity】是K线距离当前低或高的最小距离。 【Forward_count】是向前搜索的最大数。 【***Display form***】向下的是设置箭头和线的大小和颜色。 【alert_NO_OFF】:这是警报开关,设置成true,如果出现箭头就会自动警报提示;设置成false,则不会警报提示。 【sendmail_NO_OFF】:这是发送邮件的开关,设置成true,如果出现箭头就会发送邮件到你在MT4设
FREE

The tool that will help you calculate the lot accurately for the risk you need, if you want to risk 1% of your account, just enter the entry, target and stop values and you will have the lot size to use and only lose the chosen percentage. You can also choose a fixed value. This tool will help you with consistency, because you can only be consistent if you operate consistently and enter with fixed loss values, it is an INFALLIBLE way to be consistent!!!!
FREE
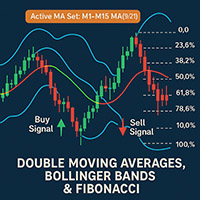
2 Moving Averages with Fibonacci And Bollinger Bands Author: Mir Mostofa Kamal
Version: 1.00
Platform: MetaTrader 4 (MT4) Overview 2 Moving Averages with Fibonacci And Bollinger Bands is a powerful, all-in-one custom indicator designed for traders who want to combine moving average crossover strategies with multi-time frame logic and Fibonacci retracement levels . It intelligently adapts its behavior based on the current chart time frame and adds visual and audible alerts when trading sign
FREE

The Hull Moving Average (HMA), developed by Alan Hull from 2005, one of the most fast-moving Average, reduce lag and easy to use to identify Trend for both Short & Long term. This Indicator is built based on exact formula of Hull Moving Average with 3 phases of calculation: Calculate Weighted Moving Average (WMA_01) with period n/2 & (WMA_02) with period n Calculate RAW-HMA: RAW-HMA = 2 * WMA_01(n/2) - WMA_02(n)
Weighted Moving Average with period sqrt(n) of RAW HMA HMA = WMA (RAW-HMA, sqrt(n)
FREE

Indicator measures strength of each currency in your list.
Main idea: It simply iterates through all combinations of pairs and adds difference between open and close in percent. Parameters: List of currencies - what currencies will be calculated (maximum is 8) Calculation type - from which data will be strength calculated Calculation data input - used as input related to calculation type Symbol suffix - used in case of suffix on symbols, e.g: when your symbols look like EURUSDm, EURUSDmicro etc
FREE

本产品接收指标/信号工具的信息,在满足特定条件时显示箭头或通知。
例如,当MA25和MA50交叉、SAR反转、MACD改变正负值或收盘价穿过布林线时,都会显示箭头和通知。
具体配置请参考示例设置图。
详细手册和配置文件:
https://www.mql5.com/en/blogs/post/755082
免费版本也可供下载。
箭头可以以多种配置显示,组合方式无限,任您想象。
如果您在设置与信号工具和指标的链接时遇到困难,请联系我们寻求帮助。
我们还可以向您的智能手机、电子邮件、Slack、Line、Discord等推送通知,最多添加8个参数,或根据您的要求单独链接到指标。您可以将其用作信号工具的补充或事件的通知功能。 https://www.mql5.com/zh/users/mt4kabukimono
FREE

The presented indicator, based on the volatility readings of a financial instrument plots dynamic S/R levels on the price chart. The indicator determines the trend and points to possible entry points formed by local highs/lows. The indicator allows you to notify the user of its signals by sending messages to the terminal and e-mail. The indicator does not repaint or recalculate. Signals when working with the indicator: The appearance of a red arrow above the price chart is a possible start of a
FREE

LotSize Indicator Discover the appropriate lot size to use in your trades based on the available margin. This indicator provides valuable information for risk management. If the indicator shows a value of 0, it means that your balance or available margin is insufficient for trading. It is important to maintain adequate margin levels for safe trading practices. This indicator is exclusively designed for the MT4 platform, a popular and reliable trading platform in the market. With the LotSize Indi
FREE

RSI Bands is a powerful indicator which displays an upper and lower band corresponding to the RSI overbought and oversold levels. The band shows what price must be reached during that specific candle in order for the RSI overbought/oversold level to be reached. This is an extremely useful tool for spotting when a trend has begun and when a trend is about to end. The indicator provides buffers, allowing you to use it in your own Expert Advisor. Please message me if you have any questions.
CURREN
FREE

This indicator is designed for calculating the value of points for the specified lot sizes. The MT5 version is here https://www.mql5.com/en/market/product/29230 Description by lines Line 1 - deposit currency. Line 2 - lot size (10 input parameters) . All further values are calculated into columns below each lot size. Line 3 - calculation of value for one point. Line 4 - calculation of value for spread. All subsequent lines - calculation of value for points (20 input parameters) . All you need t
FREE
Highly configurable Bollinger Bands indicator. Features: Highly customizable alert functions (at levels, crosses, direction changes via email, push, sound, popup) Multi timeframe ability Color customization (at levels, crosses, direction changes) Linear interpolation option Works on strategy tester in multi timeframe mode (at weekend without ticks also) Parameters:
Bollinger Bands Timeframe: You can set the lower/higher timeframes for Bollinger Bands. Bollinger Bands Bar Shift: Y ou can set
FREE
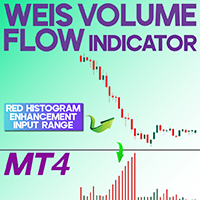
Weis Volume Flow Indicator MetaTrader 4 The Weis Volume Flow Indicator is an essential tool for analyzing trading volumes and understanding market behavior. As a sophisticated analytical tool, it combines volume and price data, enabling traders to detect the smart flow of volume within the market. This integration offers deeper insights into market dynamics and supports better trading decisions. «Indicator Installation & User Guide»
MT4 Indicator Installation | Weis Volume Flow Indicator MT5
FREE

FREE

Advanced Renko & Point & Figure Indicator for EURUSD Win/Loss Pattern Analysis + Smart Trade Timing This powerful indicator combines two proven strategies—Renko and Point & Figure (P&F)—into one comprehensive tool for analyzing EURUSD trends, recognizing patterns, and managing risk. With smart Box Size calculation (Fixed or ATR-based), moving average filters, and win/loss pattern detection, traders can make sharper, data-driven decisions. Key Features Hybrid Renko + P&F System Renko: Noi
FREE

Please refer to full version: https://www.mql5.com/en/market/product/140908
Key Zone Detector Key Level Supply & Demand Zone Detector Overview A sophisticated supply and demand zone detection indicator that identifies and rates key price levels where significant market activity occurs. The indicator uses fractal analysis and multiple validation methods to detect and classify trading zones. Key Features Zone Detection Auto-detects support and resistance zones Uses dual fractal system (fast and
FREE
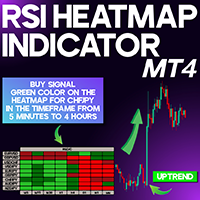
RSI Heatmap Indicator for MetaTrader4 The RSI Heatmap Indicator is a powerful technical tool in MetaTrader 4 that allows traders to assess the relative strength conditions of different currency pairs via a color-coded heatmap. By merging the Relative Strength Index (RSI) with a visual heatmap approach, this indicator simplifies market analysis by displaying strength and directional bias of multiple instruments at a glance. This indicator produces a heatmap based on calculated RSI levels across v
FREE

This simple indicator paints with a darker color on the volume bar when the quantity traded is above the average of select number of periods of the volume itself, highlighting the moments when there was a large volume of deals above the average. It is also possible to use a configuration of four colors where the color tone shows a candle volume strength. The indicator defaults to the simple average of 20 periods, but it is possible to change to other types of averages and periods. If you like t
FREE

This indicator monitors the vital constants of your trading account to keep it healthy and away from excessive risks. It monitors all trades, absolute exposure, account floating point and leverage currently in use, using different color codes for your interpretation. [ Installation Guide | Update Guide | Troubleshooting | FAQ | All Products ] Amazingly easy to understand The indicator is clean and simple It calculates exposure by pairs and currencies Keep your used leverage controlled at all ti
FREE
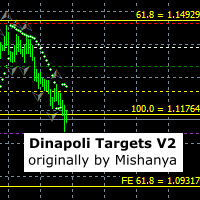
This indicator sets stop, start and target 1, 2 and 3 levels based on detected market swings on multiple timeframes. It was originally written by Mishanya and has been updated by Ramoletane to move with the price and automatically update the levels. A trade can be placed when price has crossed the white start line and stop loss placed on the red stop line. The lot size can be reduced at the green target 1 level, the yellow target 2 level and the position finally closed at target 3. Most of the t
FREE
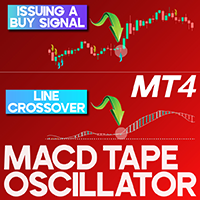
MACD Tape Oscillator for MT4 The MACD Tape Oscillator for MT4 is a refined version of the traditional MACD indicator, offering traders a clearer view of trend momentum and strength. Unlike the standard MACD, this indicator highlights market direction by shifting histogram shades between light/dark blue and orange/red, allowing for easier interpretation of momentum changes. «Indicator Installation & User Guide» MT4 Indicator Installation | MACD Tape Oscillator MT5 | ALL Products By TradingF
FREE

Informative & optimized Zigzag, Accumulated volume, Price change A rewrite of the traditional zigzag tool with new additions. Features:- Optimized code Displays accumulated volume between peaks Displays price change between peaks Usage:- Identify trend swings Identify high volume swings Compare price changes between swings Drawing Fibonacci tool on strong price change or high volume swings
FREE
The presented indicator is an original development based on the idea embedded in the classic technical analysis indicator - Fractals. The Fractals indicator allows you to determine a significant trough or peak for analysis on the price chart of the financial instrument in question. The fractal itself on the price chart consists of candles, the middle of which is either the highest (up fractal) or the lowest (down fractal) of all the candles taken for analysis. The original indicator uses five ca
FREE

The product Divergence Mom Stoch Adx Bears Bulls is designed to find the differences between indicators and price. It allows you to open orders or set trends using these differences. The indicator has 4 different divergence features.
Divergence types Class A Divergence Class B Divergence Class C Divergence Hidden Divergence
Product Features and Rec ommendations There are 5 indicators on the indicator Indicators = Momentum Stochastic Adx Bears Bulls 4 different divergence types are used.
FREE

Stochastic Plus is a visual indicator designed for both beginners and professionals. Developed using Stochastic and Laguerre and the principle of three screen. Stochastic Plus helps: correctly evaluate the current market movement; find optimal entry points; do not rush to close profitable orders and increase profit Stochastic Plus works very well with AmericanDream indicator (see screenshot). May be used with any currency and timeframe.
FREE

Unicorn Indicator MT4
The Unicorn Indicator is an advanced and versatile tool designed for MetaTrader 4 (MT4) . This indicator detects and marks price gaps along with Breaker Blocks on the chart. A Breaker Block is a former order block that initially fails but later turns into a strong support level once the price revisits it. When a Breaker Block coincides with a Fair Value Gap (FVG) , the result is known as the Unicorn Zone . The indicator visually represents bullish Unicorn zones with a gree
FREE

The indicator displays two Moving Average lines on the chart with parameters specified in the settings. It issues a signal in the form of arrows and a sound at the intersection of these Moving Average. In the indicator settings, you can set the period of fast Moving Average ( Fast MA Period ) and slow Moving Average ( Slow MA Period ). And also Shift, Applied Price, Method and Timeframe for two Moving Averages separately. Important:
The main difference from othe
FREE
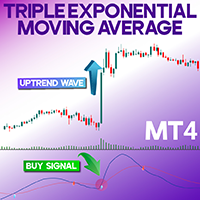
Triple Exponential Moving Average Indicator MetaTrader 4 The Triple Exponential Moving Average (Trix) indicator in MetaTrader 4 effectively filters out minor, insignificant price fluctuations, providing clear visual buy and sell signals. A trade entry signal is generated when the red line (Signal) crosses the green dashed line from below to above, or vice versa. Blue arrows on the oscillator indicate Sell signals , while yellow arrows signify Buy signals . «Indicator Installation &
FREE

The Fisher Transform is a technical indicator created by John F. Ehlers that converts prices into a Gaussian normal distribution. The indicator highlights when prices have moved to an extreme, based on recent prices. This may help in spotting turning points in the price of an asset. It also helps show the trend and isolate the price waves within a trend. The Fisher Transform is a technical indicator that normalizes asset prices, thus making turning points in price clearer. Takeaways Turning poi
FREE

This is an indicator that helps you to scan the whole timeframe then informs you about the last candle position Engulfing Candlestick pattern was formed. The indicator also send alert to your mobile when a new engulfing candle is formed.
For the visual;
1. Green up arrow indicates a bullish engulfing candlestick pattern
2. Red down arrow indicates a bearish engulfing candlestick pattern
FREE

Relative Volume or RVOL is an indicator that averages the volume of X amount of days, making it easy to compare sessions volumes.
The histogram only has 3 colors:
Green - Above average volume
Yellow - Average volume
Red - Below average volume
The default setting is 20 days, which corresponds more or less to a month of trading.
With the data obtained from this indicator you can better gauge the commitment behind a move. For example, you will be better equipped to judge if a breakout of a r
FREE

The volume weighted average price (VWAP) is a trading benchmark used by traders that gives the average price a security has traded at throughout the day, based on both volume and price. VWAP is calculated by adding up the dollars traded for every transaction (price multiplied by the number of shares traded) and then dividing by the total shares traded. You can see more of my publications here: https://www.mql5.com/en/users/joaquinmetayer/seller
FREE
Color Levels - удобный инструмент для тех, кто использует технический анализ с использованием таких инструментов, как Трендовая линия и Прямоугольник. Имеется возможность настройки двух пустых прямоугольников, трех закрашенных и двух трендовых линий. Настройки индикатора крайне просты и делятся на пронумерованные блоки: С цифрами 1 и 2 вначале - настройки пустых прямоугольников (рамок); С цифрами 3, 4 и 5 - настройки закрашенных прямоугольников; С цифрами 6 и 7 - настройки трендовых линий. Объе
FREE

The Hi Lo Breakout is taken from the concept of the ZZ Scalper EA which exploits the inevitable behaviour of price fluctuations and breakouts. The fact that because market prices will always fluctuate to higher highs before ebbing down to lower lows, breakouts will occur.
But here I've added a few more filters which I see work well also as an Indicator.
Range Analysis : When price is within a tight range this Indicator will be able to spot this and only then look for price breaks. You
FREE
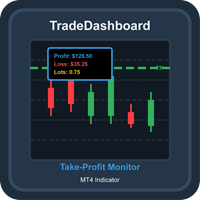
TradeDashboard Comprehensive MT4 Indicator for Trade Visualization and Analysis Overview TradeDashboard is a powerful MetaTrader 4 indicator designed to enhance your trading experience by providing real-time visualization of take-profit levels for all open positions. This advanced tool goes beyond basic TP indicators by displaying comprehensive metrics including potential profits, losses, and total lot sizes, all directly on your chart. Key Features Take-Profit Visualization : Clearly displays h
FREE

Using the indicator you can 1 Identify the trend and follow the large and small trends by drawing lines. When the price leaves the corridor of the lines, then with a high probability the price will go to the next line and reverse on it. 2 Long-line - Lay lines along the centers of fractals, the indicator can detect the fractal of the second point (Number bars analysis). Often the price can approach the line even after a week or a month and you can open a reversal trade. If the wave has passed w
FREE

The purpose of this new version of the MT4 standard indicator provided in your platform is to display in a sub-window multiple timeframes of the same indicator. See the example shown in the picture below. But the display isn’t like a simple MTF indicator. This is the real display of the indicator on its timeframe. Here's the options available in the FFx indicator: Select the timeframes to be displayed (M1 to Monthly) Define the width (number of bars) for each timeframe box Alert pop up/sound/ema
FREE
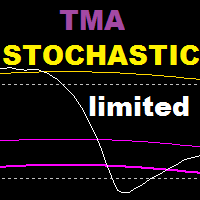
TMA Stochastic is an indicator based on stochastic oscillator and tma bands indicator , this indicator is based on a reversal strategy . Recommended time frame : 15 and above Recommended settings : lower values for scalping , higher values for swing trading WORKS ONLY ON EURUSD , GET THE FULL VERSION : https://www.mql5.com/en/market/product/108378 ======================================================================= Parameters : tma history : how many bars back to show tma bands on stochas
FREE

APriceChannel is a modification of the standard Price_Channel indicator. The EA draws 2 levels - the upper level shows the price High for the specified period of time, the lower level shows the price Low for the same period. In addition to the period, you can set vertical offset in points to widen the channel up and down. This prevents false breakouts of current support/resistance levels.
Inputs Period - time period in bars - the number of bars to calculate the price High/Low. Offset up and dow
FREE

The BB Arrows MTF indicator is based on the Bollinger Bands indicator. Represents input signals in the form of arrows. All signals are generated on the current bar. In 2 modes, Signals are not redrawn (Exception of very sharp jumps)! All signals in MTF mode correspond to signals of the period specified in MTF. It is maximally simplified to use both for trading with only one indicator and for using the indicator as part of your trading systems. A feature of the indicator is that the indicator ti
FREE
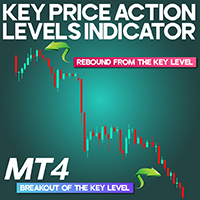
Key Price Action Levels Indicator for MT4
The Key Price Action Levels Indicator for MetaTrader 4 marks important zones on the chart where price has historically reacted. These zones often act as support or resistance, or represent supply and demand areas. The indicator uses a color-coded system to visually display rounded price levels directly on the chart. «Indicator Installation & User Guide»
MT4 Indicator Installation | Key Price Action Levels Indicator MT5 | ALL Products By TradingFind
FREE

TrendPeakValley Scanner v1 – Advanced Reversal Detection Tool
TrendPeakValley Scanner v1 is a powerful custom indicator designed to detect price peaks and valleys based on price action analysis. It visually highlights local tops and bottoms, making it ideal for traders who rely on market structure, support/resistance zones, and reversal patterns.
---
Key Features:
Peak & Valley Detection: Scans historical price action and identifies swing highs/lows based on customizable sensitivi
FREE

熊猫振荡器是一个新的作者的指标设计为倒卖.
一个指示器,根据一系列标准和专有工具的读数给出信号。
熊猫振荡器的主要特点: 分析函数
它可以在任何货币对和时间框架上使用; 指标不重绘; 这是其他指标的一个很好的补充; 图形功能
占据图表上最小数量的位置; 柔性酊剂; 简单易学; 熊猫振荡器组成。..
蓝线是RSI指标; 橙色线是基于T3RSI的综合RSI指标; 虚线是布林带的边界;(见图)。 6) 蓝线是布林带的中线; 熊猫振荡器的主要特点
有一组用于过滤的指示器; 指标本身显示何时需要进入市场;
熊猫振荡器的基本设置: RSI周期-设置RSI的蓝线;
波段周期-虚线的调整;
MA周期-设置移动平均线;
波段偏差-波段偏差;
波段移位-波段移位;
熊猫振荡器在交易中的使用:
进入市场的信号是在建立在T3RSI上的综合RSI离开布林带时形成的。 可以使用T3RSI与布林带中线的交点。
进入位置是在相应颜色的直方图的第一条出现之后进行的:蓝色-进入买入,红色-进入卖出。
从该位置退出是在将直方图的条调零后进行的
FREE

ChannelRSI4 具有超买和超卖区域动态水平的相对强弱指数 (RSI) 指标。
动态水平随指标和价格的当前变化而变化和调整,代表一种通道。
指标设置 period_RSI - 计算 RSI 指数的平均周期。 Applied_RSI - 应用价格。它可以是任何价格常数:PRICE_CLOSE - 收盘价,PRICE_OPEN - 开盘价,PRICE_HIGH - 期间的最高价,PRICE_LOW - 期间的最低价,PRICE_MEDIAN - 中间价(高 + 低) / 2, PRICE_TYPICAL - 典型价格(最高价 + 最低价 + 收盘价)/ 3, PRICE_WEIGHTED - 加权平均价,(最高价 + 最低价 + 收盘价 + 收盘价)/ 4。
period_channel - 超买超卖区域动态通道的计算周期。
FREE
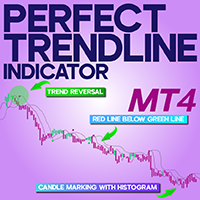
Perfect Trendline Indicator for MT4
The Perfect Trendline Indicator uses two moving averages (MA) with periods of 3 and 7 to display the trend's direction. When the red line (fast moving average) is positioned above the green line (slow moving average) , the trend is considered bullish , with candles marked with green histograms . Conversely, a bearish trend is indicated when the red line is below the green line, and red histograms appear . «Indicator Installation & User Guide»
MT4 Indicator I
FREE

菲波纳奇支撑阻力指标 本指标创建支撑和阻力线。此指标基于菲波纳奇回撤和扩展级别。它会考虑菲波纳奇级别的多种组合,并在这些基础上绘制支撑/阻力线。此指标使用的顶部和底部由之字折线指标计算而来。如有必要,之字折线也可以在图表上绘制。 本指标考虑许多过去的反转点和菲波纳奇比率级别的组合,而当它看到多条线在相同的价格汇合,那么这将成为指标绘制的支撑/阻力线。未来的市场反转往往会正好出现在这些线附近。这是一个自动指标。所以,旧线将被删除,新线将随着市场的进步而绘制。
设置 Bars_Back - 向后一定数量的柱线用于所有计算。数量较少则较少反转点将被使用,因此,绘制的支撑和阻力线较少。向后更多柱线则有更多反转点将被使用,因此,绘制的支撑和阻力线较多。 Buffer_Space - 这表示每个已计算的菲波纳奇级别所需的汇合之间的最大点数。该数值越高,则确切的汇合必须越少。数字越低,则精确汇合必须更多,因此有较高的可靠性。例如, 让我们设为 10 点, 且指标运行在非分形的 4-位报价经纪商 (同样是 10 点)。此指标看到 3 个 菲波纳奇 回撤级别,分别在 1.4995, 1.5000,
FREE

Time Range Separator is a useful tool to display a separator period on your platform. You could go in the properties of the indicator, select the desired range and that's ALL. We believe it is a useful and necessary that we wish to share with you for free all our followers.
Input Values: TimeFrame Period Separator GMT_Hour (ex. +1 or -1) to move the lines at Period Time +/- tot hours in input Hide_dates to show or hide the datetime on vertical lines VLine_Color = Vertical Color Line VLine_Style
FREE

The free version of the Hi Low Last Day MT4 indicator . The Hi Low Levels Last Day MT4 indicator shows the high and low of the last trading day . The ability to change the color of the lines is available . Try the full version of the Hi Low Last Day MT4 indicator , in which additional indicator features are available : Displaying the minimum and maximum of the second last day Displaying the minimum and maximum of the previous week Sound alert when crossing max . and min . levels Selecting an arb
FREE
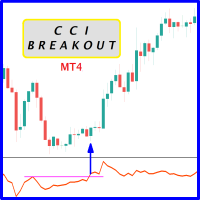
Probability emerges to record higher prices when CCi oscillator breaks out oscillator historical resistance level when exhibit overbought values. Since, oscillator breakout of support and resistance have similar effect as price breaks support and resistance levels, therefore, its highly advised to confirm price breakout with oscillator breakout; certainly, will have the same output in short trades. Concept is based on find swing levels which based on number of bars by each side of peak or trough
FREE
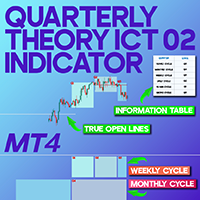
Quarterly Theory ICT 02 Indicator MT4 The Quarterly Theory ICT 02 Indicator MT4 is a specialized analytical tool built upon ICT methodology and fractal time cycles. It segments the market into systematic phases, allowing traders to observe repeating price behaviors over different time horizons. These recurring stages are divided into four quarters (Q1, Q2, Q3, Q4) and can be applied consistently across micro, daily, weekly, and yearly cycles depending on the trader’s preferences. «Indicator Inst
FREE
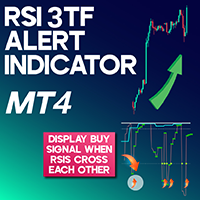
RSI 3TF Alert Indicator for MetaTrader 4 The RSI 3TF Alert Indicator for MetaTrader 4 (MT4) is designed around the RSI indicator utilizing a 2-period configuration. The RSI 3TFA integrates 3 distinct RSI indicators into a single chart view, making market analysis more streamlined for traders. When all 3 RSI indicators move above the 50 threshold, the RSI 3TFA generates a buy signal, and conversely, when they cross below the 50 level, it issues a sell signal. The yellow dots (blue in default conf
FREE
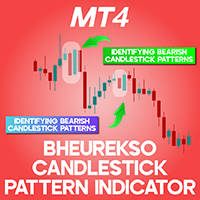
Bheurekso Candlestick Pattern Indicator for MetaTrader 4
The Bheurekso Pattern Indicator , designed for the MetaTrader 4 (MT4) platform, is an advanced tool for identifying candlestick reversal patterns on the chart. This indicator can detect six bullish and six bearish candlestick patterns, displaying them with specific labels on the chart. In addition to pattern identification, it provides signals and alerts to inform traders about the formation of these patterns, enabling timely trade entrie
FREE

The GTAS BSI is an indicator designed to provide the trend direction and buy/sell signals, using combination of momentum indicators. This indicator was created by Bernard Prats Desclaux, proprietary trader and ex-hedge fund manager, founder of E-Winvest.
Description The BSI indicator is represented as a histogram under the price chart. +100 (green) value indicates a bullish trend. -100 (red) value indicates a bearish trend. When the BSI turns to +100 (green), it gives a potential buy signal. Wh
FREE

This indicator plots another symbol on the current chart. A different timeframe can be used for the symbol, with an option to display in multiple timeframe mode (1 overlay candle per several chart candles). Basic indicators are provided. To adjust scaling of prices from different symbols, the overlay prices are scaled to the visible chart price space.
Features symbol and timeframe input MTF display option to vertically invert chart, eg overlay USDJPY, invert to show JPYUSD
data window values; o
FREE

R Var 移动平均线指标是为顽固的趋势追随者设计的趋势跟踪指标。
它是股票交易者和商品交易者中非常流行的外汇交易指标,它的流行源于它能够向用户提供真正的赚钱信号。
该指标由放置在黄褐色线上的绿色和红色点组成。 绿点指向看涨信号,而红点表示看跌信号。
基本交易信号 买入信号:当指标的黄褐色线上的点变为绿色时,做多。 卖出信号:当指标的黄褐色线上的点变为红色时做空。 退出买入交易:如果在看涨趋势持续期间,指标的西耶娜线上出现红点,则关闭所有买入订单。 退出卖出交易:如果在看跌趋势持续期间,R Var 移动平均线指标的西耶纳线上显示绿点,则关闭所有卖出订单。
尖端 在使用 R Var 移动平均线指标时,利用适度的止损来防止错误信号。
将其用于各种交易方式,包括剥头皮交易和日间交易。
特征 平台:MetaTrader 4
货币对:任何
自定义选项:变量(periodAMA、nfast、nslow、G、dK、UseSound、SoundFile)、宽度和样式。
时间范围:1 分钟、5 分钟、15 分钟、30 分钟、1 小时、4 小时、1 天、1 周、1 个月
类型:趋势
FREE
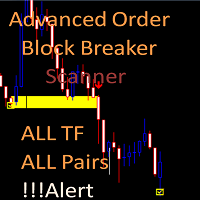
FREE
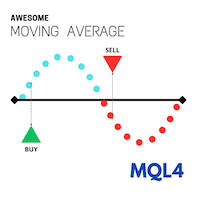
Overview
Discover a powerful yet simple indicator to identify market trends effectively! Awesome Moving Average (AWMA) is designed to detect bullish or bearish trends by analyzing price breakouts beyond the moving average line. Basically, the way this indicator works is similar to the Moving Average indicator available on the MetaTrader platform. As we know, the Moving Average indicator tends to be difficult to use when the market is in a sideways condition because it often gives false breakou
FREE
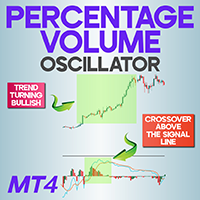
Percentage Volume Oscillator MT4 The Percentage Volume Oscillator MT4 is a specialized volume-based indicator designed for the MetaTrader 4 trading platform. It evaluates the relative shifts in trading volume across financial instruments, allowing traders to pinpoint optimal buy and sell zones and monitor prevailing market trends. This indicator features two volume-based moving averages alongside a histogram, which appears in a dedicated subwindow separate from the price chart. «Indicator Instal
FREE
MetaTrader市场提供了一个方便,安全的购买MetaTrader平台应用程序的场所。直接从您的程序端免费下载EA交易和指标的试用版在测试策略中进行测试。
在不同模式下测试应用程序来监视性能和为您想要使用MQL5.community支付系统的产品进行付款。
您错过了交易机会:
- 免费交易应用程序
- 8,000+信号可供复制
- 探索金融市场的经济新闻
注册
登录