Guarda i video tutorial del Market su YouTube
Come acquistare un Robot di Trading o un indicatore
Esegui il tuo EA
hosting virtuale
hosting virtuale
Prova un indicatore/robot di trading prima di acquistarlo
Vuoi guadagnare nel Market?
Come presentare un prodotto per venderlo con successo
Indicatori tecnici gratuiti per MetaTrader 4 - 15

CDS SR Fractal Level: Enhance Your Trading Accuracy with Automatic Fractal-Based Support and Resistance Levels The CDS SR Fractal Level indicator is an advanced trading tool designed by CDS to automatically identify and visualize key Support and Resistance (SR) levels. This indicator utilizes the concept of fractals to present relevant SR levels for your trading decisions. Key Features: Automatic Fractal Level Identification: The indicator dynamically marks fractal levels as they form on the pri
FREE

Indicators are for trend followers!
A trading system constructed by three moving averages. Trade with the trend and let profits run.
Strongly recommend trend indicators, automatic calculation of wave standard and MT5 version of automatic calculation of wave standard Necessary for traders: tools and indicators Waves automatically calculate indicators, channel trend trading Perfect trend-wave automatic calculation channel calculation , MT4 Perfect trend-wave automatic calculation channel
FREE
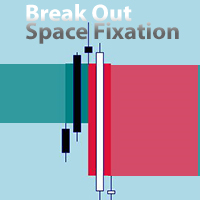
An EA version is being prepared. You can send a private message "notify about EA version".
EA will be versatile with many settings for trading on various indicators. The new EA will also allow trading on this indicator. For example, allowing signals after X signals/bars to X signals/bars in one direction, before changing direction. If Break Out happened before/after the signal of another indicator. Collect profit on each next signal above/below the previous one.
Send a private message "notify
FREE

The indicator is completely based on the classic MFI indicator. I recommend watching my advisor - Night Zen EA
It contains two basic trading strategies: The output of the MFI line from overbought/oversold zones. The entry of the MFI line into the overbought/oversold zones. Arrows are drawn after confirming the signal by strategies and are not redrawn.
Alerts are also registered: Alerts Push notifications to the mobile terminal email Settings: MFI period - the period of the MFI indicator Lev
FREE

Questo indicatore si basa sull'esperienza pratica.
Inserite la data/ora del vostro top/bottom.
Calcola il livello più visitato dal top/bottom fino al momento attuale.
Si aggiorna automaticamente a ogni nuova candela. È possibile utilizzare contemporaneamente più indicatori per diversi trend e timeframe.
La lunghezza è sempre tracciata dall'inizio del periodo fino al presente.
Utile strumento PRO.
FREE

Benvenuto nell'indicatore di riconoscimento avanzato del modello Gartley Questo indicatore rileva il pattern gartley basato su HH e LL della struttura dei prezzi e sui livelli di Fibonacci, e quando vengono raggiunti determinati livelli di fib, l'indicatore mostrerà il pattern sul grafico. Versione MT5: WH Advanced Gartley Pattern MT5
**Questo indicatore fa parte di combo WH Ultimate Harmonic Patterns MT4 , che include tutto il riconoscimento dei pattern.** Caratteristiche : Algoritmo
FREE

Necessary for traders: tools and indicators Waves automatically calculate indicators, channel trend trading Perfect trend-wave automatic calculation channel calculation , MT4 Perfect trend-wave automatic calculation channel calculation , MT5 Local Trading copying Easy And Fast Copy , MT4 Easy And Fast Copy , MT5 Local Trading copying For DEMO Easy And Fast Copy , MT4 DEMO Easy And Fast Copy , MT5 DEMO Fibo: from KTrade 1. Automatically calculate and analyze the band. -> Get the desired band 2.
FREE

In physics, "Jerk" is the third time-derivative of position, with acceleration being the second derivative and velocity the first derivative. In technical analysis, the first derivative of price is the price momentum, with the second derivative,acceleration, being seldom used and the third derivative virtually unknown. The magnitude frequency response of a digital differentiator is a positive-slope straight line passing through zero frequency. Therefore, every instance of a digital signal differ
FREE

MA Reminder Overview MA Reminder is a versatile moving average indicator that provides visual cues and background coloring to help traders identify trend direction and potential trading opportunities based on MA crossovers. Key Features Multiple Moving Averages : Displays up to 4 configurable moving averages on the chart Background Coloring : Highlights chart background based on MA1 and MA2 crossovers Timeframe Flexibility : Choose between dynamic (follows chart timeframe) or fixed timeframe mod
FREE

Stochastic RSI makes a stochastic calculation on the RSI indicator. The Relative Strength Index (RSI) is a well known momentum oscillator that measures the speed and change of price movements, developed by J. Welles Wilder.
Features Find overbought and oversold situations. Sound alert when overbought/oversold level is reached. Get email and/or push notification alerts when a signal is detected. The indicator is non-repainting. Returns buffer values for %K and %D to be used as part of an EA . (s
FREE
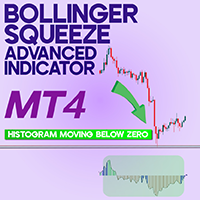
Bollinger Squeeze Advanced Indicator MetaTrader 4 The Bollinger Squeeze Advanced Indicator is developed to detect price squeeze phases on the MetaTrader 4 platform. This tool is displayed on the chart as a series of histograms accompanied by a swinging line, projecting potential strong price movements. In the Advanced Bollinger Pressure Oscillator, green bars represent bullish trends, red bars indicate bearish trends, and blue bars signify Bollinger Band squeeze periods. «Indicator Installatio
FREE

Better Period Separators For MetaTrader 4 The built-in period separators feature doesn’t allow users to specify the time period, so you can use this indicator to create more customizable period separators. On intraday charts, you could place period separators at a specific time, you could also place extra period separators at a specific time on Monday to mark the start of a week. On higher timeframe charts, this indicator works the same as the built-in period separators, On the daily chart, peri
FREE

I pattern armonici sono ideali per prevedere i punti di inversione del mercato. Offrono un'elevata percentuale di successo e numerose opportunità di trading in un singolo giorno. Il nostro indicatore identifica i pattern armonici più popolari basandosi sui principi della letteratura sul trading armonico. NOTE IMPORTANTI: L'indicatore non ridisegna, non è in ritardo (rileva un pattern nel punto D) e non ridisegna (il pattern è valido o annullato). COME UTILIZZARE: Trascina e rilascia l'indicatore
FREE
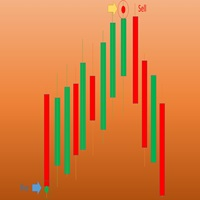
Wave Entry Alerts Oil is a custom indicator developed by Azad Gorgis for MetaTrader 4. This indicator is designed to provide alerts based on ZigZag patterns, specifically tailored for trading on the Oil (XIT/USD) symbol.
Key Features: - Chart Window Indicator: The indicator is designed to be displayed on the main chart window. - Arrow Signals: The indicator generates arrow signals on the chart, indicating potential reversal points based on ZigZag patterns. - Customizable Parameters: Traders ca
FREE

Introduction to Fractal Moving Average Fractal Moving Average indicator was designed as part of Fractal Pattern Scanner. Inside Fractal Pattern Scanner, Fractal Moving Average Indicator was implemented as multiple of chart objects. With over thousands of chart object, we find that it was not the best and efficient ways to operate the indicator. It was computationally too heavy for the indicator. Hence, we decide to implement the indicator version of Fractal Moving Average indicator to benefit o
FREE
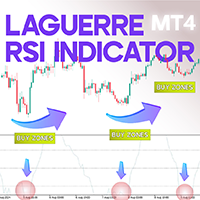
Laguerre RSI Indicator for MT4 The Laguerre RSI indicator in MetaTrader 4 offers an enhanced approach to the conventional RSI by functioning as an oscillator. This tool minimizes market noise, providing a more refined visualization of price trends compared to the standard RSI. By highlighting key levels, the indicator helps traders identify overbought (Buy) and oversold (Sell) conditions with greater precision. Additionally, the coefficient parameter can be modified to adjust signal frequency ba
FREE
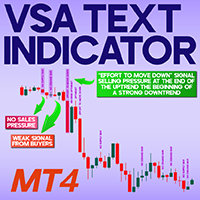
VSA Text Indicator MetaTrader 4 The VSA Text Indicator is a technical analysis tool available on the MetaTrader 4 platform, built upon the principles of Volume Spread Analysis (VSA). This indicator evaluates both price action and trading volume to identify the activity of smart money. It generates text-based signals directly on the chart, highlighting potential entry and exit zones in the market. «Indicator Installation & User Guide»
MT4 Indicator Installation | VSA Text Indicator MT5 | AL
FREE

Trend indicator derived from T3 moving averages. The cloud is bounded by a fast T3 and slow T3 lines. Buying/Selling opportunities above/below cloud. The fast and slow T3 MA lines can also be used as dynamic support/resistance for more aggressive entries. Use default values for best settings. The number of look back bars is user defined. This indicator can be used in combination with other strategies such as price action. Suitable for all time frames. Prerequisites: T3IndiSlow and T3IndiFast in
FREE
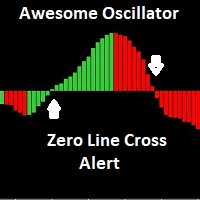
The Awesome Oscillator (AO) is an indicator used to measure market momentum. AO calculates the difference between a 34 Period and 5 Period Simple Moving Average. The Simple Moving Averages that are used are not calculated using closing price but rather each bar's midpoints. This indicator has email and pushup "mobile" features Alert, for any suggestions, please don't hesitate, thanks
FREE

TwoMA Crosses indicator displays arrows based on whether the short term moving average crosses above or below the long term moving average. A moving average doesn't predict price direction. Instead, it defines the current direction. Despite this, investors use moving averages to filter out the noise. Traders and investors tend to use the EMA indicator, especially in a highly volatile market because it’s more sensitive to price changes than the SMA.
Download for FREE TwoMA Crosses EA from the
FREE

The LexusBO indicator is recommended for trading binary options . Signals are generated when the RSI, ADX, CCI indicators cross the customizable levels. The indicator displays signals using "up/down" arrows on the chart. Their values are available in the buffer arrays (buffer with index 0 - "up" arrow, with index 1 - "down" arrow). This makes the indicator easy to use for automated trading through specialized Expert Advisors. The recommended timeframe is M5. The indicator has a built-in counter
FREE
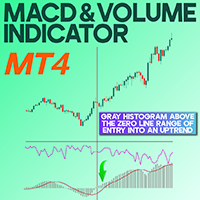
MACD and Volume Indicator for MetaTrader 4 The MACD and Volume Indicator is a versatile tool crafted to analyze trading volume, detect market trends, and identify ideal entry and exit points. By merging the functionality of MACD (Moving Average Convergence Divergence) with volume-based analysis, this indicator enables traders to recognize optimal trading opportunities. It accomplishes this by highlighting divergence, convergence, and significant volume shifts, offering deeper insight into moment
FREE

--- FREE VERSION - WORKS ONY ON EURUSD
------------------------------------------------------------------- This is a unique breakout strategy that is used for determination of the next short term trend/move. The full system is available on MQL5 under the name "Forecast System". Here is the link --> https://www.mql5.com/en/market/product/104166?source=Site Backtest is not possible, because calculations are done based on the data of all timeframes/periods. Therefore I propose you use the technolo
FREE

Donchian channels are a tool in technical analysis used to determine the relative volatility of a market and the potential for price breakouts.
Can help identify potential breakouts and reversals in price, which are the moments when traders are called on to make strategic decisions. These strategies can help you capitalize on price trends while having pre-defined entry and exit points to secure gains or limit losses. Using the Donchian channel can thus be part of a disciplined approach to managi
FREE

All traders should know the trend before making their decision when placing the buy or sell orders. The first step always starts with supply and demand , rising and falling channels , trend lines, engulfing candles etc. All the above contribute to what is called “Price Action” and that is the best and most reliable way in trading and catching the trend and making profits, without stress. The Investment Castle Trend Line Indicator will automatically draw the trend lines on the MT4 for you. An
FREE

The purpose of this new version of the MT4 standard indicator provided in your platform is to display in a sub-window multiple timeframes of the same indicator. See the example shown in the picture below. But the display isn’t like a simple MTF indicator. This is the real display of the indicator on its timeframe. Here's the options available in the FFx indicator: Select the timeframes to be displayed (M1 to Monthly) Define the width (number of bars) for each timeframe box Alert pop up/sound/ema
FREE
ALGO BOX – Advanced Day Trading System ALGO BOX is a powerful day trading indicator designed for serious traders who demand precision and reliability in breakout trading. Combining advanced price action analysis with real-time data, it helps you spot high-probability trades while keeping risk under control. Why ALGO BOX Stands Out Identify clear, profitable breakout opportunities Reduce false signals for better trade accuracy Track your trading performance with live stats Make smart, data-driven
FREE

Pinbar Detector is a MetaTrader indicator that tries to detect Pinbars (also known as "Pin-bar" or "Pin bar") and marks them by placing a "smiling face" symbol below the bullish Pinbars and above the bearish Pinbars. It is a pure price action indicator, which is not using any standard technical indicators in its code. The configuration of Pinbar detection can be done via the indicator's input parameters. Pinbar Detector can issue platform alerts and email alerts on detection.
As you can see o
FREE

Features:
1- Get OB/OS Levels from Golden MA Levels
2- Wait for Buy/Sell Start Level Cross
3- Optional: Should price cross Mid Level in earlier bars
4- Optional: Crossing bar High/Medium Volume
5- Optional: MA Stacked to check up/down trend for current TF
6- Optional: NRTR higher timeframes aligned Check
Detailed blog post explained: https://www.mql5.com/en/blogs/post/758457
Levels with Buffers available here: Golden MA Levels Indicator: https://www.mql5.com/en/market/product/119515 Note: Arr
FREE
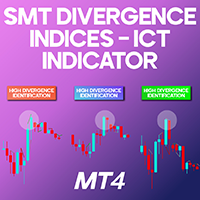
Smart Money Divergence ICT Indices MT4 The SMT Divergence Indices ICT indicator is a specialized tool available for MetaTrader 4 , designed to assist ICT traders in recognizing Smart Money Divergences across three major indices: Dow Jones (DJI), Nasdaq (NASDAQ), and S&P 500 . By using this indicator, traders can identify crucial SMT Divergence points , offering insights into potential price movements. Additionally, the indicator detects trendline divergences , as well as high and low price varia
FREE

1. Monthly, weekly and daily pivots are calculated with the beginning and ending data for each period. 2. This provides an easy line on the chart to identify where the pivots are and reduces error of calculation. 3. The indicator will help define very quickly the major pivots for the instrument even if you do not understand how to calculate the pivot. 4. You can also compare weekly and daily pivots so that you can better understand the position of price. 5 This indicator will help you trade more
FREE
Supply Demand Ribbon is an indicator with moving supply and demand lines that help you identify price zones more easily. The indicator helps you determine flexible entry, stop loss, and take profit areas. There are also strategies for algorithmically changing ribbon colors. From there you can come up with many trading strategies for yourself! MT5 Version: Click here!
You can explore many feature in Advanced version here ! You can combine it with our indicators below to make your tradin
FREE
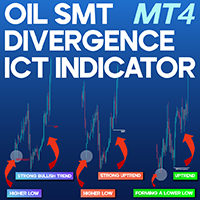
SMT Divergence ICT Oil Indicator MT4 The SMT Divergence Oil Indicator is a specialized MetaTrader 4 tool designed to identify divergence patterns between correlated assets. It assists traders in detecting price discrepancies across Crude Oil (XTIUSD), Brent Crude (XBRUSD), and the USD/CAD pair , offering insights into possible trend shifts or reversals. This indicator visually marks divergence areas on the chart, making it easier to recognize opportunities for buying or selling based on institut
FREE

There are many candlestick patterns but only a few are actually worth knowing. Candlestick Pattern Filter detects and marks the most reliable candlestick patterns. Remember that these patterns are only useful when you understand what is happening in each pattern. They should be combined with other forms of technical analysis for best result. These patterns are included: Hammer / Hanging Man Inverted Hammer / Shooting Star Bullish / Bearish Engulfing Piercing Line / Dark Cloud Cover Morning Star
FREE

This automated AK Edge Scalping Indicator can be employed to oversee trades and identify optimal entry points for all time frames and both buying and selling when the price starts trending upwards or downwards. It is designed to recognize zones for Sell/Buy trades by utilizing the Moving Average and the MACD. Additionally, it incorporates the Average True Value to fine-tune the Stop Loss and the Take Profit. It can be effectively used in conjunction with other strategies to facilitate prompt en
FREE

Check my p a id tools they work perfect please r ate Adjustable PIN BAR indicator is usefull tool alowing to search for pin bars you wish to find on the price chart, it has 2 parameters to filter out what type of pin bars you wish to search for: 1) MinTailProc 75% (default) which means to show pin bars that has minimum size of the Nose (Tail) as 75% of full candle size. If Upper Nose (Tail) size of the candle is minimum 75% of the candle size fully than candle is painted in RED. If Lower Nose
FREE

SR is a support and resistance indicator, it shows major highs and lows by different colors. The color of a level is changing if the last high or low are touching it. After the closing of a bar above or below level, it will delete it. extern inputs: loop for candles / colors / drawing time *This indicator signal is not perfect and have to be used with other market analysis and confirmations.
FREE
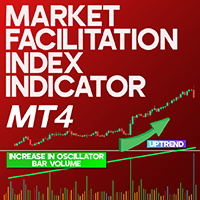
Market Facilitation Index (MFI) Indicator MetaTrader 4 The Market Facilitation Index (MFI) Indicator is an oscillator integrated into MetaTrader 4, created to analyze price fluctuations and measure market strength. By linking trading volume with price movements, the indicator evaluates whether the market has sufficient volume to maintain its direction. The MFI is calculated by dividing the range of a candlestick (High - Low) by its tick volume, providing insights into the connection between pric
FREE

Il nostro indicatore “Verve Ai Auto Fib” potenziato dall’IA identifica dinamicamente le tendenze di mercato e i canali di prezzo, quindi traccia automaticamente i livelli di Fibonacci basati sull’azione del prezzo in tempo reale. Niente più regolazioni manuali – solo ritracciamenti ed estensioni di Fibonacci precisi, su misura per le condizioni di mercato!
Caratteristiche principali e vantaggi: • Rilevamento automatico dei canali – algoritmo IA identifica le strutture di mercato chiave. • Liv
FREE

Statistiche del dashboard dell'account
È uno strumento che ti aiuterà ad avere una visione mirata per conoscere i profitti e le perdite del tuo account, così puoi tenerne traccia, porta anche un'analisi del drawdown per conoscere anche il rischio ottenuto Dopo averlo scaricato e attivato nel tuo account, devi allegarlo a qualsiasi simbolo ad esempio EURUSD H1, quindi da questo momento lo strumento inizierà a monitorare le tue statistiche
il pannello è completamente avanzato, puoi nasconderlo
FREE

Multi timeframe fractal indicator which shows the higher timeframe's fractal point on lower timeframes.
Parameters Fractal_Timeframe : You can set the higher timeframes for fractals. Maxbar : You can set the maximum number of candles for the calculations. Up_Fractal_Color, Up_Fractal_Symbol, Down_Fractal_Color, Down_Fractal_Symbol : Color and style settings of the fractal points. Extend_Line : Draws a horizontal line from the previous fractal point until a candle closes it over or a user-specif
FREE
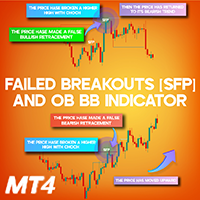
Failed Breakouts SFP and OB BB Indicator MT4
The Advanced Failed Breakout Indicator (SFP) is an essential tool in technical analysis, offering a comprehensive display of key market structures such as Break of Structure (BOS), Change of Character (CHoCH), and False Breakouts (SFP) directly on the chart. This indicator allows traders to detect deceptive breakouts and avoid potential market traps while maintaining a strategic approach to risk management. «Indicator Installation & User Guide»
MT4
FREE
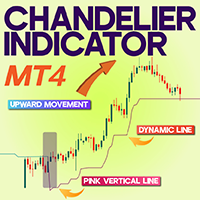
Chandelier Indicator MetaTrader 4 The Chandelier Indicator is a tool designed to display a Trailing Stop on the MetaTrader 4 platform. This technical analysis indicator utilizes the Average True Range (ATR) to plot price levels above and below the current market price. Additionally, it draws vertical lines on the chart to mark shifts in trend direction—such as transitions from bullish to bearish trends and vice versa. «Indicator Installation & User Guide»
MT4 Indicator Installation | Chandel
FREE

WaPreviousCandleLevels MT4 shows the previous candle levels, it shows the previous candle Open High Low Close levels (OHLC Levels) in different time frame. It's designed to help the trader to analyse the market and pay attention to the previous candle levels in different time frame. We all know that the OHLC Levels in Monthly, Weekly and Daily are really strong and must of the time, the price strongly reacts at those levels. In the technical analysis, the user can use them as a support and res
FREE
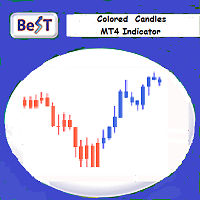
BeST_Colored Candles is an MT4 FREE indicator that can change the color of the Candlesticks based on the MACD, SAR or RSI values and levels. It is a Composite indicator that by selection uses the values each one of these 3 indicators and their critical levels in order to create numerical relationships that when satisfied cause their corresponding candlesticks coloration.
Input parameters
== Basic Settings
-- Please Select Indicator - for selecting which one of the above 3 indicators
FREE

Indicator SR levels true in small time frames is very useful for scalping while in bigger ones it is good for day or position trading.
SR levels true can draw 4 support/resistance levels based on defined maximum rebouds from price level. Indicator scans defined number of bars in time axis and defined number of pips in price axis (both sides - up and down) and calculates how much times price was rejected from scanned price levels. At the price levels where maximum rebounds are counted, support
FREE

The indicator gives buy or sell signals based on the Parabolic SAR indicator, and it also contains strategies with Moving Average. There are alerts and alerts to the mobile terminal and to the mail. Arrows are drawn on the chart after the signal is confirmed. They don't redraw. I recommend watching my advisor - Night Zen EA
To keep up to date with my latest products and ideas, join my telegram channel and subscribe to my profile. The link in my profile contacts - My profile The indicator in
FREE
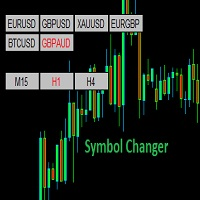
Symbol Changer (Custom) Indicator
This is a simple yet intuitive indicator. And its free.
The indicator provide easy navigation across various symbols and across different time frames all in a chart.
The buttons are displayed on the main chart.
It is flexible and easy to use with fast response speed.
FEATURES
UniqueID : This identifies the pairs for each chart
Use Custom Pairs : If set to true, load all the available symbols in the Market Watch. No means it loads the pairs selected be
FREE

CISD and Price Gap Openings Indicator MT4 The CISD CSD + Price Gap Openings Indicator is designed to highlight price gaps while marking the CISD level, providing insights into potential market reversals. This MetaTrader 4 tool, based on ICT principles, utilizes arrow markers to assist traders in recognizing fresh price gaps and possible retracement zones. CISD – CSD + Price Gap Openings Indicator Specifications The following table outlines the features of the CISD – CSD + Price Gap Openings In
FREE
What is this indicator? This Basic Support and Resistance Indicator -Free- is designed to help traders automatically identify key market levels, such as supports and resistances, across multiple symbols and timeframes within the MetaTrader 5 (MT5) platform. It is an essential tool for trading in different financial markets, such as forex, indices, commodities, and cryptocurrencies. Main Features Automatic Detection of Support and Resistance Levels: Automatically analyzes key levels bas
FREE
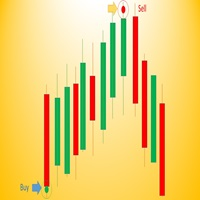
Wave Entry Alerts In Gold is a custom indicator developed by Azad Gorgis for MetaTrader 4. This indicator is designed to provide alerts based on ZigZag patterns, specifically tailored for trading on the Gold (XAU/USD) symbol.
Key Features: - Chart Window Indicator: The indicator is designed to be displayed on the main chart window. - Arrow Signals: The indicator generates arrow signals on the chart, indicating potential reversal points based on ZigZag patterns. - Customizable Parameters: Trade
FREE

Average Session Range MT4: Calculate and Average the Sessions High-Low Range of Specific Time Sessions Over Multiple Days. The Session Average Range is a sophisticated and precise tool designed to calculate the volatility of specific time sessions within the trading day. By meticulously analyzing the range between the high and low prices of a defined trading session over multiple days, this tool provides traders with a clear and actionable average range. **Note:** When the trading platform is cl
FREE

RSI Candle Signal Indicator will change bars’ color when set overbought or oversold levels reach.
How to Use RSI Candle Signal Uptrend/Downtrends - RSI may be used to detect trending markets. For example, the RSI may stay above the mid line 50 in an uptrend. Top and Buttoms - RSI may help in identifying the tops around the overbought readings (usually above 70), and the bottoms around the oversold area (usually below 30). Divergence - divergence occurs when RSI directional movement is not co
FREE
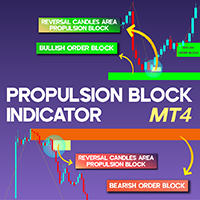
Propulsion Block Indicator MT4
The Propulsion Block Indicator for MetaTrader 4 is a sophisticated analytical tool designed to detect price shifts and liquidity concentration zones. This indicator pinpoints crucial order block regions that intersect with Supply and Demand areas, offering valuable insights into market movements. Propulsion Blocks materialize after an order block is established and become active when the price retraces to that level. Bullish order blocks are represented in green ,
FREE

L'indicatore R Silver Trend è un indicatore di trading che segue la tendenza che mostra la tendenza attuale direttamente sul grafico delle attività di Metatrader 4.
Disegna due tipi di candele: Il blu è per l'azione dei prezzi rialzista. Rosso per movimento di prezzo ribassista.
Il trading con l'indicatore R Silver Trend è abbastanza semplice anche per i principianti assoluti e può essere utilizzato per le valute scalping (M1, M5), day trading (M5, M15, M30) e swing trading (H1, H4, D1).
Seg
FREE

Indicatore Slope Channel per MetaTrader
Stai cercando uno strumento per analizzare le tendenze di mercato adatto a qualsiasi stile di trading? Slope Channel – il tuo assistente affidabile per identificare i movimenti dei prezzi e i livelli chiave del mercato! Cos'è Slope Channel? Slope Channel è un indicatore innovativo che costruisce un canale inclinato sul grafico, calcolando automaticamente i suoi parametri in base agli estremi locali. Questo strumento evidenzia l'opzione di canale ot
FREE

Future prediction is something any trader would love to know, through this simple prediction algorithm can give a picture of the future. This algorithm is based on past data and the average prices of the data to simulate future candles. This is an indicator that will be redrawn. This indicator is completely free, can be used as a trend reference but absolutely do not use for trading.
FREE

Esse indicador mede o 1º Canal de referencia e a 1º Zona Neutra * configurar o canal macro para verificar a frequencia MAIOR H1 H4 1D * configurar o canal micro para verificar a frequencia Menor 1M 5M 15M Como instalar o Indicador fimathe. E uma pré mentoria tem uma estrategia Secreta bonus nesse video . assitao o video para enteder as logicas que podemos iniciar com esse indicador.
https://www.youtube.com/playlist?list=PLxg54MWVGlJzzKuaEntFbyI4ospQi3Kw2
FREE

This indicators automatically draws the support and resistances levels (key levels) for you once you've dropped it on a chart. It reduces the hustle of drawing and redrawing these levels every time you analyse prices on a chart. With it, all you have to do is drop it on a chart, adjust the settings to your liking and let the indicator do the rest.
But wait, it gets better; the indicator is absolutely free! For more information: https://youtu.be/rTxbPOBu3nY For more free stuff visit: https:
FREE

This indicator compares the price changes during the specified period for the current symbol and other reference symbol. It allows to analyze the similar movements of highly correlated symbols, such as XAUUSD and XAGUSD, and find their occasional convergences and divergences for trading opportunities. The indicator displays the following buffers: light-green thick line - price changes of the current symbol for TimeGap bars; light-blue thin line - price changes of the reference symbol ( LeadSymbo
FREE
This indicator allows to hide Bill Williams Alligator (on all MT4 timeframes) from a date define by the user with a vertical line (Alone) or a panel (with "Hidden Candles"). Indicator Inputs: Jaws Period Jaws Shift Teeth Period Teeth Shift Lips Period Lips Shift Method Apply To Information on "Alligator" indicator is available here: https://www.metatrader4.com/en/trading-platform/help/analytics/tech_indicators/alligator ************************************************************* Hey traders!
FREE

4H Open Line Indicator - Settings Overview This custom indicator is used to draw and visualize the opening price , midline , and high/low ranges of 4-hour candles on smaller timeframes. It's particularly useful for intraday traders who want to see higher-timeframe levels. Indicator Inputs and Descriptions Parameter Value Description OpenLineColor White Color of the line indicating the open price of the 4H candle. OpenLineWidth 1 Width of the open price line. OpenLineStyle Solid Line style
FREE
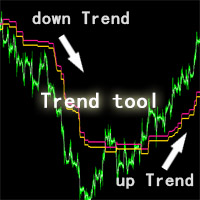
This ZhiBiQuShi tool is suitable for all varieties and is suitable for more than 5 minutes. It is a good tool for judging trends!
The price is a downward trend below the two lines, and the price is an upward trend above the two lines.
DESCRIPTION OF SETTINGS till_breakeven_rate : Determines how closely the channel will follow the price till the trade breaks even. RECOMMEND 1 space1 : Determines the width of the channel from the beginning of a trade till profi
FREE

Indicatore di Breakout della Forza Valutaria (Currency Strength Breakout Indicator)
Ottieni un vantaggio nel tuo trading con l' Indicatore di Breakout della Forza Valutaria , uno strumento potente che analizza otto valute su più timeframe (M1, M5, M15, M30 e H1), tutto in una finestra unica e facile da leggere. Identifica le valute più forti e più deboli e opera sui ritracciamenti con precisione, sfruttando gli avvisi per entrare nei trend al momento giusto. Caratteristiche principali Monitorag
FREE

Leonardo Breakout SMC – Advanced Trading Indicator
Overview The Leonardo Breakout SMC is a masterpiece of precision and innovation, crafted for those who seek to understand and harness the unseen forces within the market. Just as Da Vinci observed the natural world with meticulous detail, this MetaTrader 4 (MT4) indicator reveals the hidden structures of price movement, enabling traders to capture the essence of smart money concepts (SMC) and execute flawless breakout strategies. Every eleme
FREE

Two Period RSI compares long-term and short-term RSI lines, and plots a fill between them for improved visualization. Fill is colored differently according to an uptrend (short period RSI above long period RSI) or a downtrend (short period RSI below long period RSI). Short-term RSI crossing long-term RSI adds a more robust trend confirmation signal than using single period RSI alone. This is a small tool to help visualize and confirm RSI trends. We hope you enjoy! Looking for RSI alerts? You can
FREE
Quando lavori con più asset e hai diverse posizioni aperte in asset, è un po' complicato visualizzare quando profitto o profitto sta dando ogni problema attivo, quindi con questo in mente, sviluppiamo questo indicatore in cui facilita la visualizzazione delle operazioni negli asset , dove sarai in grado di aprire diverse risorse e sarai in grado di visualizzare il risultato individuale di ogni risorsa e accelerare il processo decisionale nella tua attività.
FREE
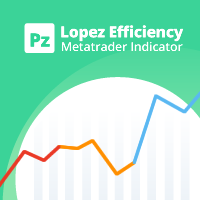
This indicator analyzes how efficient is the current market movement based on the true high-low ratio of a certain number of bars. [ Installation Guide | Update Guide | Troubleshooting | FAQ | All Products ] The ratio is the effectiveness of the market movement A ratio below 1 means the market is going nowhere A ratio above 1 means the market is starting to show directionality A ratio above 2 means the market is showing effective movement A ratio above 3 means the market moved too much: it will
FREE

Introduction and Description
Colored candlesticks showing the trend based on two moving averages and the slope of the slow moving average. A trend is the overall direction of a market or an asset's price. In technical analysis, trends are identified by trendlines or price action that highlight when the price is making higher swing highs and higher swing lows for an uptrend, or lower swing lows and lower swing highs for a downtrend. Many traders opt to trade in the same direction as a trend, whil
FREE

This indicator is stand alone version from MP Pivot Levels (All in one) containing Demark's Pivots.
Calculations: PP = X / 4 R1 = X / 2 - LOWprev S1 = X / 2 - HIGHprev Uses: When the pair currency price may change the direction of movement. Possible constraints of support and resistance that creates plateaus for the currency pair prices. Tendency identification by comparing the present prices according to current day's pivot point and also the prior day's pivot points. ____________
FREE
Il MetaTrader Market è l'unico negozio online dove è possibile scaricare la versione demo gratuita di un robot di trading che consente di effettuare test e ottimizzazioni utilizzando dati statistici.
Leggi la descrizione dell'applicazione e le recensioni di altri clienti, scaricala direttamente sul tuo terminale e prova un robot di trading prima di acquistarlo. Solo sul MetaTrader Market è possibile testare un'applicazione in modo assolutamente gratuito.
Ti stai perdendo delle opportunità di trading:
- App di trading gratuite
- Oltre 8.000 segnali per il copy trading
- Notizie economiche per esplorare i mercati finanziari
Registrazione
Accedi
Se non hai un account, registrati
Consenti l'uso dei cookie per accedere al sito MQL5.com.
Abilita le impostazioni necessarie nel browser, altrimenti non sarà possibile accedere.