YouTubeにあるマーケットチュートリアルビデオをご覧ください
ロボットや指標を購入する
仮想ホスティングで
EAを実行
EAを実行
ロボットや指標を購入前にテストする
マーケットで収入を得る
販売のためにプロダクトをプレゼンテーションする方法
MetaTrader 4のための無料のテクニカル指標 - 15

The " Multi Kernel Regression " is a versatile trading indicator that provides graphical interpretations of market trends by using different kernel regression methods. It's beneficial because it smoothes out price data, creating a clearer picture of price movements, and can be tailored according to the user's preference with various options.
What makes this indicator uniquely versatile is the 'Kernel Select' feature, which allows you to choose from a variety of regression kernel types, such
FREE

The SDX Chart is a free additional indicator which can be used in combination with SDX Dashboard .
Features Ability to review the history of each symbol and time frame. Ability to change symbols and time frames with one click. Works perfectly in combination with SDX Dashboard and helps you to understand the system better. Settings
MA Period - number of periods for the calculation of the moving average and the standard deviation. Number of Bars - how far back to draw the indicator. Buttons Siz
FREE

SmartStochasticMt4 is a universal indicator for making trading decisions. An indispensable tool for novice traders, as it has no settings and is ready to work after installation.
Advantages of the indicator:
1. Works with any trading symbol
2. Works on any time period
3. Has no configurable parameters
4. Provides a complete picture of the trading situation from different time periods
5. Not late
Working with the indicator
1. To set the indicator
2. To exclude from the time of the rel
FREE

The Sentiment Ratio indicator gauges current Market Sentiment between -100% and 100%, where lower than -40% is considered Bearish and higher than 40% is Bullish. The channel between the two is considered Neutral. The indicator has been a very useful filter tool for signals within a trading system.
Example call function: int SentimentIndicator(double triggerLevel)//Return sentiment if trigger level is activated { double sentimentRatio=iCustom(NULL,0,"Sentiment Ratio",0,0,0); if(sentimentRa
FREE

It's a simple but useful tool for creating a grid based on Envelopes.
Only 2 parameters can be set: 1) "Period" - the period of all visible Envelopes (i.e. 4) and 1 Moving Average (Envelopes axis), 2) "Deviations Distance" - the distance between Envelopes.
Naturally, the colors of all 9 lines can be changed as desired. It works with everything that is available in your Market Watch.
Good luck!
FREE

The implementation of the impulse system described by Dr. Alexander Elder. The indicator colors the bars according to the following pattern: Moving average and MACD histogram increase - green bar, it is forbidden to sell; Moving average and MACD histogram have different directions - blue bar, the ban is removed; Moving average and MACD histogram decrease - red bar, it is forbidden to buy.
Indicator Parameters EMA - period of the indicator's moving average MACD Fast - period of the fast moving
FREE

Opening positions in the direction of the trend is one of the most common trading tactics.
This indicator determines the direction of the local movement and colors the candles on the chart in the appropriate color.
Allows you to enter the transaction at the very beginning of the movement
Thanks to the flexible settings you can use on any currency pairs, metals and cryptocurrency
Can be used when working with binary options
Distinctive features Does not redraw. Additional parameters for
FREE
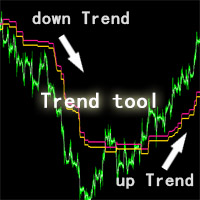
このZhiBiQuShiツールはすべての品種に適しており、5分以上に適しています。トレンドを判断するのに良いツールです。
価格は2つのラインより下の下降トレンドであり、価格は2つのラインより上の上昇トレンドです。
設定の説明
till_breakeven_rate:取引が成立するまでチャンネルが価格にどれだけ近づくかを決定します。お勧め1 space1:取引の始めから利益がstart_at_pips_profit2を超えるまでのチャンネルの幅を決定します。推奨3-5各標準偏差は6ピップに相当します。それはspace2とspace3より広くなければならないので貿易はそれが最初に開かれたときに成長する余地があります。 expand_rate1:取引が均等に破られた後にチャネルが価格にどれだけ近いかを決定します。勧告20-60 start_at_pips_profit2:2番目の設定グループに従う前に、取引が何ピップスの利益を得なければならないかを決定します。勧告40-60 space2:profitがstart_at_pips_profit2を超えた後のチャ
FREE

This indicator draws on the chart high and low prices of different periods . And If you want, Indicator can alert you when the current price arrive these levels. Alert Options: Send Mobil Message, Send E-mail, Show Message, Sound Alert Time Periods: M1, M5, M15, M30, H1, H4, D1, W1, MN Inputs: TimeShift: You can set start hour for calculating. And that way you can see levels independently from broker server's time-zone. PipDeviation: You can set price sensibility for alert (Default: 3) Lines
FREE

28 market in a Single Indicator! You have 8 Lines and each represents a currency { EUR - USD - GBP - JPY - AUD - NZD - CAD - CHF } .
What It Does? It calculates a custom oscillator on all 28 Forex Pairs and draws you the Strength of each currency. This way you can analyze the Trend and the Volatility on a Multicurrency Rate. Also by Clicking on two different currencies instantly changes the market.
How To Use It? You can use this indicator to find true market contractions when two currenc
FREE

このインジケーターは、トレードチャート上でドンチャンチャネルを視覚的に表現するためのものです。ドンチャンチャネルは、特定の期間における最高値と最低値の間の範囲を描画するためのシンプルなテクニカルツールです。このインジケーターは、価格動向の視覚的な分析を向上させ、潜在的なブレイクアウトとトレンドの継続ポイントに関する洞察を提供します。ドンチャンチャネルは、現在の時間枠とより高い時間枠の両方に適用できるため、このオプションを有効にすることができます。 インジケーターの主な特徴: Use_System_Visuals: このパラメータを有効にすると、システムの視覚スタイルとインジケーターの外観を切り替えることができます。有効にすると、インジケーターの視覚的要素はトレードプラットフォーム全体のテーマに合わせられます。 Signal_from_HT_Timeframe: このオプションを有効にすると、より高い時間枠からのシグナルを受信できます。言い換えれば、現在の時間枠でのトレーディングの決定に影響を与えるために、より長い時間枠でのドンチャンチャネルの動作を考慮できます。 HT_Timefram
FREE
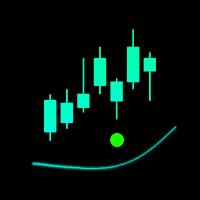
The indicator is designed for fast scalping. The principle of operation of the indicator is based on the direction of the Moving Average.
The period and sensitivity of the Moving Average can be adjusted for yourself in the indicator settings. I recommend watching my advisor - Night Zen EA
Subscribe to my telegram channel, link in my profile contacts. Advantages of the indicator: The free version is full, there are no additional purchases The arrows are not redrawn, the signal comes after
FREE
Ichimoku Signals Scanner This is the Demo version, please download Full version here. Find Ichimoku signals as easy as you can. Ichimoku is one of the most powerful trends recognition indicators. And it has valid signals for the trades. This indicator scans several symbols and time-frames by the Ichimoku to find all the signals that you want and show in a dashboard. It's easy to use, just drag it onto the chart. It's better to add Ichimoku indicator to chart before adding this indicator. Ichi
FREE

Trend is Friends is an line Indicator used as an assistant tool for your trading strategy. The indicator analyzes the standard deviation of bar close for a given period and generates a buy or sell trend if the deviation increases. It good to combo with Martingale EA to follow Trend and Sellect Buy Only/Sell Only for EA work Semi-Automatic. You can use this Indicator with any EAs in my Products.
FREE

LotSize Indicator Discover the appropriate lot size to use in your trades based on the available margin. This indicator provides valuable information for risk management. If the indicator shows a value of 0, it means that your balance or available margin is insufficient for trading. It is important to maintain adequate margin levels for safe trading practices. This indicator is exclusively designed for the MT4 platform, a popular and reliable trading platform in the market. With the LotSize Indi
FREE

Indicator : Forex Reversal Trend The indicator helps investors to identify the earliest and perfect reversal point. Easy to make decision to trade with the trend Price action trading. support resistance and market trends. By technical analysis, the robot creates a short-term strategy to determine the most optimal entry position. Version PRO: https://www.mql5.com/en/market/product/70867 Telegram: https://t.me/tForexSniper
FREE

The intention of the dashboard is to provide a quick overview of the daily, weekly and monthly range of configured assets. In "single asset mode" the dashboard shows you possible reversal points directly in the chart, thus making statistics directly tradable. If a configured threshold is exceeded, the dashboard can send a screen alert, a notification (to the mobile MT4) or an email. There are various ways of using this information. One approach is that an asset that has completed nearly 100% o
FREE

This indicator allows you to find out how much the price can pass on the current bar. It looks for the average ATR value for the previous 5 bars and draws 2 price boundaries. You can use it on any timeframe of any instrument.
Based on this indicator, you can set stop loss and profit levels, as well as use it in other good strategies.
Do not forget to use risk management while trading!
FREE

The indicator My Big Bars can show bars (candles) of a higher timeframe. If you open an H1 (1 hour) chart, the indicator puts underneath a chart of H4, D1 and so on. The following higher timeframes can be applied: M3, M5, M10, M15, M30, H1, H3, H4, H6, H8, H12, D1, W1 and MN. The indicator chooses only those higher timeframes which are higher than the current timeframe and are multiple of it. If you open an M30 chart (30 minutes), the higher timeframes exclude M5, M15 and M30. There are 2 handy
FREE

For traders, monitoring price movements is a constant activity, because each price movement determines the action that must be taken next. This simple indicator will helps traders to display prices more clearly in a larger size. Users can set the font size and choose the color that will be displayed on the chart. There are three color options that can be selected to be displayed on the chart.
FREE

Wicks UpDown Target GJ
Wicks UpDown Target GJ is specialized in GJ forex pairs.
Choppy movement up and down on the opening range every day. Trading breakouts on London session and New York session is recommended.
Guideline Entry Strategy Idea:
Step 1 - Breakout Forming (Warning! Trade on London Session and New York Session) Step 2 - Breakout Starting (Take Action on your trading plan) Step 3 - Partial Close your order & set breakeven (no-risk) Step 4 - Target complete Step 5 - Don't tr
FREE

The purpose of this new version of the MT4 standard indicator provided in your platform is to display in a sub-window multiple timeframes of the same indicator. See the example shown in the picture below. But the display isn’t like a simple MTF indicator. This is the real display of the indicator on its timeframe. Here's the options available in the FFx indicator: Select the timeframes to be displayed (M1 to Monthly) Define the width (number of bars) for each timeframe box Alert pop up/sound/ema
FREE

Indicator overview Trend indicator usage Moving averages. Highest quality alerts that need no introduction. It is completely loyal to the original algorithm and uses other useful features.
Easy to trade Carry out all kinds of notifications It's not a new paint and it's not a back paint. Setting Indicator WMA50 in Time frame H1 for any pair currency and Gold Spot. EMA200 in Time frame H1 for any pair currency and more than EMA250 for Gold spot. Using it for maximum benefit Set up notificatio
FREE

Key Level Key Level is a MetaTrader 4 Indicator that uses a proprietary algorithm based on Price Retracement/Breakout Method to show the Entry-Line on your trading.
Instead, it analyzes data of market and identify entry points and opportunities. (Price Retracement / Price Breakout)
It's also a trading tool that be used to practice and enhance your manual trading skills.
Key Level is an amazing tool for Scalping Trader. It also a trading tool that be used to practice and enhance your manual t
FREE

This indicator displays a complete tick chart with two optional moving averages, and makes paying attention to sub-m1 price data really easy. [ Installation Guide | Update Guide | Troubleshooting | FAQ | All Products ] Identify price spikes easily The blue line is the ask price The red line is the bid price The indicator doesn't lose tick data when reloaded It implements two optional moving averages The indicator is non-repainting
Input Parameters
Display Moving Averages: Display or hide the
FREE

The indicator helps to identify possible rollbacks and reversals. Shows the direction of the price movement and is painted in the appropriate color. Allows you to conduct trend and counter trend trading It works on all timeframes, on any currency pairs, metals and cryptocurrency Can be used when working with binary options Distinctive features Does not redraw; Simple and clear settings; It works on all timeframes and on all symbols; Suitable for trading currencies, metals, options and cryptocurr
FREE

The MT4 indicator that we are describing is designed to provide traders with an alert, notification, and email when Fibonacci levels are crossed. The Fibonacci levels are calculated based on the zigzag indicator, which helps to identify potential trend reversals in the market. When the indicator detects that a price has crossed a Fibonacci level, it will trigger an alert and send a notification to the trader's MT4 mobile app. Additionally, the indicator can be configured to send an email to the
FREE

This is a unique tick chart indicator for MetaTrader 4 platform. The software is capable to graphically display the last 100 ticks and in addition to that it displays the current spread, bid / ask and time values in an elegant IceFX style dashboard. The indicator is an efficient tool for traders using M5 or even M1 timeframe.
Indicator parameters: Corner - corner of panel CornerXOffset - horizontal offset from the corner CornerYOffset - vertical offset from the corner ChartType - type of cha
FREE

Candlestick Oscillator is a truly unique Oscillator that uses the concepts of within candlestick trading called the Record Session High. This is a method of analysing candlesticks to gauge when a trend might be wearing out and therefore ready for reversal or pause. We call it a record session high when we get 8 or more previous candles that have higher closes. We call it a record session low when we get 8 or more previous candles that have lower closes.
We don't rely on the typical Oscillatio
FREE
Lord Info は、META TRADER 4 プラットフォーム上の金融市場の指標です。
Lord Info は、プラットフォーム上の任意の株式/通貨ペアに配置できます。
Lord Info は、過去 (10) 日間または設定可能な ATR レポートを表示して、ペアの基本ボラティリティとその結果を確認できます。
アベレージ トゥルー レンジ (ATR) は、テクニカル分析で使用される市場のボラティリティの指標です。 これは通常、一連のリアルレンジ指標からの 14 日間の単純移動平均から導出されます。 ATR はもともと商品市場で使用するために開発されましたが、その後あらゆる種類の証券に適用されています。
Lord Info は、Hi-Low (高値/安値)、日次、ローソク足の電流、および最後のローソク足を表示します。
操作の長短の切り替え。
分析パフォーマンスを得るために、ストップレベルを簡素化およびカスタマイズしました。
Lord Oscilator、自動タイムフレーム識別: M1、M5、M15、M30、H1、H4、D1、パーソナライズされたインジケ
FREE

The GTAS BSI is an indicator designed to provide the trend direction and buy/sell signals, using combination of momentum indicators. This indicator was created by Bernard Prats Desclaux, proprietary trader and ex-hedge fund manager, founder of E-Winvest.
Description The BSI indicator is represented as a histogram under the price chart. +100 (green) value indicates a bullish trend. -100 (red) value indicates a bearish trend. When the BSI turns to +100 (green), it gives a potential buy signal. W
FREE

Engulfing candlestick patterns are comprised of two bars on a price chart. They are used to indicate a market reversal. The second candlestick will be much larger than the first, so that it completely covers or 'engulfs' the length of the previous bar.
By combining this with the ability to look at trend direction this indicator eliminates a lot of false signals that are normally generated if no overall trend is taken into consideration
FREE

アカウントの残高とシンボルのスプレッドをリアルタイムで監視できる優れたユーティリティツール これにより、データを正確に特定する方法、たとえばプロップファームの口座を持っているかどうか、正しいラベレージやスプレッドが操作されているかどうかなどを知り、正確なロットを作成する方法がわかります。
レバレッジとスプレッドインジケーターの組み合わせ。 取引口座のレバレッジとスプレッドを自動チェックするためのツール。 すべてのブローカー外国為替株で働いています。 ブローカー外国為替のレバレッジ変更を監視したり、経済ニュースの発表中に拡散したりする場合に役立ちます。 現在のシンボルのリアルタイムスプレッドチェック。 取引口座のリアルタイムレバレッジチェック。 高速更新による分かりやすいデザイン 等
FREE

Fibonacci retracement is really one of the most reliable technical analysis tools used by traders. The main problem with using these levels in trading is that you need to wait until the end of the impulse movement to calculate the retracement levels, making difficult to take a position for limited retracement (0.236 or 0.382). Fibo Dynamic solves this problem. Once the impulse movement is identified the retracement levels are automatically updated allowing very dynamic trading in trends with onl
FREE

BeST_Chande RAVI (Range Action Verification Index) is an MT4 Indicator that is based on the corresponding indicator developed by Tushar Chande which is mainly based on market momentum while focuses on identifying ranging and trending markets.
By default RAVI is defined by the formula: RAVI = Absolute value (100 x (SMA(7) – SMA(65)). Also by default there is an arbitrary reference level of 3% that means a market is ranging if the RAVI is less than 3%, or trending strongly if it is is greater t
FREE

This indicator filters the Zigzag indicator to calculate the main support and resistance
levels.
Variables
minimum gap between peaks : is the distance (GAP) between the peaks of
the Zigzag
peaks sensitivity : Minimum number of nearby peaks
look back: it means that it has to test the last 50 peaks in the Zigzag
object name perfix: a prefix for level’s line name on chart
FREE
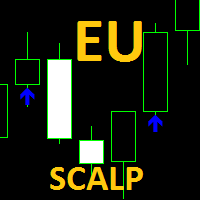
アラート付きのスキャルピングインジケーター:
EU頭皮インジケーターは2つのワーキングセットの組み合わせです。1つは価格変動の方向に逆らって機能するように事前設定されており、2つ目は価格変動またはブレイクアウトが発生する確率に基づいて価格変動の方向に取り組んでいます。重要な貿易レベル。
デフォルト設定は、EurUsdペアM5タイムフレーム用に最適化されています。その他の設定は、最初のコメントの「コメント」セクションにあります。
期待される結果と取引レベルの値を取得したい場合は、チャートにロットziseの推奨事項が表示されます。トレードレベルも線としてチャートに描かれます。
インジケーターは、価格がアクティブな取引レベルの1つに達したときにアラートを送信するように事前設定されており、矢印は買い(青)または売り(赤)を示し、注文を閉じる必要がある場合も示します。注文アラートは、新しいろうそくが表示され、最後のろうそくの本体によって取引レベルが破られた場合にのみアクティブになります。
この指標のように機能するエキスパートアドバイザーは、私の売り手プロファイルにあり、さら
FREE

The product Divergence Cci Force Stddev Ac Atr is designed to find the differences between indicators and price. It allows you to open orders or set trends using these differences. The indicator has 4 different divergence features.
Divergence types Class A Divergence Class B Divergence Class C Divergence Hidden Divergence
Product Features and Rec ommendations There are 5 indicators on the indicator Indicators = CCI, Force, Stdandard Deviation, Acelereator, Atr 4 different divergence ty
FREE
Moving average cross over notification !
How to use Add NotifyMaCross indicator into the chart. Set Moving average line one and two. Wait the notification when moving average cross over Support for development : https://www.buymeacoffee.com/itwetrade
Check out all indicator and expert advisor here https://www.mql5.com/en/users/thanksmybot/seller ------------------------------------- Como usar
Adicione o indicador NotifyMaCross ao gráfico.
Defina a linha média móvel um e dois.
FREE

MTF Heiken Ashi MA is a multiple timeframe Heiken Ashi & Moving Average indicator. Fully customizable for advanced & unique Heiken Ashi & Moving Average calculations.
Key Features Modified appearance and appeal from the traditional using only H eiken Ashi MA bodies. MTF Higher or lower timeframes available making this it great for trends and scalping. There are many settings that can be non-repaint for signals at a new bar and at bar 0.
Inputs Timeframe = PERIOD_CURRENT - timeframe of Movin
FREE

The Bolliger Bands On-Off let you control the indicator using the keyboard or a button . You can choose if you want the indicator always shown or always hided while switching among different time frames or financial instruments . ---> This indicator is part of Combo Indicator OnOff
The Bollinger Bands identify the degree of real-time volatility for a financial instruments . A lower amplitude corresponds to a low volatility, conversely a greater bandwidth corresponds to high volatility.
FREE
D1 Free Fibo Channels with support and resistences...
Become a constantly profitable 5-star forex trader!
We offer a few indicators to support you understand and analyse the market! With our strategies you will improve your trading system and bacome an expert...
We have indicators for trend direction, market direction and others.. for multi-time frames and that covers all majors or your favorite trading symbols! Some of them offer a customizable calculation parameters... or Graph features
FREE

Индикатор показывает максимальное отклонение от скользящей средней за заданный период. Границы канала могут послужить своего рода зонами перекупленности/перепроданности, от которых может произойти откат цены к центру канала. За этими уровнями и стоит искать дополнительные сигналы для входа в сделку. В настройках индикатора всего 2 параметра - период, за который будет расчитываться индикатор и метод усреднения скользящей средней.
FREE

Indicator overview Trend indicator usage Moving averages. Highest quality alerts that need no introduction. It is completely loyal to the original algorithm and uses other useful features.
Easy to trade Carry out all kinds of notifications It's not a new paint and it's not a back paint. Setting Indicator SSMA50 in Time frame H1 for any pair currency and Gold Spot. EMA200 in Time frame H1 for any pair currency and more than EMA250 for Gold spot. Using it for maximum benefit Set up notificati
FREE

This indicator integrates the Bollinger Band strategy in calculation with a volume-over-MA
calculation to further narrow down "Areas of Interest" levels for a potential re-test zone to the right of the chart.
We added a Moving Average calculation for a multi-level cloud and further broke down more conditions to highlight both
volume flow crossover on the High and Extreme High MA's and also high and extreme high volume spikes on set period average
without bull\bear conditions. Original Bull
FREE
Classical Keltner Channel Indicator, Extended version. Works on any instruments. It shows Keltner Bands under these parameters: * periodMa - Period of Moving Average * periodAtr - Period of ATR (Average True Range) * atrMultiplier - ATR Multiplier, multiplies range, calculated by PeriodATR parameter * modeMA - modes of moving average (MA) calculations (Simple, Exponential, Smoothed, Linear Weighted) * modePrice - modes of Price calculations for MA (Close, Open, High, Low, Median, Weighted) T
FREE
This indicator helps you to Scan symbols which are in the Market Watch Window (in demo Max 15 Symbol) and filter out trends with alerts. It works based on the most popular indicator "Bollinger Bands" which is used by many traders for trading: When box color changes to " Green " or " Red " color, it indicates you for trend change for long and short entry. And also you will get alerted on screen. When it changes to " Green ", it indicates you that trend is going upwards, and you can take the long
FREE
Highly configurable Average True Range (ATR) indicator.
Features: Highly customizable alert functions (at levels, crosses, direction changes via email, push, sound, popup) Multi timeframe ability Color customization (at levels, crosses, direction changes) Linear interpolation and histogram mode options Works on strategy tester in multi timeframe mode (at weekend without ticks also) Adjustable Levels Parameters:
ATR Timeframe: You can set the lower/higher timeframes for ATR. ATR Bar Shift: y
FREE

Bigger chart labels would allow the user to be entirely aware of which chart he/she is on. Each chart window is unique, containing different patterns and economic motives so acknowledging the chart window would be absolutely essential! There are well known Economic Time Zones included in clear view, by choice! Simple does it! Use your computing mouse scroller, clicking with the right finger on the label, in order to customize the label properties. From there, choose your preferred color,
FREE

Necessary for traders: tools and indicators Waves automatically calculate indicators, channel trend trading Perfect trend-wave automatic calculation channel calculation , MT4 Perfect trend-wave automatic calculation channel calculation , MT5 Local Trading copying Easy And Fast Copy , MT4 Easy And Fast Copy , MT5 Local Trading copying For DEMO Easy And Fast Copy , MT4 DEMO Easy And Fast Copy , MT5 DEMO
Strongly recommend trend indicators, automatic calculation of wave standard and MT5 ve
FREE

The Moving Average Slope (MAS) subtracts the moving average level n-periods ago from the current moving average level. This way, the trend of the moving average can be drawn on the moving average line.
Features Observe uptrends and downtrends at a glance. The indicator is non-repainting. Returns buffer values for the trend of the moving average to be used as part of an EA. (see below)
Inputs Moving Average Period : The period of the moving average (MA). Slope Period : Number of periods betwe
FREE
ATR on Prices is simply an ATR indicator that plot a line for Resistance and Support using the Average True Range calculation. You can set the ATR daily periods, to be calculated. As well you can set the reference price to add and subtract the ATR measure to obtain the ATR Top and ATR Bottom lines, using the Open Price (that is fixed) or the Middle (HL/2) price (that will vary on the day) Or adding the ATR to the daily low and subtracting it from the daily high . You can use full ATR measure or
FREE

Rainbow MT4 is a technical indicator based on Moving average with period 34 and very easy to use. When price crosses above MA and MA changes color to green, it’s a signal to buy. When price crosses below MA and MA changes color to red, it’s a signal to sell. The Expert advisor ( Rainbow EA MT4) based on Rainbow MT4 indicator, as you can see in the short video below is now available here .
FREE

Indicator of vertical lines on the timeframes М5 and М1. It draws the lines for the period of the current day and the previous day. This indicator visualizes visually shows the trader the beginning and end of the chart hour, as well as the past hourly periods, 30-minute and 5-minute chart intervals. The advantage provided by this indicator is that the trader using this indicator on a chart of a currency pair with the smaller timeframe will always be aware of when the new hour begins.
On the co
FREE

Description This is an indicator that colors market moods on a linear chart in the window of the main financial instrument. It is useful for determining support and resistance levels. Purpose The indicator can be used for manual or automated trading as part of an Expert Advisor. For automated trading, you can use values of indicator buffers of the double type: rising line - buffer 0, must not be equal to EMPTY_VALUE. falling line - buffer 1, must not be equal to EMPTY_VALUE.
FREE

GMMAインジケーター移動平均線の束が海の波のようなところが視覚的に見やすいので使用してましたが、 MT4で12本の移動平均線描画するとちょっと邪魔だなぁと感じてました。 とりあえず4本あれば私には十分なので、一目均衡表の雲みたいに見やすくすることを目的として作成しました。 長期と短期が交わるところを色を変更したので、交差してる部分も見やすくなってると思います。
今後バージョンアップするとしたら、長期短期交差の色を設定で変更できるようにしようかな。
他の製品 https://www.mql5.com/ja/users/studiotam/seller
これ以上何も書くことないんですが、文字数制限あるんですよね。
FREE

Multi-Asset Forex Scanner
This indicator allows you to scan multiple assets at once, sending you configurable alerts when any asset touches daily pivot levels 1, 2 or 3.
The original code was just modified to send alerts to MT4 Desktop, MT4 Mobile or Email. (Credits for the original code go to Carlos Oliveira)
In order to receive mobile or Email alerts you must configure Notifications and Email sections in the MT4 platform.
In addition to pivots, this indicator also shows ATR, Volume,
FREE

Economic Calendar Viewer
This economic events reader is adapted to load data from a csv file. You can prepare the csv file yourself according to this template, you can do it in notepad or csved. The file should normally be named Calendar-MM-DD-YYYY.csv. And contain lines with data column headers according to this example. In the Impact column, i.e. impact on the market depending on the importance of the event, the names accepted from the least important are: None, Low, Medium, High. In column
FREE

Candle Timer displays the time remaining until closing the current Bar, and a new bar forms.
Feature simple to use . no lag or delay . customize position, color & font Size . server time not local time.
Inputs
- position * Beside Active Candle ( Default ) * Right Upper * Lift Upper * Right Bottom * Lift Bottom - font size * 14 (Default) - color * SpringGreen (Default)
FREE

The range indicator means the average daily price movement. For convenience, it is visually displayed on the charts, but with the H4 timeframe and below. The indicator is redrawn daily and the gaps are included in the calculation. An additional dotted line means 80% of the daily movement passed. An important tool in the arsenal of a professional trader or someone who wants to become one. PrimeTools is a series of products designed for correct and professional trading. [ PrimeTools Levels | Prim
FREE

Quantum Swing 1. What is Quantum Swing The indicator calculates and displays future price levels based on quantum mathematics with high accuracy of probability and direction. Levels are displayed in the form of zones for making trading decisions; they clearly define a narrow price range for placing orders with a minimum stop-loss and maximum take-profit. The indicator displays future trading zones on different timeframes H1, H4, D, W. Quantum oscillations are also displayed without reference to
FREE

Traditional RSI is one of the most popular and must-known indicator that every traders would use. In this combination, we use two RSI period with smoothed factor to smooth the RSI lines for better results. Besides, bottom of Indicator is the Trend-filter display in different colors in order to let Traders identify the trends much easier Grey : Sideway market Light-Blue : Weak UP-Trend Blue : Strong UP-Trend Light-Red : Weak DOWN-Trend Red : Strong DOWN-Trend Signal: Blue-Arrow
FREE

As the title says, this is an indicator that shows the current open market (session). It has 4 sessions with customizable schedule : 1. London session, 2. New York session, 3. Sydney session, 4. Tokyo session.
Indicator inputs: - The color of each session. - The open time and close time of the sessions. - The line width.
The objective of the indicator, is to follow each sessions, observe at what times are multiple sessions open, and thus take the chance of the high market movements.
FREE

The indicator marks up charts in its own way. In contrast to the standard marking method, VR Grid marks chart with the specified step and links the grid to round price values. The VR Grid indicator keeps the mark up and scale, so that the grid cells always have a constant size. Advantages It builds a custom grid on the chart. The grid is linked to circular levels. It is possible to set any step for the grid. You can set the color, style, and thickness for the entire grid or for specific levels.
FREE

3 strategies with RSI! Alerts! Signal freshness check! The indicator is based on the classic RSI. I recommend watching my advisor - Night Zen EA It includes 3 strategies: Entry of the RSI indicator into the overbought zone (for buy trades) / oversold (for sell trades) Exit of the RSI indicator from the overbought zone (for sell trades) / oversold (for buy trades) Touching the overbought limit (for sell trades) / oversold (for buy trades) The indicator provides alerts. To enable them in the s
FREE

The MACD_stopper_x2 indicator shows where the trend has a tendency to stop or reverse. It uses the standard MACD indicator and a proprietary formula for processing data obtained from MACD. There are 2 types of stop/reversal signals: Small cross - probability of a trend stop/reversal is 70-80%; Large cross - probability of a trend stop/reversal is 80-80%; If there are open trades (for example, BUY) on the symbol the indicator is attached to, and the BUY trend ends, the indicator sends push notifi
FREE
MA intersection indicator.
At a selected period, the indicator finds the best of the periods MAs on profit with considering the ratio of losses and profits. (Auto-optimizing MA) Entering a long position is the cross of fast MA from the bottom to up through long MA.
For a short position - vice versa.
The best of the periods is displayed. MAs are also drawn.
In the settings, it is possible to select the period of bars / candles for find better solution.
Also, the time period of the upda
FREE

This indicator applies the biquad high pass filter to the price-chart data, and displays the filter output for the OHLC as candlesticks. The candlesticks corresponds to the actual calculations of the filter value during the formation of each price bar (not from all historical highs lows or closes). The shape of the bars therefore corresponds directly to the shape of each price bar. High pass filters are an underappreciated type of oscillator that are seldom used in technical analysis in the st
FREE

LOOK AT THE FOLLOWING STRATEGY WITH THIS INDICATOR. Triple RSI is a tool that uses the classic Relative Strength Indicator, but in several timeframes to find market reversals. 1. ️ Idea behind the indicator and its strategy: In Trading, be it Forex or any other asset, the ideal is to keep it simple, the simpler the better . The triple RSI strategy is one of the simple strategies that seek market returns. In our experience, where there is more money to always be won, i
FREE

Momentum channel is a simple momentum based system yet with a great degree of accuracy in detecting turning points. The market momentum are defined by Average True Range Channels . When price breaks these channels most times , it is an indication of a shift in market momentum and thus a possible new trend formation. The system can be traded on any time frame and symbol and can also be used to trade commodities and stocks.
INPUT MENU ATR_Period : Average True Range Momentum Period
ATRMultip :
FREE
MetaTraderマーケットは、他に類のない自動売買ロボットやテクニカル指標の販売場所です。
MQL5.community ユーザーメモを読んで、取引シグナルのコピー、フリーランサーによるカスタムアプリの開発、支払いシステムを経由した自動支払い、MQL5Cloud Networkなど、当社がトレーダーに対して提供するユニークなサービスについて詳しくご覧ください。
取引の機会を逃しています。
- 無料取引アプリ
- 8千を超えるシグナルをコピー
- 金融ニュースで金融マーケットを探索
新規登録
ログイン