适用于MetaTrader 4的免费技术指标 - 18

Trend Graf - это инструмент позволяющий видеть тренд текущего момента,имея стартовые диапозоны которые появляются каждые шесть часов ,способен давать нам уровень предела коррекции как по тренду так и на смену ему.Работает на всех валютных парах!В настройках мы имеем смещение для проекции стартового диапозона от текущей установки ,для каждой валютной пары можно подобрать то смещение, которое лучшим образом будет показывать предел коррекции.Следующее обновление будет включать сигнальные указатели!
FREE

Intraday Pulse – Indicatore per il Prezzo Medio Intraday Intraday Pulse è un indicatore progettato per determinare il prezzo medio intraday alla chiusura giornaliera del grafico. Grazie al suo algoritmo avanzato, traccia automaticamente il livello di riferimento, fornendo un supporto essenziale per strategie di trading efficaci. Nota bene: il grafico giornaliero e' ideale per utilizzare l'indicatore (D1). Aggiorna il time frame alla fine della sessione giornaliera.
L'indicatore è versatile e ut
FREE

Spread Sekanas: The True Cost of Your Trade Stop guessing with pips and points. Start seeing the real , proportional cost of the spread with the Spread Sekanas indicator. The traditional spread, measured in pips, is misleading. A 2-pip spread on EUR/USD is completely different from a 2-pip spread on GBP/JPY or a $2 spread on Gold. This makes it impossible to consistently compare your real trading costs across different instruments. The Spread Sekanas indicator solves this problem by measuring th
FREE

TMA Classic – 三角移动平均指标简介 TMA Classic 是一款非常简洁且轻量的指标,采用 三角移动平均(Triangular Moving Average) 以一条平滑的线条显示。它能够有效滤除过多的噪音,捕捉价格的中心趋势,有助于判断趋势方向及区间震荡。 由于仅显示单线,该指标在图表上具有很高的可视性,不会与其他指标或蜡烛图价格数据发生冲突。 主要特点 实时显示三角移动平均线,平滑且连贯 抗短期噪音干扰,直观展现趋势流动 设计简洁轻便,适合同时监控多个货币对及时间周期 可作为趋势判断的辅助工具,帮助筛选入场时机 计算原理详解 三角移动平均(TMA)是通过对简单移动平均(SMA)进行二次平滑计算得到的。该方法生成的曲线比单一SMA更平滑,有效过滤随机短期波动,更清晰反映价格整体走势。 定义 TMA(n) = SMA( SMA(Close, n), n ) 参数 n:周期(例如20)
Close:收盘价(可根据需要修改)
SMA:简单移动平均 在交易中,价格位于TMA线之上时通常代表上涨趋势,位于下方时代表下跌趋势,可作为趋势方向和强度的参考。 参数设置 参数名 说明
FREE
MACD Optimiser – AI-Enhanced MACD Settings for Smarter Trading The MACD Optimiser is an advanced tool that supercharges the classic MACD indicator by automatically finding the best parameter settings for different market conditions. Powered by AI and historical data analysis, it eliminates guesswork and helps traders make more precise, data-driven decisions. Why Use MACD Optimiser? Automated Optimization – No more trial-and-error. The tool fine-tunes the MACD’s fast EMA, slow EMA, and sign
FREE

Este indicador irá ajudá-lo a traçar as linhas do horizonte ( Marcelo Ferreira ) do Grafico semanal. Você poderá mudar trabalhar por exemplo em M5 ou M15. As linhas semanais permanecerão lá. Analisar as tendências em gráficos semanais antes de fazer uma entrada no mercado Forex é essencial para identificar a direção predominante do mercado a longo prazo. Esse tipo de análise ajuda a evitar decisões impulsivas baseadas em flutuações de curto prazo e fornece uma visão mais clara sobre o movimento
FREE
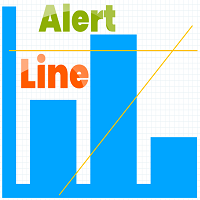
Indicator Rua Alert Line. This indicator will notify when the High-price of candle breaks any TrendLine or HorizontalLine on the chart. Notifications will be sent to the phone and on MT4. And it have ArrowBuy/ArrowSell on chart. It is very useful for those of you who use the TrendLine or HorizontalLine but do not have time to observe the chart. Timeframe M1 to W1 Symbol: All
FREE
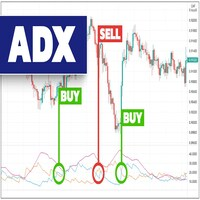
The indicator provides buy and sell signals on the charts every time ADX DI- and DI+ crosses each other. Blue arrow for uptrend (DI+>DI-). Red arrow for downtrend (DI->DI+). This technical analysis tool can be applied to various trading strategies. The ADX Crosses Signals Indicator is based on the Average Directional Index Metatrader Indicator. The ADX is a lagging indicator, meaning that a trend must already be established before the index can generate its signal.
Inputs PERIOD; AlertOn
FREE
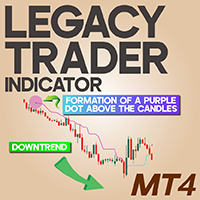
Legacy Trader Indicator for MetaTrader 4 The Legacy Trader Indicator is a powerful tool developed to detect trend direction and market momentum within the MetaTrader 4 platform. It features a dynamic line, colored dots, and a text label positioned in the chart’s corner to indicate current trend conditions. With this indicator, traders can pinpoint optimal entry and exit opportunities. It also functions as a trailing stop system, where the area behind the dynamic line offers ideal zones for plac
FREE

A combined indicator of two famous indicators: RSI , Bollinger Bands Can be used in all currency pairs Can be used in all time frames with many signals Very simple and fast to use
Description:
This indicator is made from the combination of RSI and Bollinger Bands indicators
As you can see, it shows good signals and is worth using and testing
We hope you are satisfied with this indicator
Settings: show past show candle: Displays the number of candles that the indicator calculates.
For example
FREE

Variable Index Dynamic Average (VIDYA) developed by Tushar Chande by default is contained in MT5 but not in MT4 platform and it is a dynamic EMA (Exponential Moving Average) that adjusts its Length (LB Period) automatically in response to Market Volatility originally measured through the Chande Momentum Oscillator(CMO). CMO value is used as the ratio to the smoothing factor of EMA ( The New Technical Trader by Tushar Chande and Stanley Kroll, John Wiley and Sons, New York, 1994). The higher th
FREE

Blahtech Moving Average indicator is a multitimeframe version of the standard Moving Average indicator. It is also enhanced with customisable alerts, period breaks and other configuration options. The 50 day and 200 day moving averages are widely followed by investors and traders, with breaks above and below the MA lines considered to be signals of interest. Links [ Install | Update | Training | All Products ]
Feature Highlights Up to three timeframes Configurable calculation variabl
FREE

H I G H - P R O B A B I L I T Y - B R E A K O U T T R E N D L I N E I N D I C A T O R This is no ordinary trendline indicator. It has a highly-probability algorithms incorporated in the script to display only trendlines that may give a very high chance of price breakout. The indicator is not a stand alone indicator. Trader should interpret it together with their very own analysis technique to come up with a more efficient trading strategy. You can use with it other trend indica
FREE

ITS FREE I Recommend www.CoinexxBroker.com as a great broker and the one I personally use Asia session 1:00 to 9:00 (6pm est to 2 am est) Eur means London Session 10:00 to 18:00 (3 am est to 11 am est) USA means New York Session 15:00 to 23:00 (8 am est to 4 pm est) Session indicator highlights the start of each trading session. You can show all sessions or edit the settings to only show the hours you want highlighted (Asia) means Asian Session ,(Eur) means London Session , (USA) means New
FREE
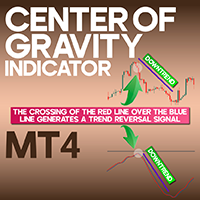
Center of Gravity (COG) Indicator MetaTrader 4 The Center of Gravity (COG) Indicator is a non-lagging oscillator designed for MetaTrader 4 (MT4) that enables rapid identification of price reversal points. It operates using two oscillator lines: a red line , which generates the confirmation signal, and a blue line , which verifies the trend direction. A trend reversal signal is triggered when the red line crosses the blue line. «Indicator Installation & User Guide» MT4 Indicator Installat
FREE

Chart Time Indicator is very simple and easy, but it can be very important to control the time before opening any manual trade. This indicator shows the time on the chart between 3 different options.
Input parameters Show Time : Select all the time options that you want to see. Local Time (Personal Computer Time), Server Time (Broker Time) or GMT Time. Recommendations: Use only one Chart Time Indicator for each chart.
FREE

The indicator is based on identifying engulfing candlestick patterns within the current timeframe. When such patterns are found, it generates buy and sell signals represented by up and down arrows, respectively. However, the user is responsible for determining the prevailing trend. Once the trend is identified, they should trade in line with the corresponding signal that aligns with the trend direction.
FREE

Heiken Aish indicator that generates alerts when the market changes direction. It eases the visualization of market volatility, providing greater calm when making decisions. Blue means buying and yellow means selling. A candle without a wick indicates a strong trend, i.e., blue candles without wicks at the bottom indicate a strong buying trend and vice versa, yellow candles without a wick at the top indicate a strong downtrend.
FREE

NOTE!: The trend vote and the buy sell option shall match to the same direction before you put a trade!!
Indicator that uses Kalman filters (same as used on autonomous vehicles for data fusion between different sensors / technologies such as RADAR, LIDAR and Camera with Artificial Intelligence for object detection) by using the high and low price in order to identify buy and sell signals as indicated on the graph.
This indicator can be used on any timeframe with any currency or symbol.
This i
FREE

Supertrend Moving Average A combination of Supertrend and Moving Average to create a converging trade setup Input parameters: signal mode: set it to true if you want to plug it into STAT (Signal Tester and Trader) arrow shift: distance between fast EMA line to arrow on chart turn on moving average signal for converging setup supertrend period ATR multiplier Moving average period Averaging method Pricing You can find the best setting for 4 hour EURUSD on this video
FREE

The recommended timeframe is H1!
The indicator has two kinds of signal.
This is a signal to open a position from the appearance of an arrow. The price leaves the channel In the first case, the indicator builds arrows based on the constructed channel and Bollinger Bands years.
In another case, the trader can trade if the price just went beyond the channel. If the price is higher than the channel - we sell. If the price is lower than the channel, then you can look for a place to buy.
It can al
FREE

The indicator draws price channels. It can be customized so that only buy or sell channels are displayed. Also, trend lines can be displayed instead of channels. This indicator is easy to use, but nevertheless, there are many trading strategies based on channel trading. Advisor based on this indicator: https://www.mql5.com/en/market/product/37952 Parameters History - maximum number of bars to build channels; Distance - minimum distance from one High (or Low) to another when constructing a chann
FREE

Investment Castle Support and Resistance Indicator has the following features: 1. Dictates the direction of Buy or Sell trades based on Support and Resistance Levels automatically . 2. Candles stick colors will change to Red for Sell and Blue for Buy (Default settings, user can change from the inputs). 3. This indicator is built-in the Support & Resistance based Investment Castle EA which works with Psychological Key Levels "Support & Resistance".
FREE
This Dashboard is free to download but is dependent on you owning the Flag Trend Pro MT4 indicator. Down load the indicator: Flag Trend Pro
The Dashboard will show you on a single chart all the timeframes (M1 to Monthly) with their own status for the indicator: Gold Pro MT4
all time frame and all symbol: smart algorithm detects the trend, filters out market noise and gives entry signals!!!
How to understand the status: symbol - Fill All the Pair what you want. M1, M5, M15,M3
FREE
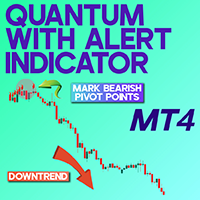
Quantum with Alert Indicator MT4 The Quantum with Alert Indicator MT4 is a versatile trading tool designed to highlight potential pivot areas in the market using visual signals. These marked regions often act as possible reversal points , helping traders anticipate where price may change direction. Depending on their strategy and market outlook, traders can use these signals to open or close positions with greater confidence. «Indicator Installation & User Guide» MT4 Indicator Installation | Q
FREE
Highly configurable Moving average indicator.
Features: Highly customizable alert functions (at levels, crosses, direction changes via email, push, sound, popup) Multi timeframe ability Color customization (at levels, crosses, direction changes) Linear interpolation option Works on strategy tester in multi timeframe mode (at weekend without ticks also) Parameters:
MA Timeframe: You can set the lower/higher timeframes for Ma. MA Bar Shift: Y ou can set the offset of the line drawing. MA Period,
FREE
This indicator is an interpretation of the Average Directional Movement Index (ADX), which helps to determine the presence of a price trend. It was developed and described in detail in the book "New Concepts in Technical Trading Systems" by Welles Wilder. The presented indicator displays signals on the price chart when +DI and -DI cross and signals when the ADX value falls or rises in relation to the mutual arrangement of +DI and -DI. The indicator's buy signals also work as a support level, whi
FREE
Drawdown Alerts Free ! Meta Trader 4 Indicator. Please leave a review about this product to help other users benefit from it. This Drawdown Alerts indicator shows the drawdown percentage in real time and alerts you when the limit you specify is reached. Calculation of drawdown depends on the amount of the trade balance. You can customize Drawdown Alerts for Corner - Left , Right , Up , Down X Y Color Number of decimal digits Popup messages and sound - Turn on / off notifications Notification
FREE
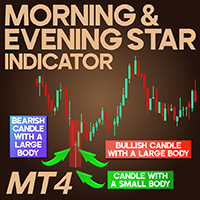
Morning & Evening Star Indicator for MetaTrader4 The Morning & Evening Star Indicator is developed to detect and display reversal patterns based on candlestick formations. This MT4 chart pattern indicator highlights the Morning Star pattern with a blue box and the Evening Star pattern with a pink box. These reversal patterns usually emerge at the end of prevailing trends, signaling a potential shift in price direction. «Indicator Installation & User Guide»
MT4 Indicator Installation | Mornin
FREE

MACD divergence Simple edition 原始MACD计算方式,升级为双线MACD,使判断更加直观更加贴合大宗交易平台的研究习惯,同时还会自动用实线标出背离,不用再从0开始苦学钻研。
同时,我还提供了提醒服务,在你忙于家务无暇顾及的时候只需要打开音响,一旦达成背离,第一时间就会让你知晓。
这是一款简单版的看背离指标,MACD的九天均线被称为“信号线”,然后绘制在MACD线的顶部,它可以作为买入和卖出信号的触发器。当MACD越过信号线时,交易员可以买入操作,当MACD穿过信号线以下时,交易者可以卖出或做空操作。移动平均收敛-发散(MACD)指标可以用几种方法解释,但更常见的方法是交叉、散度和快速上升/下降。
FREE

The indicator is a 15-minute signal indicator for all types of traders. Meaning, you could make lots of profits trading two different signals in one indicator.
NOTE: Both indicators are channels for achieving the same result. RED ARROW -- Sell Signal BLUE ARROW -- Buy Signal
Purchase now to be part of our community. We offer standard chart setups for both novice and intermediate traders. Trade with ease!
FREE
Free RSI Divergence Indicator for MetaTrader 4 This RSI Divergence Indicator for MetaTrader 4 is designed to help you automatically identify key market opportunities through precise detection of divergences between price and RSI. It’s ideal for both beginner and advanced traders looking to enhance their technical analysis strategy. Main Features: Automatic RSI Divergence Detection (Bullish & Bearish):
Automatically identifies bullish and bearish divergences between price action and RSI valu
FREE

Highly configurable Fisher Transform indicator.
Features: Highly customizable alert functions (at levels, crosses, direction changes via email, push, sound, popup) Multi timeframe ability Color customization (at levels, crosses, direction changes) Linear interpolation and histogram mode options Works on strategy tester in multi timeframe mode (at weekend without ticks also) Adjustable Levels Parameters:
Fisher Transform Timeframe: You can set the lower/higher timeframes for Stochastic. Fisher
FREE
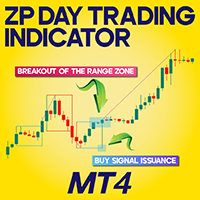
ZP Day Trading Indicator in MT4
The ZP Day Trading Indicator identifies price range zones and displays them using colored boxes on the chart. Price fluctuations within a defined area, between a support and resistance zone, form the trading range zone. This indicator is developed based on the Price Action trading style and, besides marking the zones, provides entry signals for trades. «Indicator Installation & User Guide»
MT4 Indicator Installation | ZP Day Trading Indicator MT5 | ALL Produ
FREE
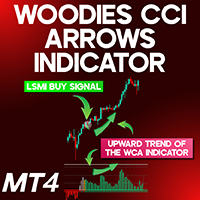
Woodies CCI Arrows Indicator for MetaTrader 4
The Woodies CCI Arrows Indicator for MetaTrader 4 (WCA) is a momentum-based tool that relies on a 14-period Commodity Channel Index (CCI) within the MT4 platform. This custom indicator blends multiple components, including the standard CCI and the Least Squares Moving Average (LSMA). When the CCI maintains an upward slope for six consecutive candles, the indicator highlights this in green. Conversely, a sustained downtrend for six bars is marked in
FREE

Screener Breakout Congestion: Have you ever missed a trading opportunity because you were not looking at the chart of that market in that specific time frame? Here is this screener to help you identify congestion breakouts in the markets you want to follow in the different time frames required. Once you have identified the markets (forex, indices, CDF) and the different time frames (1M, 5M, 15M, 30M, 1H, 4H, Daily), the screener is represented by several buttons that change colour when the conge
FREE

Daily Weeky Info
it shows you Daily open and weekly open and daily trend open (ie) daily open > previous day open and weekly trend open (ie) weekly open > previous week open Day high low and weekly low high and previous week high and low it will help you to decide your trade no need to check higher timeframe when you trade intraday,
dont trade against the daily trend and daily open level
FREE
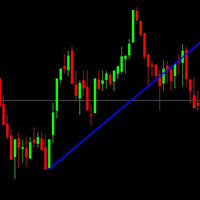
This is just a simple indicator that show Alert when the Current candle Close Below the Trendline. Previous candle do not affect the Alert.
The indicator is tied to the Trendline so if the Trendline is accidentally deleted, the Alert will not work. The indicator will draw another Trendline if the current Trendline is deleted.
Removing the indicator will removed the Trendline.
There are 4 type of Alert to set: Popup Alert, Signal Alert, Push Notification, Comment.
FREE

BB & RSI Candle Color: Technical Analysis Indicator on MetaTrader 4 The "BB & RSI Candle Color" indicator is a powerful technical analysis tool designed for MetaTrader 4 traders looking for an effective visual representation of market conditions. Created by 13 Crow Trading Club, this indicator combines the popular Bollinger Bands and the Relative Strength Indicator (RSI) to provide clear and accurate visual signals. This indicator offers three key aspects: Candle Color: Normal candles are displa
FREE

Этот индикатор основан на концепции "Дивергентных баров" из торговой системы "Торговый Хаос" Билла Вильямса. Он предназначен для автоматического выявления на графике специфических ценовых паттернов, которые могут указывать на потенциальные точки входа или смены тренда. Что такое Дивергентный бар (BDB)? Дивергентный бар - это свеча или бар на графике, который имеет определенные характеристики относительно предыдущего бара и линий индикатора Alligator (Челюсть, Зубы, Губы). В системе Билла Уильямс
FREE
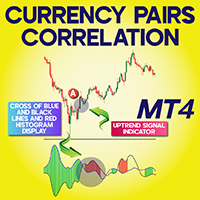
Currency Pairs Correlation Indicator for MetaTrader 4 The Currency Pairs Correlation Indicator for MetaTrader 4 is a specialized tool designed to automatically analyze and display the correlation dynamics between different currency pairs. It visually represents these relationships using a histogram-style oscillator, where green bars indicate a direct (positive) correlation and red bars denote an inverse (negative) correlation. For example, pairs like EURUSD and USDCHF typically show an opposite
FREE

“Gold Miner Robot” is a very powerful AI-Based robot designed and built to accurately analyze the market and trade on gold. Developed by “Keyvan Systems” after more than 3 years of research and development on each tick of the gold chart. "Gold Miner Robot" uses a complex algorithmic approach based on price analysis, trend analysis. We have also provided two other personalized indicators called "GoldMinerRobot SI 1" and "GoldMinerRobot SI 2" for better market analysis, which you can download free
FREE
什麼是 Schaff Trend Cycle? Schaff Trend Cycle(STC)是一種振盪指標,用於及時捕捉市場趨勢的反轉。與傳統指標如移動平均線或MACD相比,STC 結合了循環週期與動能,可更清晰地辨識趨勢的開始與結束。 主要特點 明確的趨勢反轉信號:上升趨勢中週期線上升,下降趨勢中週期線下降。 在震盪行情中降低噪音:基於循環的平滑處理有助於過濾短期波動。 參數靈活可調:可通過調整週期與平滑參數來適配不同交易風格。 計算邏輯概覽 動能計算
根據設定週期內的價格變化,計算短期與長期動能。 循環平滑處理
對動能進行雙重平滑處理,提取循環成分。 標準化
將結果標準化到0至100之間,以振盪圖形式顯示。 信號產生
當指標線突破25或75時,產生買入/賣出信號。 輸入參數 CyclePeriods – 動能計算的週期。預設值:10 FastMA – 短期平滑移動平均。預設值:3 SlowMA – 長期平滑移動平均。預設值:3 OverboughtLevel – 超買區閾值。預設值:75 OversoldLevel – 超賣區閾值。預設值:25 如何安裝此指標 在 MQL
FREE

THE PRICE ACTION INDICATOR! This program finds candlestick absorption patterns and a false breakdown, after which it draws the entry points with arrows.
Input parameters:
1. PPR_Arrow The On parameter/Off display of the absorption model arrows. By default, it is set to true.
2. FB_Arrow Everything is the same as the first parameter, only for false breakdown models. By default, it is set to true.
Sincerely, Novak Production.
FREE

Fibonacci Retracement object is an object that has been provided by metatrader 4 platform. But Fibonacci Retracement object doesn't automated adjust the chart. You have to put and manage it manually to the chart. Because of that, this indicator was created. If you like using filbonacci retracement indicator, highly recommended to use Automated Fibonacci Retracement Indicator if you want to get better result in here:
https://www.mql5.com/en/market/product/95515
LT Automated Fibonacci Retraceme
FREE

How the Indicator Works:
This is a Multi-timeframe MA multimeter indicator which studies if price is above or below a particular EMA range and shows Red/Green/Yellow signals. Red: Price Below EMA range Green: Price above range Yellow: Price within range
Indicator Properties:
EMA Settings: - Default Period is 200. You can change all MA Settings like Period, MA Method (SMA, EMA, etc) or MA Applied Price (Close, Open, etc).
- EMA Range list is a comma separated value list for different timeframes
FREE
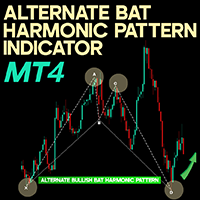
Alternate Bat Harmonic Pattern Indicator MetaTrader 4 The Alternate Bat Harmonic Pattern Indicator is a strategic tool for identifying classic harmonic patterns, specifically developed for use on the MetaTrader 4 platform. Traders who prefer traditional technical analysis can use this indicator to spot the PRZ (Potential Reversal Zone) with greater accuracy. This tool utilizes Fibonacci ratios to plot lines and labels on the chart, making key points of the pattern clearly visible. «Indicator Ins
FREE
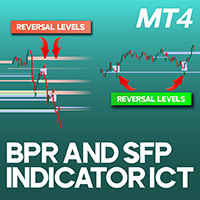
BPR and SFP Indicator for ICT Trading on MT4
The BPR + SFP Indicator integrates two highly effective trading concepts: Breakout and Retest (BPR) and Swing Failure Pattern (SFP) . This combination enables traders to assess market strength and pinpoint optimal entry opportunities with greater accuracy. By analyzing price action and market reactions at significant levels, this indicator helps identify swing failures, breakouts, confirmations, and retracements. It offers clear visual alerts through
FREE
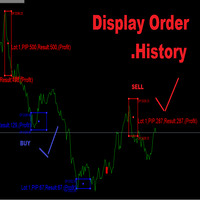
Display Order History Let Try trading.
Button Mark - Red : Order SELL - Blue : Order BUY
Button Lot - Ex. (Lot : 0.01)
Button Profit,Lost - Ex. (Profit:1,Lost:-1) Button PIP - Ex. (PIP:100) Button Open,Close - Ex. Open:3300,Close:3301 VLine M30,H1,H4,D1 IMport CSV Button All Button Summary M30,H1,H4,D1 Profit,Lost Number Order _____________ Start trading Display on chart ____________
FREE
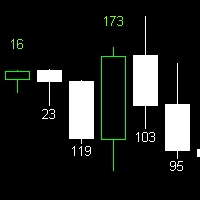
Candle Size Indicator Explore the candle size using this convenient indicator. It works across various timeframes, providing valuable insights for technical analysis. Key Features: Display the size of the candle after configuring the indicator. Compatible with all timeframes. The size of the candle is a significant metric in technical analysis, offering insights into market strength and volatility. This indicator enables clear and accurate visualization of candle sizes on your chart. Utilize thi
FREE

Supreme Direction is an indicator based on market volatility , the indicator draws a a two lined channel with 2 colors above and below price , this indicator does not repaint or back-paint and signal is not delayed. how to use : long above purple line , short below golden line. Parameters : channel period ========================================================
FREE

The three white soldiers and the three black crows candlestick patterns are reversal patterns that predict a change in the direction of a trend. The pattern consists of three consecutive long-bodied candlesticks that open within the previous candle's real body and a close that exceeds the previous candle's. It's important to note that both formations are only valid when they appear after a strong uptrend or a downtrend, while their efficiency decreases in choppy markets.
Inputs AlertOn - en
FREE
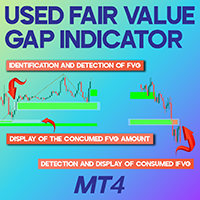
Used FVG (Used FVG-iFVG) indicator
is a valuable tool designed for ICT and Smart Money traders, aiding them in detecting price imbalances and Fair Value Gaps (FVG) on the MetaTrader 4 (MT4) platform. This indicator highlights bullish FVG zones in green and bearish FVG areas in brown, allowing traders to pinpoint crucial market levels. As these zones are gradually filled, the rectangular markers shrink and eventually vanish from the chart, providing a clear representation of market shifts and
FREE
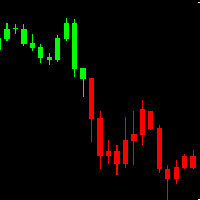
AH Candles MT4 AH Candles MT4 is a new product that allows identifying the current market phase (uptrend and downtrend ).
This indicator paints bars in different colors depending on the current state of the market trend ( Green and Red )
AH Candles MT4 is use for trading currencies
Advantages Suitable for intraday and swing trading. The indicator base on EMA method to calculate Period Parameters It can be used as a standalone tool or together with other indicators.
How to use the prod
FREE

The Cossover MA Histogram indicator is a simple tool showing the trend based on crossover of moving averages. Simply specify two mobving averages and addicional parameters like MA method and Applied price. When fast MA is above slow MA the histogram is green, indicating an uptrend. When MA fast is below MA slow the histogram is red, indicating an downtrend.
FREE
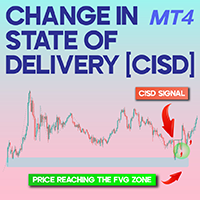
Change in State of Delivery CISD MT4
The Change in State of Delivery (CISD) Indicator is one of the ICT trading tools designed for MetaTrader 4 (MT4) . It assists traders in detecting CISD-level breaks and evaluating trading opportunities based on the signals it provides. «Indicator Installation & User Guide»
MT4 Indicator Installation | Change in State of Delivery CISD MT5 | ALL Products By TradingFinderLab | Best MT4 Indicator: Refined Order Block Indicator for MT4 | Best MT4 Utili
FREE
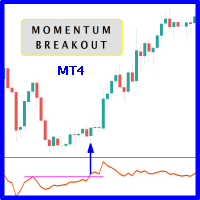
When prices breakout resistance levels are combined with momentum oscillator breaks out its historical resistance levels then probability emerges to record farther prices. It's strongly encouraged to confirm price breakout with oscillator breakout since they have comparable effects to price breaking support and resistance levels; surely, short trades will have the same perception. Concept is based on find swing levels which based on number of bars by each side to confirm peak or trough and in tu
FREE

Th3Eng Panda trend is a powerful indicator that works perfectly for scalping trades as well as swing trades. Th3Eng Panda trend is not just an indicator, but a very good trend filter. You can setup it on H4/H1 to Find the main trend and start scalping on M5/m15/m30 Time Frames. Works with all pairs and all Time Frames.
Inputs:
Section #1 History : Maximum number or bars to draw the last signals. (Default 5000) Draw Candles : Draw red candle when sell signal and green when buy signal. (true
FREE
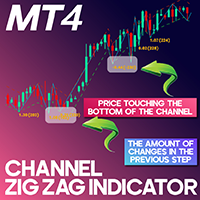
Channel Zigzag Indicator for MT4
The Channel Zigzag Indicator is a modern upgrade of the classic Zigzag line tool designed for the MetaTrader 4 platform. While maintaining the dynamic line feature of the original, this enhanced version excels at filtering out market noise, delivering a clearer representation of price movement. In addition to its core capabilities, the Channel Zigzag Indicator introduces dynamic channels that outline support and resistance zones. It also captures numerical valu
FREE
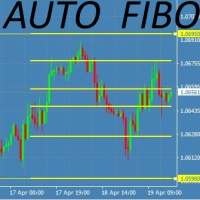
This Fibonacci Indicator is showing fibo retracement lines on chart for EA trading same as the default tool from Metatrader's menu, except this one is fully automatic and changes along with the chart (with modes B and C, then mode A is always fixed by set levels)
AND it also offers the line levels for the Expert Advisors to read (buffers) , so you can set your trades based on crossover\crossunder on those fibo lines.
You can choose from 3 modes for selecting the max HIGH and min LOW limit,
and
FREE

This indicator scans the Moving Average values for 2 Moving Averages on multiple pairs and multiple timeframes in realtime and displays a Buy signal when the fast MA is above the slow MA and a Sell signal when the fast MA is below the slow MA.
-All the MA parameters(Period, Method and Applied price) can be changed from the inputs window.
-You can either add your own list of pairs to scan or set the scanner to automatically use the pairs in the market watch using the Symbols Source input.
-T
FREE

Supreme Stoploss is an indicator for metatrader 4 that is based on the ATR indicator , it gives stoploss/takeprofit as lines drawn above and below the price , this indicator does not repaint/back paint and is not delayed. can be used to determine the stop loss or take profit of a trade using ATR value multiplied by the number set by user. ====================================================================================================== Parameters : ATR SL period : ATR period identity : leave
FREE

Индикатор для синхронизации и позиционировании графиков на одном и более терминалах одновременно. Выполняет ряд часто необходимых при анализе графиков функций: 1. Синхронизация графиков локально - в пределах одного терминала при прокрутке, изменении масштаба, переключении периодов графиков, все графики делают это одновременно. 2. Синхронизация графиков глобально - тоже самое, но на двух и более терминалах, как МТ4, так и МТ5. 3. Позиционирование графика на заданном месте при переключении периодо
FREE

Fibonacci retracement is really one of the most reliable technical analysis tools used by traders. The main problem with using these levels in trading is that you need to wait until the end of the impulse movement to calculate the retracement levels, making difficult to take a position for limited retracement (0.236 or 0.382). Fibo Dynamic solves this problem. Once the impulse movement is identified the retracement levels are automatically updated allowing very dynamic trading in trends with onl
FREE
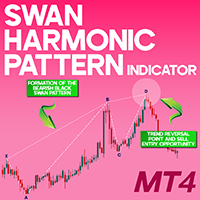
Swan Harmonic Pattern Indicator MT4 Download the Swan Harmonic Pattern Indicator, a harmonic pattern tool for MT4 designed to detect potential price reversal points and forecast future market movements. One of the standout features of this indicator is its ability to display two distinct variations: the Black Swan and White Swan patterns, applicable in both bullish and bearish market conditions. «Indicator Installation & User Guide»
MT4 Indicator Installation | Swan Harmonic Pattern Indicator
FREE

The indicator is specially designed for the trading utility Trade Shell (included Trade Shell SMC ) to get it working on visual strategy tester.
Backtest your trading ideas and indicators. Run Trade Shell on visual tester and then put this indicator on the chart. After that you will be able to control all functions of the Trade Shell as well as with live using! It does not work live! Use it with visual tester only. It does not require to set any setting on input parameters.
Have a good luck
FREE

Indicator to be placed in the same folder as Dash to activate the alert filter with Heiken Aish. After downloading the indicator, copy it to the same folder so Dash can read the indicator. It is not necessary to insert it into the chart, this is only for Dash to search for signals and inform the direction of buying and selling of the Indicator. Check if the indicator's path is correct within Dash.
FREE

For traders, monitoring price movements is a constant activity, because each price movement determines the action that must be taken next. This simple indicator will helps traders to display prices more clearly in a larger size. Users can set the font size and choose the color that will be displayed on the chart. There are three color options that can be selected to be displayed on the chart.
FREE

Market Insider is an excellent indicator for scalping the trend and also trading market breakouts and reversals. It is based on a ATR measured volatility channel and the CCI indicator. The green trend line and green bars indicates an uptrend and the red trend line and red bars indicates a downtrend. An intensive price breakout of some of the trend lines indicates a market breakout and a potential new opposite trend. In choppy-range behaving market and in low liquidity conditions the breakout sig
FREE
Highly configurable Relative Vigor Index (RVI) indicator.
Features: Highly customizable alert functions (at levels, crosses, direction changes via email, push, sound, popup) Multi timeframe ability Color customization (at levels, crosses, direction changes) Linear interpolation and histogram mode options Works on strategy tester in multi timeframe mode (at weekend without ticks also) Adjustable Levels Parameters:
RVI Timeframe: You can set the lower/higher timeframes for RVI. RVI Bar Shift: yo
FREE
MetaTrader市场提供了一个方便,安全的购买MetaTrader平台应用程序的场所。直接从您的程序端免费下载EA交易和指标的试用版在测试策略中进行测试。
在不同模式下测试应用程序来监视性能和为您想要使用MQL5.community支付系统的产品进行付款。
您错过了交易机会:
- 免费交易应用程序
- 8,000+信号可供复制
- 探索金融市场的经济新闻
注册
登录