 MetaTrader 5
 专家
专家
 指标
指标
 程序库
程序库
 实用工具
实用工具
 窗口小部件
窗口小部件
 规则
规则
适用于MetaTrader 4的免费技术指标 - 32
 下面列出的技术指标信号对MetaTrader 4平台的开仓交易和平仓交易起着至关重要的作用。
指标的本质就是一种交易品种的数学转换,旨在预测价格变化。
下面列出的技术指标信号对MetaTrader 4平台的开仓交易和平仓交易起着至关重要的作用。
指标的本质就是一种交易品种的数学转换,旨在预测价格变化。 
趨勢指標 用於確定每個時間範圍趨勢的獨特系統,
讓您能夠真實了解任何貨幣對在所有標準時間範圍內的趨勢! 綠色方塊是買入趨勢,紅色方塊是賣出趨勢。
交易技巧:如果小時間框架與較舊時間框架的趨勢相反,則由於市場運動的慣性,請按照螢幕截圖所示在較舊時間框架內入場。
此指標使用修改後的燭台公式來創建更平滑的價格走勢表示。 它平均當前和前期的開盤價、收盤價、最高價和最低價。 這種轉換可以減少噪音並提供更清晰的趨勢視圖。
它是一個強大的指標,結合了求和指數廣度分析、清晰的可視化以及基於 MACD 計算和直方圖的附加趨勢資訊。 客製化功能使其能夠適應不同的指數和市場條件,為交易者提供分析趨勢和動量的綜合工具。 要確認買入和賣出訊號,您可以尋找支撐位和阻力位,如下圖所示。 如果買進訊號出現在支撐位,則該訊號比出現在隨機價格水準的訊號更強。 同樣,如果賣出訊號出現在阻力位,則該訊號比出現在隨機價格位的訊號更強。
FREE

动信道。 通道宽度会根据价格变动自动变化。 与通道中间的偏差越大,边界变得越宽。 指标调整到您设置的图表部分的运动( " Bars for calculations " 参数). 因此,如果价格在给定的时间间隔内出现大幅波动,该通道将扩大,预计会出现进一步的强烈波动。 也就是说,它的参数将始终对应于当前的市场情况。
该频道不打算用于历史数据分析! 要检查其可操作性,请在测试仪中运行它!
通道既变宽又变窄,这取决于以前的动作。 这些移动取决于"周期"参数。 如果您设置"Bars for calculations"=200,那么通道将调整到最后200个柱的运动。 通道的上下边界将接近或移开,这取决于"周期"先前移动的最大偏差。 因此,价格越早偏离中线,通道就越宽,随着运动的平静,通道就会变窄。 与此同时,通道的本质保持不变-边界平均偏离均值线(TSF),但平均速度取决于价格变化率。 价格越快接近通道边界,它的扩展就越快。
您可以将其用作常规通道,无需自动扩展。 为此,请将"速度"参数设置为"固定"位置,并使用"宽度通道"参数手动设置通道宽度。
该指标基于一种方法,该方法在
FREE
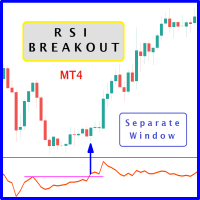
The likelihood of farther price movement increases when the Relative Strength Index oscillator "RSI" breaks through its historical resistance levels in conjunction with prices breakout of resistance levels. It's strongly encouraged to confirm price breakout with oscillator breakout since they have comparable effects to price breaking support and resistance levels; similar perception is applied to short trades. Concept is based on find swing levels which based on number of bars by each side to co
FREE

Squeeze and Momentum Indicator Indicator — Version 1.0
The Squeeze and Momentum Indicator is designed to highlight periods of low volatility followed by potential expansions in market activity. It combines Bollinger Bands and Keltner Channels to identify “squeeze” conditions and uses a momentum histogram to estimate the likely direction of the move once volatility expands.
How it works: A squeeze occurs when the Bollinger Bands contract inside the Keltner Channels. This condition is marked wit
FREE
Concept
Market arranges in Time upcoming Phases according to the present Results of its Interest. Directing Modulations are an Interaction of immanent Periods, which show in Reference to Time cyclic Activity and to Price leveling Activity. SensorMap is a reflecting Volume Mask of this Concept of Time and Price and apportioning developed Price Movements in an equalized 100 % - Range: how far moved ? indicating their Status by marking special Events: when which Action ? setting the Situation in a
FREE

ATR Accelerator Indicator informs you about strong price movements based on the ATR Indicator. This Indicator works for all Timeframes and Symbols, the strength of movements can be configured.
Important: Get informed about new Products, join our MQL Channel: https://www.mql5.com/en/channels/etradro
Useage This Indicator works for all Timeframes and Symbols, the strength of movements can be configured. Features works on all timeframes and forex pairs or indices. Alert and Notify function i
FREE
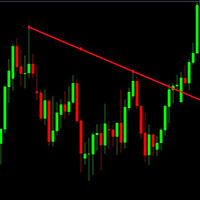
This is just a simple indicator that show Alert when the Current candle Close Above the Trendline. Previous candle do not affect the Alert. The indicator is tied to the Trendline so if the Trendline is accidentally deleted, the Alert will not work. The indicator will draw another Trendline if the current Trendline is deleted. Removing the indicator will removed the Trendline. There are 4 type of Alert to set: Popup Alert, Signal Alert, Push Notification, Comment.
FREE
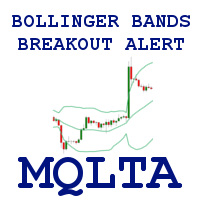
Bollinger Bands Breakout Alert is a simple indicator that can notify you when the price breaks out of the Bollinger Bands. You just need to set the parameters of the Bollinger Bands and how you want to be notified.
Parameters: Indicator Name - is used for reference to know where the notifications are from Bands Period - is the period to use to calculate the Bollinger Bands Bands Shift - is the shift to use to calculate the Bollinger Bands Bands Deviation - is the deviation to use to calculate t
FREE

Grid MATR is designed to map price against dynamically measured or fixed ranges so traders can better visualize volatility, market extension, and session-based price behavior—while requiring independent analysis for direction and trade decisions. The motive is to turn market volatility and selected time/session reference points into a visual price grid. Instead of claiming to predict price direction, it gives the trader a structured way to judge where current price sits relative to ATR-deriv
FREE
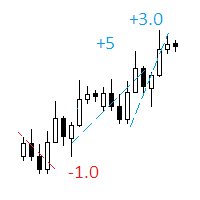
The indicator displays on a chart trading results. You can configure the color and font of displayed results, as well as filter trades based on the magic number. If multiple trades were closed within one bar of the current timeframe, the result is summed and output in one value.
Utility parameters Plot profit in - the format of output results: wither in deposit currency taking onto account commission and swap, or in points. Start from - start processing data at the specified time. Plot last dea
FREE
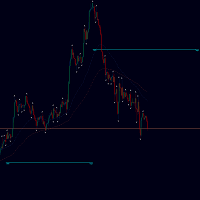
Targets is an indicator to determine potential turning points , targets are calculated to determine levels in which the sentiment of the market could change from "bullish" to "bearish." This indicator can be used in any timeframe and any currency pair: IN CASE YOU DON'T SEE THE INDICATOR WHEN YOU ADD IT TO YOUR CHARTS JUST OPEN THE INDICATOR MENU AND CLOSE THE MENU AGAIN PLEASE TAKE NOTICE: For best results use this indicator as an extra tools after you have completed your regular analysis an
FREE

Symbol Changer (Custom) Indicator
This is a simple yet intuitive indicator. And its free.
The indicator provide easy navigation across various symbols and across different time frames all in a chart.
The buttons are displayed on the main chart.
It is flexible and easy to use with fast response speed.
FEATURES
UniqueID : This identifies the pairs for each chart
Use Custom Pairs : If set to true, load all the available symbols in the Market Watch. No means it loads the pairs selected be
FREE

NZD INDEX
The Currency Index Project is ONE part of a thorough Forex study. Many people do not know the theoretical basis that drives currency exchange rates to move on the market. With this set of tools you will be able to have a more complete view of the entire market by analyzing not only the single currency of an exchange, but all the exchange rates that make up that currency by looking at a single window!
The indicator faithfully represents the real index of a single currency present in a
FREE

DeMarker指标,支持多时间框架,可自定义视觉信号及可配置警报系统。
自由职业编程服务、更新和其他TrueTL产品可在我的 MQL5主页 获取。
非常欢迎您的反馈和评价!
什么是DeMarker? DeMarker指标由汤姆·德马克(Tom DeMark)开发,将当前K线内的高低点与前一根K线的范围进行比较。在0到1之间波动,高于0.7视为超买,低于0.3视为超卖。与其他振荡器不同,它专注于方向性极端运动和K线内的疲竭,而非测量收盘价的动能。 DeMarker信号在指标穿越极值区域(0.7和0.3)时,或在指标与价格出现背离时生成。在识别真正的疲竭点方面,其被认为比简单随机指标更加可靠。 功能特点: 带箭头和垂直线的视觉信号标记 三个具有可配置触发器的独立信号缓冲区 信号检测选项:方向变化、穿越水平线、峰值/谷值 每个信号的可配置警报功能(邮件、推送、声音、弹窗) 支持插值方法的多时间框架(MTF)功能 柱状图或折线图绘制模式 多种颜色模式(简单、基于方向、基于水平) 通过自定义指标调用(iCustom)访问缓冲区,支持Expert Advisor(EA)集成 输入参数: 基
FREE
What is a tool ? This indicator use for forecast direction of the 28 pairs, Calculates from multiple pairs and timeframes and present by percentage as 70-79% , 80-89% , 90-100% is a little, medium and strong trend. How to use Place the indicator on any pair and any timeframe. Pair : Any Timeframe : Any Input Parameter No Visit my products Target Profit Magic Target Profit All The Profit Tracker Currency Scoring Pair Direction
FREE

我們的指標專為重視市場分析的準確性、可靠性和多功能性的交易者而設計。它將簡潔的介面與先進的訊號產生邏輯相結合,使其成為新手和經驗豐富的市場參與者不可或缺的工具。
I. ️ 主要優勢:絕對的訊號可靠性
該指標的主要價值在於其演算法的完整性,它消除了許多工具的主要問題——重繪。
無重繪:此指標保證,當出現新資料或時間週期變更時,過去的訊號不會被刪除、變更或重繪。
即時固定:所有交易訊號(買入/賣出)均在當前K線收盤時產生並永久固定。在實際交易中,這確保了訊號絕對不會改變。
單次啟動:每個交易訊號僅觸發一次。您將收到清晰且不重複的操作指令。
II. 應用的通用性和靈活性
該指標旨在為各種交易風格和市場提供通用解決方案。
完全資產相容性:適用於所有類型的市場和金融工具:
貨幣對(外匯)。
指數和股票。
加密貨幣。
金屬和大宗商品。
多時間框架支援:適用於任何時間框架(從超短線交易到長期投資),讓您能夠快速適應您選擇的交易策略。
多種策略:可用於實施各種交易方法:
趨勢跟踪。
波段交易(尋找中期回檔)。
確認市場反轉。
III. 交易者主要功
FREE


Профессиональный индикатор перекупленности и перепроданности, построенный на основе CCI с EMA-сглаживанием . Индикатор помогает находить потенциальные точки разворота рынка и фильтровать шум стандартного CCI. Индикатор работает в отдельном окне и подходит для любых торговых инструментов и таймфреймов. Основные возможности Сглаженная линия CCI (EMA smoothing) Чёткие уровни перекупленности и перепроданности Стрелочные сигналы BUY / SELL Алгоритм без перерисовки Минимальная нагрузка на терминал
FREE

FusionAlert StochRSI Master is an indicator available for MT4/MT5 platforms, it is a combination of RSI & Stochastic indicator which provide "alerts" when the market is inside "overbought and oversold" regions combined for both indicators, results in more precise and accurate signals to be used as a wonderful tool, in the form of "buy or sell" signals. This indicator comes with many customization options mentioned in the parameter section below, user can customise these parameters as needful. Jo
FREE
Binary Options Assistant (BOA) FLAME Signals Indicator provides signals based on the combination of: RSI, MACD & Stochastic Indicators
Stop missing trades, stop jumping from chart to chart looking for trade set-ups and get all the signals on 1 chart! U se any of the BOA Signals Indicator with the Binary Options Assistant (BOA) Multi Currency Dashboard .
All BOA Signal Indicator settings are adjustable to give you more strategy combinations. The signals can be seen visually and heard audib
FREE

MACD仪表盘面板 该指标可帮助您扫描Market Watch窗口中的交易品种并根据MACD过滤趋势。
移动平均线趋同散度(MACD)是一种趋势跟踪动量指标,它显示了证券价格的两个移动平均线之间的关系。通过从12个周期EMA减去26个周期的指数移动平均线(EMA)来计算MACD。
该计算的结果是MACD行。然后在MACD线上方绘制MACD的为期9天的EMA,称为“信号线”,它可以触发买入和卖出信号。当MACD越过信号线上方时,交易者可以买入该证券;当MACD越过信号线下方时,交易者可以卖出或做空该证券。移动平均趋同散度(MACD)指标可以用几种方法来解释,但更常见的方法是交叉,散度和快速上升/下降。
它显示了单个窗口中每个时间帧的MACD趋势。您也可以通过单击值来打开图表
FREE
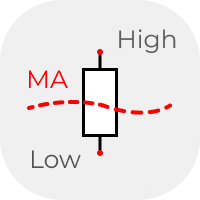
The classic idea of comparing the size of candles. Above / below - the average for a certain period. Usually used on D1, W1 and higher timeframes in candlestick analysis patterns. But you can also use the data from the indicator in your analysis system. The data is presented as a histogram in a separate window. The averaging method can be selected in the settings.
FREE

GMMA indicator that looks like a cloud. The GMMA indicator is easy to read, but to make it even more visually pleasing, we made it look like an Ichimoku Chart cloud. Colors have been changed where short-term and long-term overlap.
My other products https://www.mql5.com/ja/users/studiotam/seller
Please reduce the character limit a bit. I have nothing more to write.
FREE

This indicator helps you to scan symbols which are in the Market Watch window and filter out a trend according to RSI.
The relative strength index (RSI) is a technical indicator used in the analysis of financial markets. It is intended to chart the current and historical strength or weakness of a stock or market based on the closing prices of a recent trading period. The indicator should not be confused with relative strength. The RSI is classified as a momentum oscillator, measuring the veloci
FREE

This indicator filters the Zigzag indicator to calculate the main support and resistance
levels.
Variables
minimum gap between peaks : is the distance (GAP) between the peaks of
the Zigzag
peaks sensitivity : Minimum number of nearby peaks
look back: it means that it has to test the last 50 peaks in the Zigzag
object name perfix: a prefix for level’s line name on chart
FREE
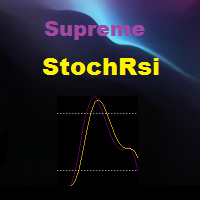
Rsi indicator and Stochastic Combined into one indicator , the Supreme StochRsi doesnt repaint / Back-paint / delay. can be used as overbought oversold strategy , or trend following on 50 level cross. if you like this indicator please check my Supreme Trendhisto: here , and my Supreme Diamond indicator : here ========================================================================= Parameters : Stochastic K and D value , Stochastic period Rsi Period Rsi price ====================================
FREE

RSIBandsTREND is a custom trend-focused indicator that enhances the classic RSI approach by visualizing dynamic upper and lower bands based on RSI calculations.
It plots three clean bands (upper, lower, and midline) directly on the chart, helping traders identify overbought and oversold zones with precision. Features: Three-band system: upper, lower, and center RSI lines EMA-smoothed RSI band calculation Clear trend zone visualization on chart Works on all timeframes (M1 to Monthly) Fully opt
FREE

This indicator uses Moving Average to detect markets trend. It's a very useful tool for manual trading. If line is Midnight Blue, indicator detect up trend. If line is Dark Violet, indicator detect down trend. The readings are very simple to use and understand. Indicator works best on H1 timeframe. You can use this indicator with FollowLine to have more accurate signals.
You can to get source code from here .
Parameters BarsCount —How many bars used to show the line. MAperiods —Period of Movin
FREE

通过 Your Chart 指标提升您的交易体验! 这个免费的高度可定制工具允许交易者将多个时间框架合并为一个干净的蜡烛图显示,而不改变原始图表。使用 Your Chart,您可以设置每根自定义蜡烛的条数——例如,将每 18 根 M1 蜡烛合并为一根,以便更广泛地查看市场趋势。 主要特点: 自定义蜡烛形态 :选择合并多少条蜡烛为一根,提供灵活的市场视图。 非侵入性设计 :原始图表数据保持不变,自定义蜡烛以覆盖形式绘制,显示蜡烛的实体和影线。 颜色自定义 :根据您的喜好个性化看涨和看跌方向的蜡烛颜色。 简化交易 :通过自定义图表视图,交易者可以获得独特的见解和更符合个人需求的价格走势视觉效果。 非常适合那些希望在保持 MetaTrader 4 简单性的同时,获得全新图表视角的交易者。
FREE

综合指数(Composite Index)指标,支持多时间框架,可自定义视觉信号及可配置警报系统。
自由职业编程服务、更新和其他TrueTL产品可在我的 MQL5主页 获取。
非常欢迎您的反馈和评价!
什么是综合指数? 综合指数由康斯坦斯·布朗(Constance Brown)开发,旨在克服 RSI 在趋势市场中的失败摆动问题。它将 RSI 动量(慢速 RSI 与快速 RSI 之差)与平滑的快速 RSI 组件相结合。在结果上绘制的两条信号 SMA 有助于识别基于交叉的进场和出场点。 综合指数旨在显示标准 RSI 在强趋势期间无法揭示的动量背离。当价格创出新高而综合指数未能同步时,形成看跌背离,反之亦然。指标上的 SMA 交叉提供额外的进场信号。 功能特点: 在主 CI 线上绘制的两条信号 SMA 线(SMA2 和 SMA3) 带箭头和垂直线的视觉信号标记 三个具有可配置触发器的独立信号缓冲区 信号检测选项:方向变化、穿越水平线、峰值/谷值 每个信号的可配置警报功能(邮件、推送、声音、弹窗) 支持插值方法的多时间框架(MTF)功能 柱状图或折线图绘制模式 多种颜色模式(简单、基于方
FREE

BillWill 该指标基于取自书中的材料:Bill Williams。交易混乱。最大化利润的专家技术。 每个柱形顶部的指标读数是根据开盘价和收盘价相对于柱形三分之一处的位置计算的。小节分为三个部分,小节的下三分之一是三号 (3),小节的中间三分之一是二号 (2),小节的上三分之一是一号 (1)。指标读数中的第一个数字是开盘价相对于柱的三分之一的位置,第二个数字是收盘价相对于柱的三分之一的位置。 每个柱形底部的指标读数计算为柱形中间相对于前一个柱形极值的位置。
指标读数定义 1-1 开盘价和收盘价位于柱线的上三分之一 2-2 开盘价和收盘价位于柱线的中间三分之一 3-3 开盘价和收盘价位于柱线的下三分之一 3-1 开盘价在柱的下三分之一处,收盘价在柱的上三分之一处 2-1 开盘价在柱的中间三分之一,收盘价在柱的上三分之一 3-2 开盘价在柱线的下三分之一处,收盘价在柱线的中间三分之一处 1-3 开盘价在柱的上三分之一,收盘价在柱的下三分之一 2-3 开盘价在柱的中间三分之一,收盘价在柱的下三分之一 1-2 开盘价在柱的上三分之一,收盘价在柱的中间三分之一 “+”(加号)标记中间高
FREE

VArmadA的平衡输入
一个简单而强大的基于分形的支撑/阻力指标。
适用于1h及以上时间段,并对所有主要货币对进行测试。请注意信号。箭头表示多头或空头进入。
它是如何工作的。
箭头表示反向支撑/阻力。向上的箭头表示做多-向下的箭头表示做空交易。
操作说明:指标多头/指标空头
- 指标多头/指标空头:选择给定指标箭头的颜色。
- 显示阻力位。可视化用于确定进入信号的阻力位。
- 显示支撑位。可视化用于确定进入信号的支撑位。
..................................................................................................
FREE
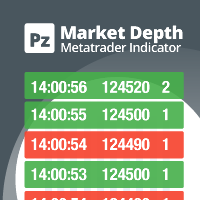
Do you like scalping? Th is indicator displays information about the latest price quotes received from the broker. [ Installation Guide | Update Guide | Troubleshooting | FAQ | All Products | Get Help ] Identify tick trends easily A blue row means the price has increased A red row means the price has decreased Customizable colors and font sizes Display your desired amount of rows The indicator is non-repainting
Parameters Rows: amount of rows with data to display in the chart Font size: fo
FREE
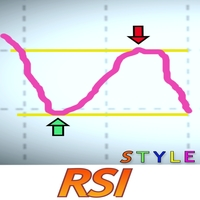
因为风格很重要
我知道每次都要点击属性来改变蜡烛的颜色、背景是浅色还是深色,以及放置或删除网格是多么令人厌烦。这里有一个一键式的解决方案。 三个可定制的按钮可以选择交易者想要的蜡烛样式。 一个按钮可以在白天和夜晚模式之间切换。 一个按钮可以在图表上显示或隐藏网格。 ***** 在设置中,你可以选择按钮在屏幕上的显示位置*****。
请考虑查看我的其他产品 https://www.mql5.com/en/users/javimorales.fer/seller
检查MT5版本: https://www.mql5.com/en/market/product/69070
什么是RSI指标?
RSI显示为一个震荡器,可以从0到100进行测量。该指标由J.Welles Wilder Jr.开发,并发表在他1978年的开创性著作《技术交易系统的新概念》中。它被认为是低于20的超卖和高于80的超买。RSI提供信号,告诉交易者在货币/股票/工具超卖时买入,超买时卖出。
如有任何问题,请随时与我联系。
作者简介
Javier Morales,交易算法的创始人。
FREE

My notes is a simple indicator that will help you put any notes on your price chart. W ith one click you get as many notes as you choose from the menu. All blanks for your entries are lined up in one column. You only need to move the records to the right place on the graph and click on the record. The menu consists of four items: My_sum_Note number of entries , default 5 ; MyMessage Font font name, default "Arial"; MyMessage FontSize font size, default 10; MyMessageColor is the font color, Black
FREE

“Circle Rising Point” 是一款基于 周期论 的指标,不论您的交易周期是短周期还是长周期,您都可以通过这款指标 寻找不同周期,不同波段的起涨点和起跌点 ,因此在不同周期图表上,展现给您的信号都是不同的,适用于 左侧交易 。 这款指标建议搭配多周期窗口配合使用分析。 指标介绍 适用产品 这款指标适用于任何交易品种, 外汇、加密货币、贵金属、股票、指数。 适用周期 Circle Rising Point 指标适用于所有时间帧 - 从分钟 (M1) 到日线 (D1)。 适用人群 有一定基础的交易者和专家级交易者。
最大盈利潜力
Circle Rising Point指标的入场信号通常出现在不同波段下跌趋势快结束的时候,即使在入场信号出现后继续下跌,也不会有很大的跌幅, 从而最大限度地降低风险,并增加盈利。 多语言支持 指标面板将自动以您的语言显示。 视觉和声音警报 您不会错过信号,因为每个信号都显示在屏幕上,并带有声音通知。 操作便利 您只需要在设置面板根据您的喜欢设置交易信号的颜色即可。
如何使用Circle Rising Point指标进行交易?
订阅并在您
FREE

️ Important Note This indicator "Telegram Notify Activator" un l ocks the full functionality of "Telegram Notify EA" . Try out " Telegram Notify EA" b efore making purchase (comp l ete details are given beow)
Telegram Notify EA – Never Miss MT4 Alerts Forward MT4 popup alerts and trade events with chart screenshots to Telegram instantly — works with any EA, indicator, or script. Reduce screen time and stay connected with real-time notifications.
Universal Alert Captu
FREE

The Sessions Partition Indicator draws clear, accurate session separators for the Sydney, Tokyo, London, and New York trading sessions.
It automatically adapts to your broker’s server time and allows full GMT customization. Designed especially for IC Markets (Winter – GMT+2) , this indicator gives traders a clean visual structure of the market’s intraday phases – making session-based strategies MUCH easier to follow. Key Features 4 Major Forex Sessions Marked Sydney Session Tokyo Session Lon
FREE

Expanded Cloud is a trend-following overlay indicator that uses an adaptive expansion algorithm to identify market direction with clarity. Dynamic cloud zones expand and contract around price action based on real-time volatility, giving you a visual edge in reading trend strength and catching reversals early. The indicator includes a built-in information dashboard with two tabs — Signal and Cloud — displaying real-time data about current market conditions directly on your chart. How It Works
FREE
I create this this Free Indicator to help you to plot your BUY / SELL Average and BEP level in your chart. Just drag to your chart, and you can see the level and plan better to your trade. It's usefull if you have averaging position or even hedging position, so you can plan your trade better and no need to calculate manually again. Use it for free, and please leave comment if you feel this usefull.
FREE
Forex trading support timer: - This is an indicator that supports a trader's trading process. - Before placing a BUY or SELL order, it is advisable to observe what the current time is like, to get the best position when trading. Function of indicator: - Display information about candle closing time of different timeframes (M1,M5,M15,H1), best used when Scalping. - Show market spreads. - Show TimeZone Trading. - Displays the remaining time of a session.
FREE

White Crow Indicator
by VArmadA A simple yet powerful candle analysis based indicator using the White Soldiers & Crow patterns.
Works with timeframes 1H and higher and tested on all major pairs. Pay attention to the signal: An arrow indicating a long or short entry.
How It Works:
Arrows indicate a ongoing trend. After multiple bullish or bearish candles in a row the chances for another candle towards that trend is higher.
Instructions: - Crow Count: Set the number of candles that need to s
FREE
As we know, МТ4 and МТ5 do not store tick history, which may be necessary to develop trading strategies and market analysis. I have developed a method allowing you to receive tick history very easily. The indicator gathers tick history in real time and writes it to XXXXXX2.hst file, where XXXXXX is a symbol name. This file can be used to create an offline chart or something else. If you use a trading robot, then launch the indicator and control your broker by examining the spread and quotes. All
FREE

The purpose of this new version of the MT4 standard indicator provided in your platform is to display in a sub-window multiple timeframes of the same indicator. See the example shown in the picture below. But the display isn’t like a simple MTF indicator. This is the real display of the indicator on its timeframe. Here's the options available in the FFx indicator: Select the timeframes to be displayed (M1 to Monthly) Define the width (number of bars) for each timeframe box Alert pop up/sound/ema
FREE

量子擺動 1.什麼是量子擺動? 該指標基於量子數學,以高概率和方向精度顯示未來價格水平。級別顯示為進行交易決策的區域;它們明確定義了具有最小和最大利潤的訂單的窄範圍。該指標顯示不同時期的未來交易區H1,H4,D,W。它還顯示量子振盪而不參考時間。適用於所有交易工具。外匯市場,股票市場,期貨市場和商品市場將改變為MT4交易平台上使用的所有工具。 2.量子擺動的優點和不同之處: 在線汽車打造優質交易平台。 交易決策區域的構建和顯示的準確性。 以未來時態展示貿易區,帶領您領先一步。 易於使用和應用。 聊天電報中頻道的在線支持 https://t.me/nest8 每日評論和直播YouTube頻道 https://www.youtube.com/watch?v=kzapOX0cGfc&feature=youtu.be 2.交易策略。 指標描述,交易策略,調整和交易計劃將在YouTube頻道上詳細顯示,並在聊天電報中進行討論。
FREE

+ 2 bonus strategies! Alerts! I recommend watching my advisor - Night Zen EA The indicator combines the most popular moving average strategies: Simple moving average crossover. Moving average crossover relative to the position of the slower moving average. 2 bonus strategies : The crossing of the fast moving average with the calculation of the opening prices of the slow moving average with the calculation of the closing prices taking into account the slower moving average. (The settings for th
FREE
This indicator determine price volatility using correlation between Price and Time. WARNING: Not suitable for 1M timeframe, you would not see any lines in this frame!
How to Use:
More closer the indicator's value to 0, the price is considered more volatile. When reversal is started, the indicator's value would be rise or fall significantly. During a strong trend, the indicator's value would be closer to 1 or -1, depends on current trend. Entry Signal:
BUY SIGNAL: Indicator crosses 0.2 from bel
FREE

PREVIOUS INDICATOR’S DATA MA CROSSOVER https://www.mql5.com/en/users/earobotkk/seller#products P/S: If you like this indicator, please rate it with 5 stars in the review section, this will increase its popularity so that other users will be benefited from using it.
This indicator notifies and draws an arrow on the chart whenever the MA line has crossed over its previous indicator’s data MA filtered by MA Trend. It also displays total pips gained from all the entry set-ups. Setting · You c
FREE

Investment Castle Engulfing — Never Miss an Engulfing Candle
Whether you scalp or trade the daily, bullish and bearish engulfing candles are some of the most reliable signals — but spotting them across timeframes is tedious and easy to miss. This indicator finds them for you, including an engulfing candle forming on a higher timeframe while you trade a lower one.
What it does for you Automatic engulfing detection: bullish and bearish engulfing candles are flagged for you. Multi-timeframe aware
FREE

This Dashboard is free to download but is dependent on you owning the Flag Trend Pro MT4 indicator. Down load the indicator: Flag Trend Pro
The Dashboard will show you on a single chart all the timeframes (M1 to Monthly) with their own status for the indicator: Gold Pro MT4
all time frame and all symbol: smart algorithm detects the trend, filters out market noise and gives entry signals!!!
How to understand the status: symbol - Fill All the Pair what you want. M1, M5, M15,M3
FREE
Binary Options Assistant (BOA) BURN Signals Indicator provides signals based on Ana Trader Binary Options Strategy. Indicators: MACD & Stochastic
Stop missing trades, stop jumping from chart to chart looking for trade set-ups and get all the signals on 1 chart! U se any of the BOA Signals Indicator with the Binary Options Assistant (BOA) Multi Currency Dashboard .
All BOA Signal Indicator settings are adjustable to give you more strategy combinations. The signals can be seen visually and
FREE
具有双线信号、零水平系统、多时间框架支持、可自定义视觉信号和高度可配置警报系统的高级相对活力指数(RVI)指标。
自由编程服务、更新和其他 TrueTL 产品可在我的 MQL5 资料页 上获取。
非常感谢您的反馈和评价!
什么是相对活力指数(RVI)? 相对活力指数(RVI)是由 John Ehlers 开发的动量振荡器,通过将收盘价与开盘价进行比较(以交易区间为标准化基准),来衡量近期价格走势的可信度。其基本原理是:在牛市中,收盘价往往高于开盘价;而在熊市中则相反。 RVI 在零线附近振荡——正值表示看涨动量,负值表示看跌动量。该指标由两条线组成:主线(RVI 值)和信号线(主线的 4 根K线对称加权移动平均线)。两条线之间的交叉通常被用作进场和出场信号。 功能: 具有零水平参考系统的双线 RVI(主线和信号线) 具有三个独立可配置信号缓冲区的视觉信号标记(箭头、垂直线) 高级信号检测:方向变化、线交叉、级别交叉、两条线的峰值/谷值 可配置的警报功能(电子邮件、推送、声音、弹出窗口),带有时间范围过滤 带插值的多时间框架(MTF)、多种颜色模式以及用于 EA 集成的 iCust
FREE

Trading is about waiting for the right time. This indicator was created to know what is happening on our charts without having to cover the screen with indicators. In addition, it has several types of alerts that allow us to dedicate our time to other things until something interesting happens. You can use multiple alarms at the same time. It is not a problem.
By default AlterAlert offers us alerts when the following indicators give us a signal:
Moving average (MA crosses) Stochastic Oscillat
FREE

The indicator displays the size of the spread for the current instrument on the chart. Very flexible in settings. It is possible to set the maximum value of the spread, upon exceeding which, the color of the spread label will change, and a signal will sound (if enabled in the settings). The indicator will be very convenient for people who trade on the news. You will never enter a trade with a large spread, as the indicator will notify you of this both visually and soundly. Input parameters: Aler
FREE
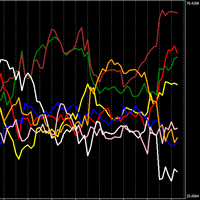
顯示單一貨幣強度的強大指標。
越高,貨幣越強,反之,越低,貨幣越弱。
交易策略N1:線上交叉建倉,如果一個向上交叉,另一個向下交叉,則在正在上漲的貨幣上建倉。
交易策略N2:透過買入最強貨幣並賣出最弱貨幣來建倉。
在設定中,您可以變更時間範圍,我使用預設的時間範圍(時間範圍 1 小時)和週期 24。我還使用時間範圍 1 分鐘和週期 1440。
显示单个货币强度的强大指标。 越高,货币越强,反之,越低,货币越弱。 交易策略N1:在线交叉建仓,如果一个向上交叉,另一个向下交叉,则在正在上涨的货币上建仓。 交易策略N2:通过买入最强货币并卖出最弱货币来建仓。 在设置中,您可以更改时间范围,我使用默认的时间范围(时间范围 1 小时)和周期 24。我还使用时间范围 1 分钟和周期 1440。
FREE

RedeeCash 三角套利機會將可用的貨幣三元組和每個貨幣交易頭寸設置顯示為全局變量,格式為
AAA/BBB、CCC/AAA、CCC/BBB:AAA/BBB -1|0|1
AAA/BBB、CCC/AAA、CCC/BBB:CCC/AAA -1|0|1
AAA/BBB、CCC/AAA、CCC/BBB:CCC/BBB -1|0|1
其中值是 OP_BUY 或 OP_SELL 的交易方向。 如果交易方向指示 -1,則該貨幣對不應發生交易。
三角套利交易對於不再允許對沖的美國賬戶很有用。 實際上有更多的套利機會,該指標以交易設置的形式顯示所有這些機會。 您只需要讀取全局變量並決定交易哪個機會?
當您開倉時,您應該使用至少 200 PIPS 的止盈,否則交易可能會在沒有止盈值的情況下開倉。
FREE

经过7年的发展,我决定免费分享我的一些指标和专家顾问(EA)。
如果您觉得它们有用,请给予 五星评价支持!您的反馈将激励我继续提供免费工具。 查看我的其他免费工具 这里
_________________________________ 带有上下边界的ATR指标,用于提升外汇市场波动性分析 介绍MQL5开发的带有上下边界的ATR指标,旨在将您的外汇市场分析提升到新的水平。这一创新工具将平均真实范围(ATR)与可定制的上下边界相结合,提供对市场波动性的细致理解。 主要特点: 波动性测量: 利用ATR准确衡量市场波动性,为市场状况提供关键见解。 可定制边界: 通过调整上下边界来直观显示波动性极值和市场趋势。 突破和整固检测: 帮助识别潜在的突破或整固,促进战略性交易决策。 加强市场分析️: 通过研究波动性与市场趋势的关系,提供全面的分析工具。 使用及信号解读: 轻松集成️: 将带有上下边界的ATR指标无缝集成到您的Metatrader 5平台中。根据您的交易偏好自定义边界。 波动性趋势监控: 持续监控指标,以评估市场波动性及其对价格动向的潜
FREE

GM Reverse Indicator works on Fibonacci along with some other tweaks
-> It is programmed to automate 100% when the market fluctuates This indicator I use to find support points. It really works and I want to share it with you.
-> Simply attach the GM Reversal Indicator to any chart you want. The larger the timeframe, the better the signal quality (you should use with the timeframe from H4) -> This is my signal : https://www.mql5.com/en/signals/1415444
Please leave me a positive review, if th
FREE

DiNapoli DMAs (迪纳波利置换移动平均线) DiNapoli DMAs 指标将传奇交易员乔·迪纳波利(Joe DiNapoli)所普及的著名“置换移动平均线”带到了 MetaTrader 5 平台。与传统的移动平均线不同,该指标通过向未来时间位移(平移),有效地过滤了市场噪音并减少了虚假信号,使交易者能够更清晰地识别趋势及支撑/阻力位。 本指标包含了迪纳波利最经典的三组参数组合: 3x3: 3周期简单移动平均线,向未来平移3个周期。 7x5: 7周期简单移动平均线,向未来平移5个周期。 25x5: 25周期简单移动平均线,向未来平移5个周期。 核心优势 趋势识别: 消除传统均线的滞后性,更清晰地判断市场方向。 动态支撑与阻力: 均线在趋势行情中常作为价格“反弹”的关键参考点。 噪音过滤: 在震荡行情(横盘)中表现出色,有效避免频繁的错误信号。 高度自定义: 您可以根据个人策略轻松调整周期、平移位数及颜色设置。 使用手册 1. 安装与设置 下载或购买后,从“导航”窗口将指标拖动到图表上。 在**“输入”**选项卡中,您可以通过 show_dma
FREE

The indicator displays the RSX oscillator in a separate window. The indicator's signals are best used as signals for opening a deal when the price breaks the high or low of the bar on which the signal was given. The opposite signal cancels the previous signal. Settings: Data period for indicator calculation - data period for indicator calculation; Price used to calculate the indicator - price used to calculate the indicator; Oversold level (-1=> 0 <=1) - oversold level; Overbought level (-1=>
FREE

This is Demo version of PipsFactoryWeekly This indicator depends on High and Low price of Currency in last Week and then i made some secret equations to draw 10 lines.
Features: You will know what exactly price you should enter the market . You will know when to be out of market. You will know you what should you do in market: Buy Sell Take profit and there are 3 levels to take your profit Support Resistance Risk to buy Risk to Sell
Signal Types and Frame used: You can use this indicator just
FREE

This indicator is based on Bulls and Bears oscillators, both exposed on Dr. Alexander Elder's book: "Come into my trading room". "Elder Ray" was made with the purpose of identify bulls and bears pressure in the markets. The indicator is basically the union of this two mentioned oscillators but on an efficient way to facilite getting price patterns, divergences, etc. Default parameter is EMA 13.
FREE
The ZoomChart indicator displays data from other timeframes on the current chart in the subwindow, acting as a magnifying glass or, conversely, shrinking the chart to display larger timeframes.
The ZoomChar indicator automatically tracks the current outermost bar on the chart and moves with the chart as it shifts.
The indicator can display data from another financial instrument, not limited to the main chart instrument.
The robot carries the function of “mirroring” - The ability to convert c
FREE
所有MQL5 EA产品,付费100RMB加入VIP会员即可全部无限制使用,详情请咨询客服QQ407776353 所有MQL5 EA产品,付费100RMB加入VIP会员即可全部无限制使用,详情请咨询客服QQ407776353 所有MQL5 EA产品,付费100RMB加入VIP会员即可全部无限制使用,详情请咨询客服QQ407776353 所有MQL5 EA产品,付费100RMB加入VIP会员即可全部无限制使用,详情请咨询客服QQ407776353 所有MQL5 EA产品,付费100RMB加入VIP会员即可全部无限制使用,详情请咨询客服QQ407776353 所有MQL5 EA产品,付费100RMB加入VIP会员即可全部无限制使用,详情请咨询客服QQ407776353 所有MQL5 EA产品,付费100RMB加入VIP会员即可全部无限制使用,详情请咨询客服QQ407776353
FREE

This indicator will mirror the assets in use in another metatrader, being able to choose the timeframe and a template. This is the Metatrader 4 Client, it needs the Metatrader 4 or 5 Server versions: Metatrader 4 Mirror Chart Server: https://www.mql5.com/en/market/product/88644
Metatrader 5 Mirror Chart Server: https://www.mql5.com/en/market/product/88652 Details of how it works in the video.
FREE
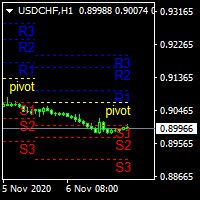
.................................if you need pivot point s levels............................... ............................this is a weekly pivot point level creator........................... ...it is for weekly pivots and show levels at times period d1 , H4 , H1 , M30 ............... .................................also shows levels for 3 last weeks.............................. ................can use it with other indicators and see important levels........
FREE
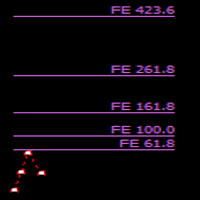
This is Fibo Expansion. You can use it, as profit target at any level... It use price Highs and Lows and price between... It is simple and easy to use... No Input menu, just drag it on your chart and it ready to use... The blue and red dot color indicate it direction... It also use as the same as fractal high and low price as the points to construct the levels... No more analysis to choose the points..
FREE

Introduction This Indicator Is Based On Average Price/Maximum Price Moves, And Using Moving Bollinger Bands And Moving Averages.
The Advantage Of Using It With YOUR own Analysis Will Confirm Potential Supports And Resistances While it Compliments With Your Analysis
The Indicator Is Non-Repainting
AND Along With Our Special Trend METRE that Changes With The Conditions OF A Bullish Or Bearish Trend....
Recommend Time-Frames: H1 H4 M15
Usage: The Indicator Is Very Profitable If Use
FREE

The principle of this indicator is very simple: detecting the candlestick pattern in M30 timeframe, then monitoring the return point of graph by using the pullback of High-Low of M5 Candlestick and finally predicting BUY and SELL signal with arrows, alerts and notifications. The parameters are fixed and automatically calculated on each time frame. Example:
If you install indicator on XAUUSD, timeframe M5: the indicator will detect the reversal, pullback, price action on this timeframe (for exa
FREE

This is a very simple multiple moving average indicator.
It can display 12 moving averages. The time axis of the moving averages can be changed in the input field of the indicator. The process is faster than the 12 moving averages included with MT4.
We also have a buffer set up so you can access it from an Expert Advisor. *For advanced users.
If you have any questions or requests, please message me.
Thank you. MT5 Version: https://www.mql5.com/en/market/product/124997
FREE
MetaTrader市场是您可以下载免费模拟自动交易,用历史数据进行测试和优化的唯一商店。
阅读应用程序的概述和其他客户的评论,直接下载程序到您的程序端并且在购买之前测试一个自动交易。只有在MetaTrader市场可以完全免费测试应用程序。
