SRL Edson Gould
- Göstergeler
- Sürüm: 1.0

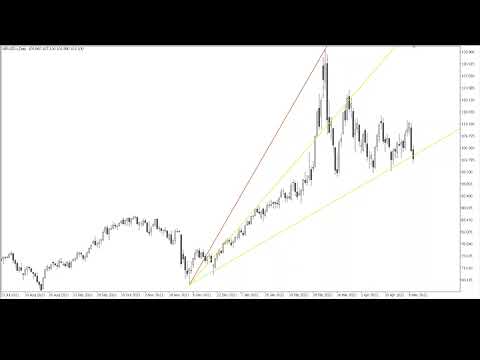
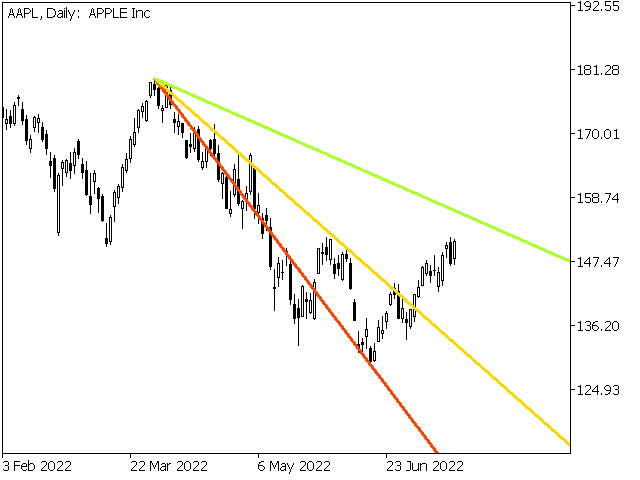
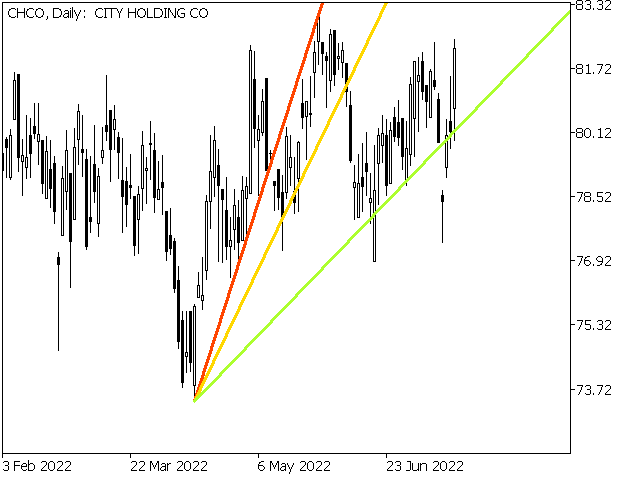
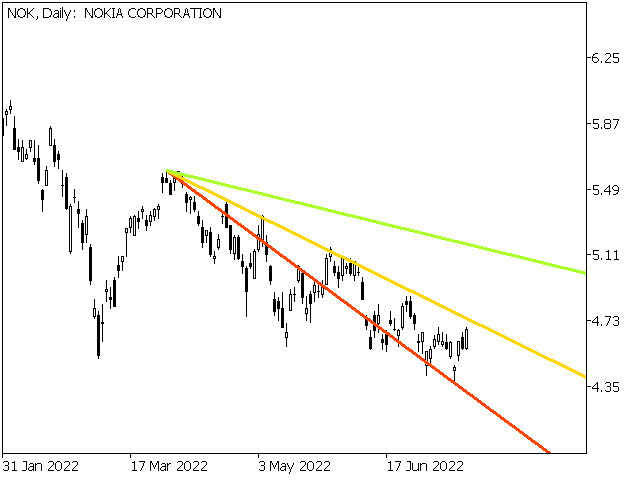
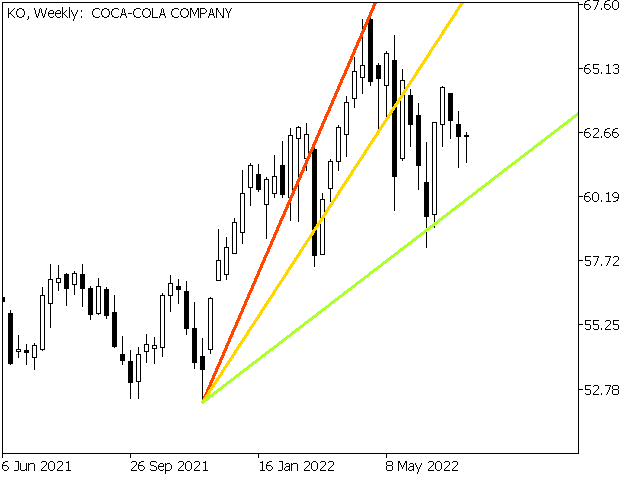
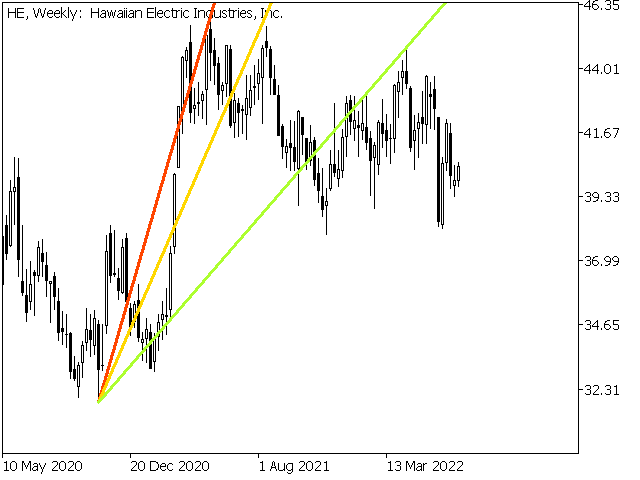
Hız direnci çizgileri, trend ve direnç çizgilerini belirlemek için güçlü bir araçtır. Gösterge, grafiğin ekstremitelerini ve özel matematik formüllerini kullanarak çizgiler çizer. Gösterge, eğilim yönünü ve ters noktaları belirlemek için kullanılabilir.
<---------------------------->
Gösterge parametreleri:
"Depth of search" - grafiğin uç noktalarını bulmanın derinliği (çubuklarda)
"Back step of search" - ekstremiteler arasındaki minimum mesafe (barlarda)
"Deviation of price" - aynı türün uç noktaları arasındaki izin verilen fiyat farkı
"Line color" - ilgili dizindeki çizginin rengi
"Line style" - eşleşen dizindeki çizgi stili
"Line width" - ilgili dizindeki çizgi genişliği
<---------------------------->
Daha fazla bilgiyi "Edson Gould tarafından Nadir Bulunan Yazarlardan Oluşan bir Koleksiyon" kitabında bulabilir veya kişisel mesajlarda benimle iletişime geçerek bulabilirsiniz.
<---------------------------->
İlgilenen herkese şimdiden teşekkür ederim, pazarı fethetmede iyi şanslar!

Отличный индикан