SRL Edson Gould
- Indicatori
- Versione: 1.0

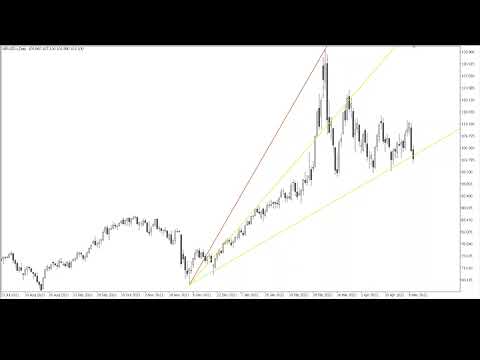
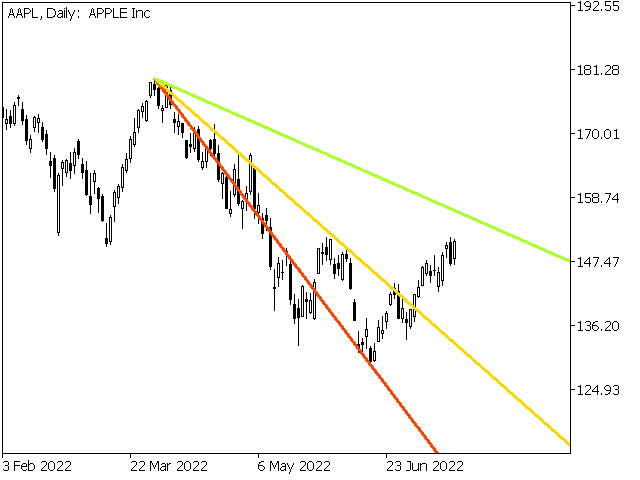
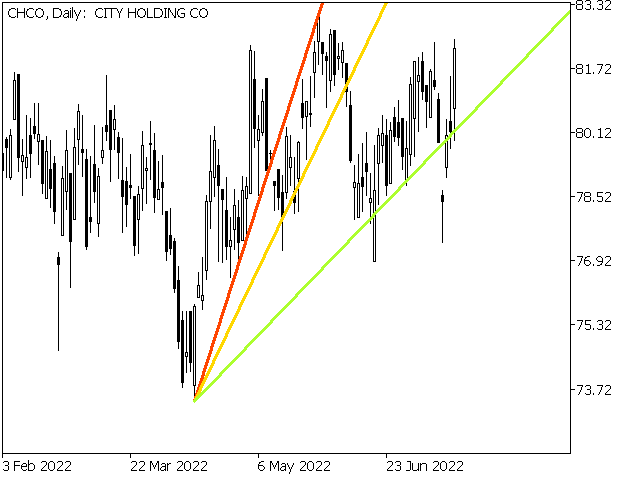
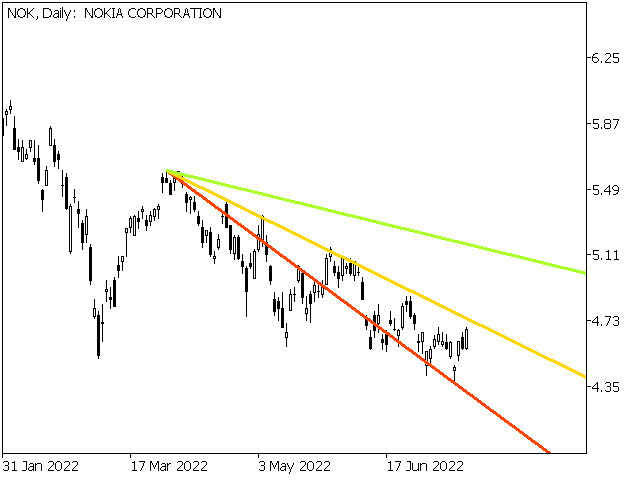
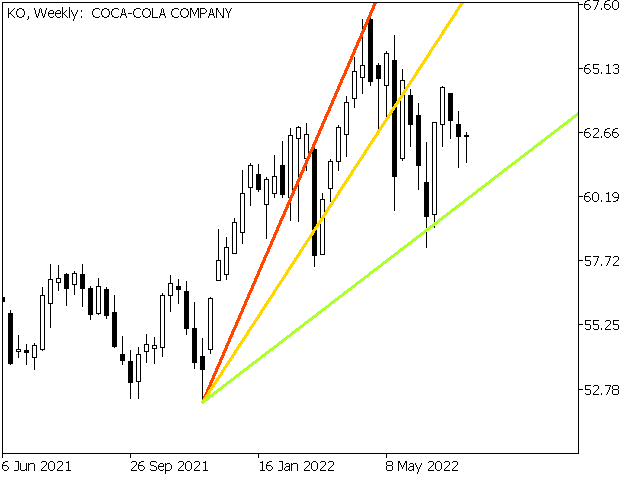
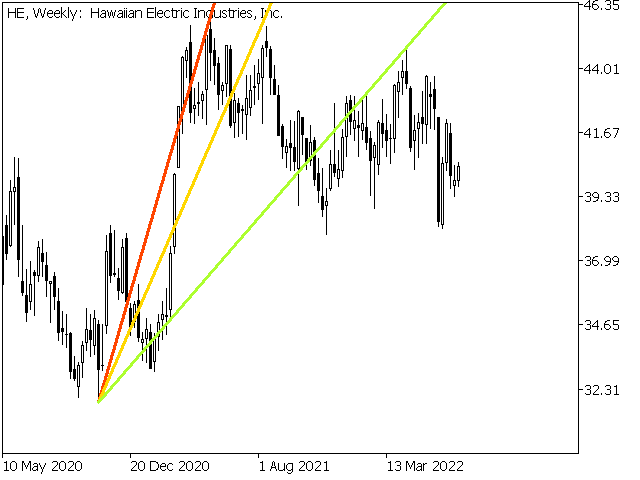
Le linee di resistenza della velocità sono un potente strumento per determinare la tendenza e le linee di resistenza. L'indicatore costruisce linee utilizzando gli estremi del grafico e formule matematiche speciali. L'indicatore può essere utilizzato per determinare la direzione della tendenza e i punti di inversione.
<---------------------------->
Parametri dell'indicatore:
"Depth of search" - profondità (nelle barre) di ricerca di estremi del grafico
"Back step of search" - distanza minima (in barre) tra gli estremi
"Deviation of price" - la differenza di prezzo consentita tra gli estremi dello stesso tipo
"Line color" - Il colore della linea con l'indice corrispondente
"Line style" - stile di linea con indice corrispondente
"Line width" - la larghezza della linea con l'indice corrispondente
<---------------------------->
Puoi trovare maggiori informazioni nel libro "A Collection of Rare Writings by Edson Gould" o contattandomi tramite messaggi privati.
<---------------------------->
Grazie in anticipo a tutti gli interessati, buona fortuna a conquistare il mercato!

Отличный индикан