SRL Edson Gould
- 지표
- 버전: 1.0

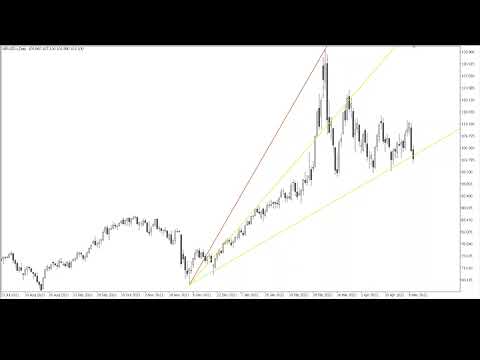
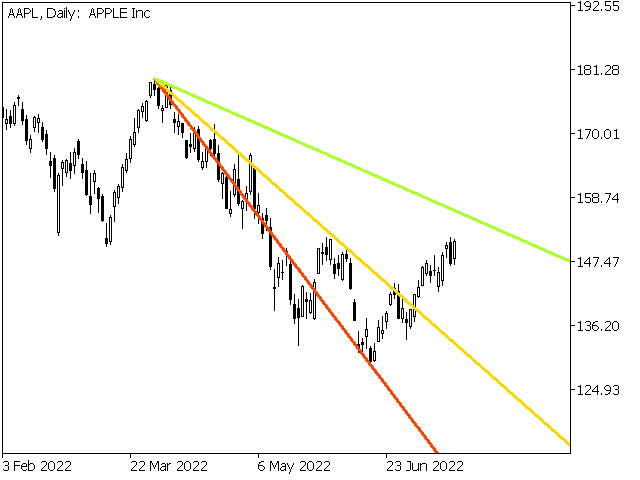
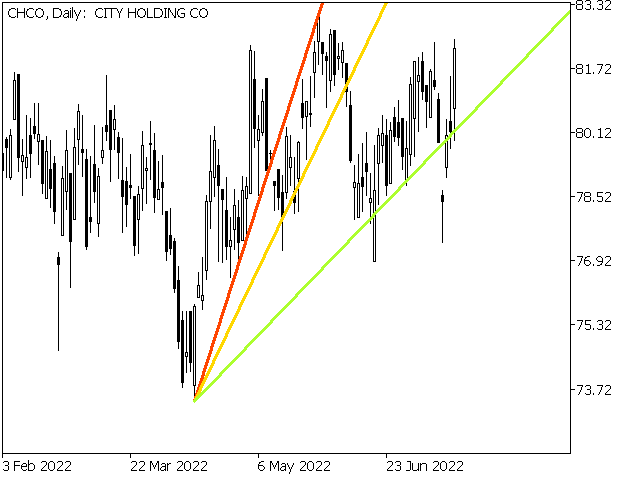
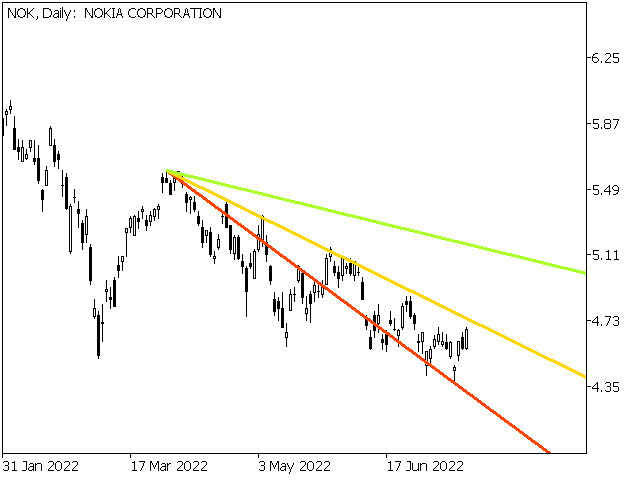
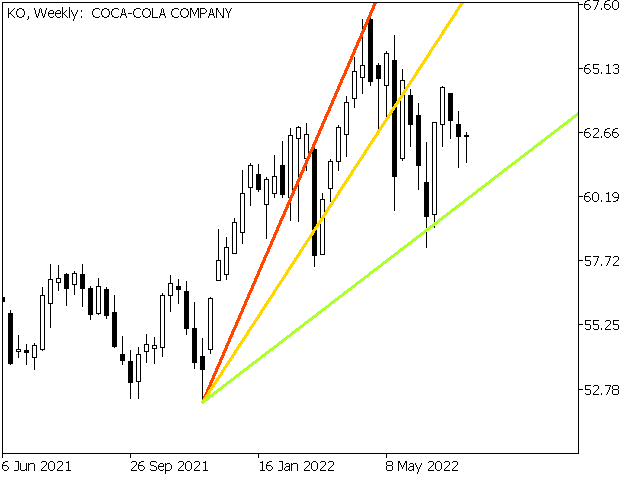
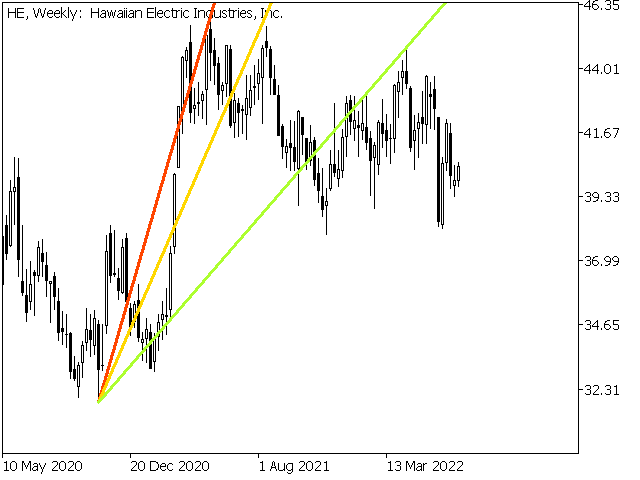
속도 저항선은 추세 및 저항선을 결정하는 강력한 도구입니다. 표시기는 차트 극단 및 특수 수학 공식을 사용하여 선을 만듭니다. 표시기는 추세 방향 및 피벗 포인트를 결정하는 데 사용할 수 있습니다.
<---------------------------->
표시기 매개 변수:
"Depth of search" -차트 극단에 대한 검색의 깊이(막대)
"Back step of search" -극단 사이의 최소 거리(막대)
"Deviation of price" -동일한 유형의 극단 사이의 허용 가격 차이
"Line color" -대응 색인을 가진 선 색깔
"Line style" -해당 인덱스가있는 선 스타일
"Line width "-해당 색인이있는 선 너비
<---------------------------->
당신은 책에서 더 많은 정보를 찾을 수 있습니다"에드 슨 굴드에 의해 희귀 한 글의 모음"또는 개인 메시지에 저에게 연락하여.
<---------------------------->
시장을 정복에 관심있는 모든 사람들에게 미리 감사드립니다,행운을 빕니다!

Отличный индикан