KT Bulls Bears MT4

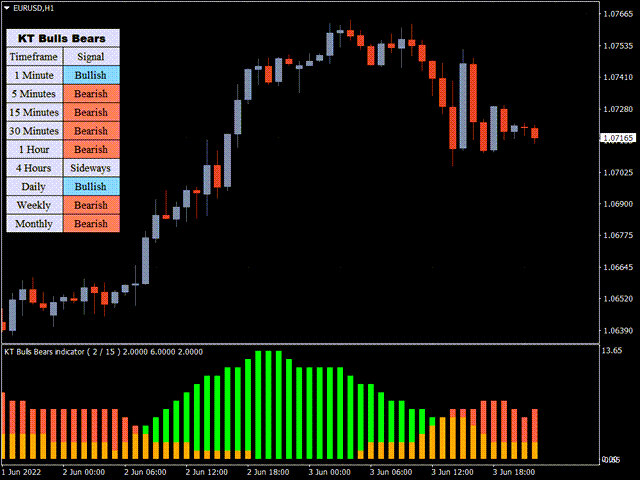
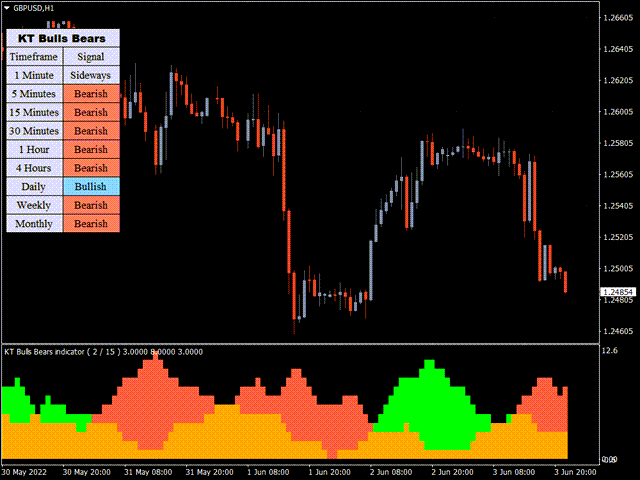
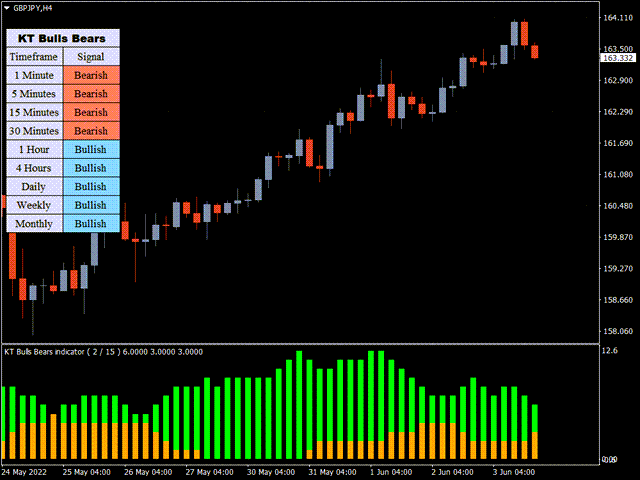
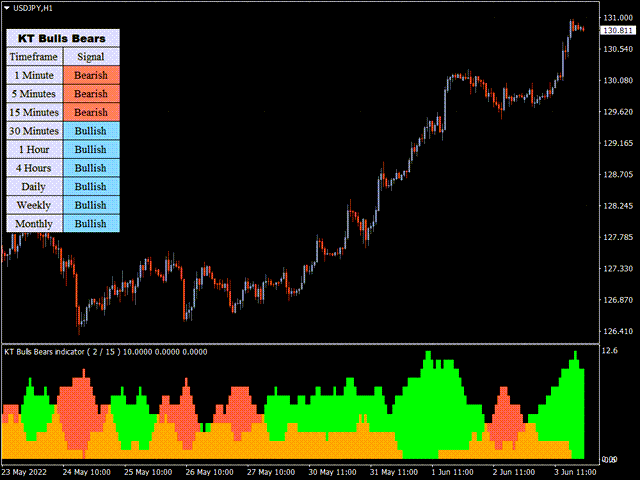
Bu gösterge, RSI’nin aşırı alım/aşırı satım bölgelerinin üzerinde ve altında hareket eden çubuk sayısını kullanarak piyasanın yükseliş veya düşüş trendinde olduğunu gösterir. Yeşil histogram boğa gücünü, kırmızı histogram ise ayı gücünü temsil eder.

Özellikler

  • Yeni işlemlere giriş yapmak veya diğer stratejiler ya da göstergelerden gelen işlemleri doğrulamak için kullanılabilir.
  • Tüm zaman dilimlerindeki boğa/ayı gücünü analiz eden çoklu zaman dilimi tarayıcısı içerir.
  • Yeni yatırımcıların girişlerini boğa/ayı gücüyle doğrulayarak güvenlerini artırmaları için mükemmel bir seçenektir.
  • Tüm MetaTrader bildirimleri dahildir.
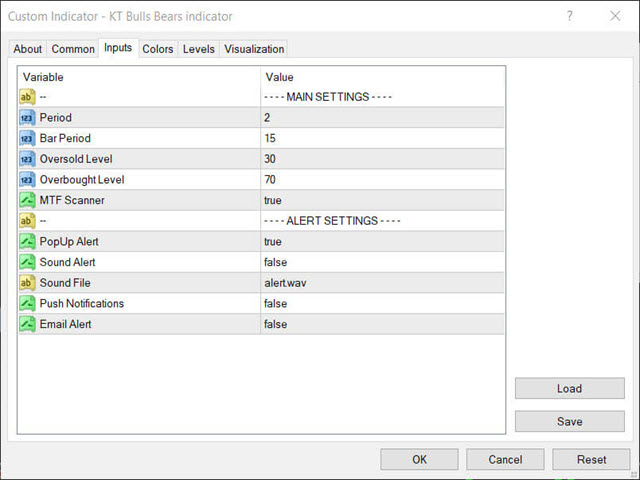
Giriş Parametreleri

  • Dönem: RSI'nin aşırı alım/aşırı satım seviyelerini belirlemek için kullanılan dönem.
  • Çubuk Dönemi: RSI aşırı alım/aşırı satım seviyelerinin üstünde/altında dikkate alınan çubuk sayısı.
  • Aşırı Satım Seviyesi: RSI’de aşırı satım seviyesini belirleyen değer. 
  • Aşırı Alım Seviyesi: RSI’de aşırı alım seviyesini belirleyen değer. 
  • MTF Tarayıcı: Mevcut tüm zaman dilimlerinden sinyal almak için çoklu zaman dilimi tarayıcısı. 
  • Uyarı Ayarları
Önerilen ürünler
TMoney OrderblockDay
Moises Orlando Urbina Sojo
The indicator is triggered at the start of each trading day and detects both bullish and bearish ORDERBLOCK potentials. These levels are of high operational probability, being able to use a minimum ratio of 3 to 1 to maximize profits. It is recommended to use TimeFrame M5 to M30 for a proper display and consider pending orders at the OB levels of the chart and place the SL up to a maximum of 20 pips from the entry price. Submit the indicator to Backtesting to become familiar with its performan
KT Price Border MT4
KEENBASE SOFTWARE SOLUTIONS
KT Price Border, piyasadaki potansiyel en yüksek ve en düşük seviyeleri belirleyen üç bantlı bir fiyat kanalı oluşturur. Bu seviyeler aynı zamanda dinamik destek ve direnç olarak da kullanılabilir. Orta bant, trend yönünü belirlemek için de kullanılabilir ve bu nedenle bir trend takip göstergesi olarak işlev görür. Ayrıca, kullanım kolaylığı ve net ticaret sinyalleri, özellikle yeni yatırımcılar için büyük fayda sağlar. Özellikler Çoğu Forex döviz çifti üzerinde etkili bir şekilde çalışır. Düş
Bu gösterge, pratik ticaret için mükemmel olan otomatik dalga analizine yönelik bir göstergedir! Dava... Not:   Dalga sınıflandırması için Batılı isimleri kullanmaya alışkın değilim. Tang Lun'un (Tang Zhong Shuo Zen) adlandırma kuralının etkisiyle, temel dalgayı   kalem   , ikincil dalga bandını ise   segment   olarak adlandırdım. aynı zamanda segmentin trend yönü vardır. Adlandırma   esas olarak trend segmentidir   (bu adlandırma yöntemi gelecekteki notlarda kullanılacaktır, öncelikle söyleyey
The Strong Volume Trend  MT4 indicator is a powerful tool designed to help traders identify and capitalize on significant volume trends in the financial markets. With its advanced algorithm, this indicator accurately detects the strength and direction of volume movements, allowing traders to make informed trading decisions. Features: Volume Strength Analysis: The indicator analyzes the volume data and identifies strong volume trends, helping traders spot potential market reversals, breakouts, or
KT Bullish Bearish MT4
KEENBASE SOFTWARE SOLUTIONS
KT Bullish Bearish shows the bullish/bearish regime of the market in the form of a colored histogram representing both of the market states alternately. Bull Market (Blue Histogram): A bull market indicates an uptrend when an instrument price rises over a continued period like days, months, or years. Bear Market (Red Histogram): A bear market indicates a downtrend when an instrument price rises over a continued period like days, months, or years. Applications It prevents trading against the big
This indicator is designed to find the difference in MACD price and indicator.  This indicator shows the price and indicator difference on the screen. The user is alerted with the alert sending feature. Our Popular Products Super Oscillator HC Cross Signal Super Cross Trend Strong Trend Super Signal Parameters divergenceDepth -  Depth of 2nd ref. point search Fast ema -  Fast ema setting Slow ema - slow ema setting MACD sma - macd sma setting indAppliedPrice -  Applied price of indicator indMAM
My Point MT4
Claudia Ramona Angerer
4 (1)
Diagnosis of major and minor pivot Trend detection with many signals Can be used in all symbols Can be used in all time frames Settings: Back Show: The number of candles it displays If you need any adjustments, or have any questions or suggestions, message me How to trade: Blue: sell signal Red: buy signal Blue and red at the same time: no signal Exit signal: Opposite signal
Stochastic Divergence Multicurrency Scanner MT4 , özellikle MetaTrader 4 için tasarlanmış son teknoloji bir göstergedir ve trader'ların geniş bir döviz çifti ve zaman dilimi yelpazesinde boğa ve ayı Stochastic sapma sinyallerini verimli bir şekilde tanımlamalarını sağlar. Bu araç, piyasa analizlerini geliştirmek ve sürekli manuel izleme zahmetine girmeden bilinçli kararlar almak isteyen trader'lar için mükemmeldir. Gerçek zamanlı tarama yetenekleri ve kullanıcı dostu kontrol paneli ile bu göster
To access the TD sequential Scanner for MT5, please check https://www.mql5.com/en/market/product/123369?source=Site +Market+My+Products+Page. One of the MT5 versions includes additional timeframes such as M1, M2, M3,H2,H6,H8 and so on.( https://www.mql5.com/en/market/product/123367?source=Site +Market+My+Products+Page) TD Sequential Scanner: An Overview The TD Sequential scanner is a powerful technical analysis tool designed to identify potential price exhaustion points and trend reversals in fi
This indicator is designed to find the difference in RSI price and indicator.  This indicator shows the price and indicator difference on the screen. The user is alerted with the alert sending feature. Our Popular Products Super Oscillator HC Cross Signal Super Cross Trend Strong Trend Super Signal Parameters divergenceDepth -   Depth of 2nd ref. point search RSI_Period -   Second calculation period indAppliedPrice -   Applied price of indicator indMAMethod -   MA calculation method findExtInte
Bu gösterge, tüccarın ihtiyacına göre grafiği daha temiz hale getirmek için etkinleştirilebilen / devre dışı bırakılabilen 6 seviyeye kadar çizer Bu 6 seviye 2 set halindedir: Yüksek ve Düşük Her set için farklı zaman aralığı seçilebilir Fiyatın Günlük, Haftalık veya Aylık En Düşük seviyeye ulaştığında genellikle 5dk gibi daha küçük bir zaman diliminde reddedildiği düşünüldüğünden, Önceki Yüksek Düşük tersine çevirme stratejisine dayanır. Özellikler : - Tek bir grafikte 6 Zaman Çerçevesi Y
KT DMA is a modified and advanced version of the classic Displaced Moving Averages with buy/sell crossover alerts and a Multi-Timeframe scanner that shows DMA's direction across each real-time time frame. A Displaced Moving Average is a simple moving average that moves ahead or backward in a time frame (either short-term or long-term). It also allows you to predict price movement more accurately. Features Depicts the trend direction using the alignment of three moving averages. Buy/Sell signals
KT Tether Line MT4
KEENBASE SOFTWARE SOLUTIONS
The KT Tether Line is a trend-following tool consisting of three indicators that work together to generate trading signals. It can correctly identify market trends while signaling trade entries. It was first introduced by Bryan Strain in the Stock & Commodities magazine in 2000 in "How to get with the trend and out at the end." The Concept When a market trend is confirmed, the most challenging part is determining the timing of the entries. This indicator alerts you to potential trend reversals
Trend Waves indicator is a trend indicator that uses Average True Range and Standard Deviation indications. It is aimed to find more healthy trends with this indicator. This indicator can be used alone as a trend indicator. Detailed review 4 different trend colors appear on this indicator.  The aqua color represents the rising trend. Dark aqua color means the train is getting weaker. pink color represents the downtrend trend. The dark pink color  means the trend is weaker. Parameters Stdeviatio
KT Market Speed MT4
KEENBASE SOFTWARE SOLUTIONS
The KT Market Speed is a unique and straightforward oscillator-based technical analysis tool that helps traders visualize the speed at which the price of an instrument changes based on the preset length. The Market Speed representation helps correctly map the price momentum: is it moving fast, slowing down, or trapped in a range? These are the questions the indicator answers, giving traders more bandwidth to execute better-informed trade positions. Formula It's a simple technical analysis tool
Popüler   Bollinger Bandı Breakout Stratejisini   geliştirmek için tasarlanmış güçlü bir teknik gösterge olan   Bollinger Band Volume Breakout Detector ile   tanışın. Bu gösterge, Hacim Verilerini dahil ederek yanlış sinyalleri etkili bir şekilde en aza indirerek trend takibini bir sonraki seviyeye taşır. "Hacim fiyatı teyit eder" ilkesine bağlı kalarak bu araç, tacirlerin hacimdeki önemli artışların eşlik ettiği fiyat kırılmalarını belirlemesine olanak tanır ve daha doğru ticaret kararları alın
PTW NON REPAINT TRADING SYSTEM + HISTOGRAM Non-Repainting ,   Non-Redrawing   and   Non-Lagging  Trading System. Does the following: - Gives Accurate Entry and Exit Points - Scalping, Day and Swing Trading  - 95% Accuracy  - Targets, where to take profits. - Shows Trends, Support and resistance levels - Works on All Brokers - Works on All Currencies, CFDs and Stocks - It does not place trades for you, it only shows you what trades to place. - It works on All Timeframes - It is for Trend or ran
The       Parabolik Breakout Tarayıcı Pro       bir       kapsamlı piyasa analiz aracı       tasarlanmış       birden fazla döviz çiftini ve zaman dilimini aynı anda izleyin       kullanarak       Parabolik SAR kopuş tespiti   . Bu gösterge       sürekli taramalar       çeşitli       ticaret araçları       Ve       zaman ufukları   , tanımlama       potansiyel kopuş kalıpları       ve tüccarlara bir       merkezi gösterge paneli       ticaret fırsatlarının izlenmesi.       Parabolik SAR tersine
KT Top G MT4
KEENBASE SOFTWARE SOLUTIONS
KT Top G, potansiyel piyasa tepe ve diplerini belirlemek için akıllı kanal analizini fiyat hareketine dayalı bir yapıyla birleştiren bir göstergedir. Olası bir dönüş algılandığında, grafik üzerinde kalın ve net oklar çizerek piyasadaki yön değişimi öncesinde sizi uyarır. Büyük Oklar: Fiyatın tükenmesi ve momentum değişimini algılayarak yüksek olasılıklı tepe ve dip seviyelerini vurgular. Küçük Oklar: Daha düşük olasılıklı dönüş noktalarını gösterir; bu noktalar genellikle piyasa gerçekten dönmed
The Average True Range (ATR) is a tool to measure volatility. ATR MTF (Multi Time Frame) indicator provides all timeframe trends helps to identify in which kind of volatility environment the market .This indicator can be used with any Trading Systems for additional confirmation of trading entries or exits. It is a very helpful tool to calculate Targets and Stops according the current market conditions.
Four rsi mt4
Vincent Albert Feugier
Multi-RSI – 4 RSIs in 1 for Complete Market Analysis Analyze market strength and momentum like a pro! Multi-RSI combines 4 distinct RSIs in a single window , giving you a clear and fast view of market momentum across multiple timeframes. Each RSI has its own configurable period , allowing you to adapt the indicator to your trading strategies and style. Key Features: 4 RSIs in one indicator – track multiple periods simultaneously. ️ Fully customizable periods – adjust each RSI individ
Rira VWAP Bands
Vitor Palmeira Abbehusen
VWAP Bands gives you the regular Volume-Weighted Average Price and also the deviation bands. Use this indicator to see the possible amount of market movement, find support and resistance lines, find good spots for entry and exit,  and the most important feature is to find possible pivot points. This indicator has been mathematically improved by Rira team. The calculation begins at the start of each trading day
Detailed blog post with screenshots here: https://www.mql5.com/en/blogs/post/762513 Features: This scanner will show: NRTR Basket Trading Trend direction Last NRTR Switch (breakout) - number of bars and if it was a high volume bar How many bars has the SR stayed steady for When price last entered an NRTR shadow When price bounced off the NRTR shadow back inside NRTR Explained: https://www.mql5.com/en/blogs/post/762509 Basket Trading If you like to basket trade, then you can set multiple scann
It could help to calculate Risk-Reward easily before placing a BUY-SELL position. TradeSizeCalculator is a Multi-Tasking Calculator. It will calculate the others when we define the value in one of the columns. Stoploss, risk percentage, risk-money, lot size, take-profit , reward-money, and reward-ratio. Depending on which value is changed. All values in the columns are editable. Also, we can get those calculation results by drag-drop the stop-loss/take-profit line. Parameter: The inputs below ar
QuantumAlert Stoch Navigator is a free indicator available for MT4/MT5 platforms, its work is to provide "alerts" when the market is inside "overbought and oversold" regions in the form of "buy or sell" signals. This indicator comes with many customization options mentioned in the parameter section below, user can customise these parameters as needful. Join our   MQL5 group , where we share important news and updates. You are also welcome to join our private channel as well, contact me for the p
FREE
Similar to logic used in: Golden MA MTF TT   Overview "Golden MA" indicator for OB/OS levels. It's based on High/Lows of higher timeframe (HTF) previous bar. Only useful in swing trading or scalping. Best for at least M15+. For lower timeframes you'll need to change StartPips to lower value to get consistent lines. Because lower timeframes will have smaller pip distances.   Features - Define Higher Timeframes for Current Timeframe: Use a comma-separated list to define the higher timeframe for th
FREE
About Scanner: It will show you the Higher/Lower Highs and Lows of zigzag price. Use it to keep track of best ongoing trends and price ranges. Detailed blog post: https://www.mql5.com/en/blogs/post/750232 Symbols: HH: Higher Highs HL: Higher Lows When price makes higher and higher Highs or higher Lows: It will count Zigzag in reverse and find total number of last "Higher Highs" and "Higher Lows" or "Lower Lows" and "Lower Highs". LL: Lower Lows LH: Lower Highs How to Use: Suppose price is
I  recommend you to read the   product's blog  (manual) from start to end so that it is clear from the beginning what the indicator offers. This multi time frame and multi symbol indicator identifies double top/bottom, head & shoulders, pennant/triangle and flag patterns. It is also possible to setup alerts only when a neckline/triangle/flagpole breakout has occured (neckline breakout = confirmed signal for top/bottoms and head & shoulders).  The indicator can also be used in single chart mode.
MT Scanner
Niravkumar Maganbhai Patel
4 (2)
This indicator helps you to Scan symbols which are in the Market Watch Window  and filter out trends with alerts. It works based on the effective indicator "SUPERTREND" which is used by many traders for trading: When box color changes to " Green " or " Red " color, it indicates you for trend change for long and short entry. And also you will get alerted on screen. When it changes to " Green ", it indicates you that trend is going upwards, and you can take the long entry. If the color changes to
FREE
Signal Arrows is an indicator that generates trade arrows. It generates trade arrows with its own algorithm. These arrows give buying and selling signals.  Can be used in all pairs. Sends a signal to the user with the alert feature. The indicator certainly does not repaint. Trade rules Enter the signal when the buy signal arrives. In order to exit from the transaction, an opposite signal must be received. It is absolutely necessary to close the operation when an opposite signal is received. The
Bu ürünün alıcıları ayrıca şunları da satın alıyor
Neuro Poseidon MT4
Daria Rezueva
4.95 (37)
Neuro Poseidon is a new indicator by Daria Rezueva. It combines precise trading signals with adaptive TP/SL levels - creating best possible trades as a result! Message me and get  Neuro Poseidon Assistant  as a gift to automize your trading process! What makes it stand out? 1. Proven profitability on all assets and timeframes 2. Only confirmed BUY and SELL signals present on the chart 3. Adaptive TP & SL levels generated by the software for each trade 4. Easy to understand - suitable for all
Miraculous Göstergesi – Gann Dokuz Kareye Dayalı %100 Tekrarlamayan Forex ve İkili Araç Bu video, Forex ve İkili Opsiyon traderları için özel olarak geliştirilmiş son derece doğru ve güçlü bir ticaret aracı olan Miraculous Göstergesi 'ni tanıtıyor. Bu göstergeyi benzersiz kılan, efsanevi Gann Dokuz Karesi ve Gann Titreşim Yasası 'na dayanmasıdır; bu da onu modern ticarette mevcut en hassas tahmin araçlarından biri yapmaktadır. Miraculous Göstergesi tamamen tekrarlamaz ; yani mum kapandıktan son
Trend Catcher ind
Ramil Minniakhmetov
5 (4)
TREND YAKALAYICI GÖSTERGE Trend Yakalayıcı Gösterge, yazarın tescilli ve özelleştirilmiş uyarlanabilir trend analiz göstergelerinin bir kombinasyonunu kullanarak piyasa fiyat hareketlerini analiz eder. Kısa vadeli gürültüyü filtreleyerek ve temel momentum gücüne, volatilite genişlemesine ve fiyat yapısı davranışına odaklanarak gerçek piyasa yönünü belirler. Ayrıca, hareketli ortalamalar, RSI ve volatilite filtreleri gibi yumuşatma ve trend filtreleme özelleştirilmiş göstergelerinin bir kombina
Gann Made Easy
Oleg Rodin
4.84 (165)
Gann Made Easy , bay teorisini kullanarak ticaretin en iyi ilkelerine dayanan, profesyonel ve kullanımı kolay bir Forex ticaret sistemidir. WD Gann. Gösterge, Zararı Durdur ve Kâr Al Seviyeleri dahil olmak üzere doğru SATIN AL ve SAT sinyalleri sağlar. PUSH bildirimlerini kullanarak hareket halindeyken bile işlem yapabilirsiniz. Satın alma işleminden sonra, alım satım talimatlarını ve harika ek göstergeleri ücretsiz olarak almak için lütfen benimle iletişime geçin! Muhtemelen Gann ticaret yöntem
Dynamic Forex28 Navigator
Bernhard Schweigert
4.43 (7)
Dynamic Forex28 Navigator - Yeni Nesil Forex Ticaret Aracı. ŞU ANDA %49 İNDİRİM. Dynamic Forex28 Navigator, uzun zamandır popüler olan göstergelerimizin evrimidir ve üçünün gücünü tek bir göstergede birleştirir: Gelişmiş Döviz Gücü28 Göstergesi (695 inceleme) + Gelişmiş Döviz İMPULS ve UYARI (520 inceleme) + CS28 Kombo Sinyalleri (Bonus). Gösterge hakkında ayrıntılar https://www.mql5.com/en/blogs/post/758844 Yeni Nesil Güç Göstergesi Ne Sunuyor?  Orijinallerde sevdiğiniz her şey, şimdi yeni
M1 Sniper
Oleg Rodin
5 (24)
M1 SNIPER kullanımı kolay bir işlem göstergesi sistemidir. M1 zaman dilimi için tasarlanmış bir ok göstergesidir. Gösterge, M1 zaman diliminde scalping için bağımsız bir sistem olarak kullanılabilir ve mevcut işlem sisteminizin bir parçası olarak kullanılabilir. Bu işlem sistemi özellikle M1'de işlem yapmak için tasarlanmış olsa da, diğer zaman dilimleriyle de kullanılabilir. Başlangıçta bu yöntemi XAUUSD ve BTCUSD ticareti için tasarladım. Ancak bu yöntemi diğer piyasalarda işlem yaparken de ya
Scalper Inside PRO
Alexey Minkov
4.68 (69)
Scalper Inside PRO Scalper Inside PRO is an intraday trend and scalping indicator that uses exclusive built-in algorithms to evaluate market direction and key target levels. The indicator automatically calculates entry and exit points and several profit target levels, and it shows detailed performance statistics, so you can see how different instruments and strategies behaved on historical data. This helps you select instruments that fit current market conditions. You can also connect your own a
Advanced Supply Demand
Bernhard Schweigert
4.91 (300)
Özel Ticaret –%30 İndirim Yeni Başlayanlar veya Uzman Yatırımcılar İçin En İyi Çözüm! Bu gösterge, bir dizi özel özellik ve yeni bir formül içerdiği için benzersiz, yüksek kaliteli ve uygun fiyatlı bir işlem aracıdır. Bu güncelleme ile çift zaman dilimi bölgeleri gösterebileceksiniz. Sadece daha yüksek bir zaman dilimini değil, hem grafik zaman dilimini hem de daha yüksek zaman dilimini gösterebileceksiniz: İÇ İÇE GEÇMİŞ BÖLGELER GÖSTERİYOR. Tüm Arz Talep yatırımcıları buna bayılacak. :) Önem
MetaBands M4
Vahidreza Heidar Gholami
3.5 (6)
MetaBands uses powerful and unique algorithms to draw channels and detect trends so that it can provide traders with potential points for entering and exiting trades. It’s a channel indicator plus a powerful trend indicator. It includes different types of channels which can be merged to create new channels simply by using the input parameters. MetaBands uses all types of alerts to notify users about market events. Features Supports most of the channel algorithms Powerful trend detection algorith
Genesis Matrix Pro is a professional multi-timeframe trend detection indicator designed to help traders identify high-quality market alignment with clarity and structure. It combines 12 different technical indicators into one visual alignment matrix, allowing traders to quickly see when market conditions are bullish, bearish, or neutral. A signal is generated only when the selected strategies are aligned, helping reduce noise and improve decision-making. PLEASE CONTACT ME AFTER PURCHASE TO GET
Bu ürün 2026 piyasası için güncellendi ve en son MT5 sürümleri için optimize edildi. FİYAT GÜNCELLEME BİLDİRİMİ: Smart Trend Trading System şu anda $99 fiyatıyla sunulmaktadır. Sonraki 30 satın alma işleminden sonra fiyat $199 olacaktır. ÖZEL TEKLİF: Smart Trend Trading System satın aldıktan sonra bana özel mesaj gönderin, Smart Universal EA’yı ÜCRETSİZ olarak alın ve Smart Trend sinyallerinizi otomatik işlemlere dönüştürün. Smart Trend Trading System, daha temiz sinyaller, daha iyi trend yönü
Gann Kare Göstergesi, W.D. Gann tarafından yazılan "Piyasa Tahminleri için Matematiksel Formül" makalesine dayalı güçlü bir piyasa analizi aracıdır. Bu araç, piyasa analizi için matematiksel ve Gann teorilerini kullanarak hassas analizler gerçekleştirir. 144, 90, 52 karelerini ve ayrıca 9 karesini kullanır. Ayrıca, 'ın 9 karesi ve bu kareyle ilişkili kanallar ve yıldız modelleri için yöntemini içerir. Kullanıcı Kılavuzu ve Uygulama: Bu göstergeleri kullanmadan önce, kullanıcı kılavuzunu okumanız
Breakout Arrows Mt4
Michael Oko Oboh
5 (1)
Trend Breakout Arrows Indicator The Trend Breakout Arrows Indicator is a momentum-based signal tool designed to identify potential bullish and bearish breakout opportunities. It displays clear arrow signals directly on the price chart, helping traders quickly recognize possible trend changes and continuation setups. Up Arrow (Buy Signal) A magenta up arrow appears below a candle when bullish momentum begins to strengthen. This signal indicates that buying pressure may be overtaking selling press
Neo Wave PRO
Nikolay Raykov
5 (1)
Price & Time Market Structure Indicator A professional market structure tool that analyzes waves through both price and time — not price alone. Main Description NeoWave PRO is a professional market structure indicator for MetaTrader 4 designed for traders who want to move beyond traditional one-dimensional wave tools such as ZigZag, swing indicators, and basic high/low systems. Most wave indicators analyze only one thing: Price. But a real market wave is not only a price movement. A true wave de
The price increases every 10 purchases, the next price is $149! Prop Firm Sniper MT4   is a professional market structure indicator that automatically identifies high-probability BUY and SELL opportunities using BOS and CHoCH analysis. CONTACT ME AFTER PURCHASE TO CLAIM YOUR FREE BONUSES! Prop Firm Sniper  is a professional market structure indicator designed to identify trend continuations and reversals while automatically generating complete trade setups. The indicator analyzes price actio
BTMM State Engine Pro is a MetaTrader 4 indicator for traders who use the Beat The Market Maker approach: Asian session context, kill zone timing, level progression, peak formation detection, and a multi-pair scanner from a single chart. It combines cycle state logic with a built-in scanner dashboard so you do not need the same tool on many charts at once. What it does Draws the Asian session range; session times can follow broker server offset or be set in inputs. Tracks level progression (L
Enigma scalper fx
Yonny Pascal Ekwa Mezui
Enigma Scalper  Overview Enigma Scalper Pro is a multi-filter breakout indicator designed for traders who want clean entry signals with confirmation from several technical conditions instead of relying on a single trigger. The indicator combines: 3-Bar Breakout pattern detection Higher Timeframe confluence Bollinger Band extreme filtering RSI momentum analysis Optional EMA trend filtering ATR-based SL/TP projection Signals are generated only after candle close to ensure stable non-repainting beh
PRO Renko Sistemi, RENKO grafikleri ticareti için özel olarak tasarlanmış son derece hassas bir ticaret sistemidir. Bu, çeşitli ticaret araçlarına uygulanabilen evrensel bir sistemdir. Sistemi etkin piyasa sana doğru ters sinyallerine erişim hakkı denilen ses nötralize eder. Göstergenin kullanımı çok kolaydır ve sinyal üretiminden sorumlu tek bir parametreye sahiptir. Aracı, seçtiğiniz herhangi bir ticaret aracına ve renko çubuğunun boyutuna kolayca uyarlayabilirsiniz. Yazılımımla karlı bir
Pinpoint , XAUUSD için doğru alım ve satım sinyalleri sağlamak amacıyla geliştirilmiş, yeniden çizim yapmayan ve gecikmesiz, yüksek verimli bir işlem göstergesidir. Gösterge, hızlı değişen bir piyasada gerçek zamanlı olarak hızlı, doğru ve görsel çözümler isteyen yatırımcılar için oluşturulmuştur. Gösterge, hazır bir ticaret stratejisi olarak çalışır. O, varlığın fiyatının davranışını belirlenen bir algoritmaya göre analiz eder ve ideal giriş noktalarını belirler, ayrıca kârın en iyi nerede sabi
The indicator scans for Dinapoli thrust pattern in multiple timeframes for the all markets filtered and shows the results on Dashboard. Key Features Dashboard can be used for all markets It can scan for thrust pattern on MN1, W1, D1, H4, H1, M30, M15 ,M5, M1 timeframes Ability to choose number of bars required above/below displaced moving average to define thrust Parameters UseMarketWatch: Set true to copy all symbols available in market watch MarketWatchCount : Set the number of symbols that
ŞU ANDA %40INDIRIMLI Yeni Başlayanlar veya Uzman Tüccarlar için En İyi Çözüm! Bu Gösterge benzersiz, yüksek kaliteli ve uygun fiyatlı bir ticaret aracıdır çünkü bir dizi tescilli özellik ve yeni bir formül ekledik. Sadece BİR grafik ile 28 Forex çifti için Döviz Gücünü okuyabilirsiniz! Yeni bir trendin veya scalping fırsatının tam tetik noktasını belirleyebildiğiniz için ticaretinizin nasıl gelişeceğini hayal edin? Kullanım kılavuzu: buraya tıklayın Bu ilk olan, orijinal! Değersiz bir özent
Reversion King MT4
Eugen-alexandru Zibileanu
Piyasaya Yeni Bir Kral Geldi – Gösterge + Emir Yönetimi (TP1 + TP2 + TP3) (TAM TİCARET SİSTEMİ) Bu gösterge; gelişmiş bir strateji, tamamen özelleştirilebilir emir yönetim sistemi ve Envelopes genişlemelerini kullanan bir Ortalama Dönüş (Mean Reversion) sistemi ile birlikte gelir. RSI gibi çoklu akıllı onay filtreleri sayesinde yüksek olasılıklı dönüş noktalarını tespit eder ve net BUY (Alış) ile SELL (Satış) sinyalleri üretir. Gösterge Repaint Yapmaz (No Repaint). Sadece işlem açmayı değil, ayn
Introduction Harmonic Patterns are best used to predict potential turning point. Traditionally, Harmonic Pattern was identified manually connecting peaks and troughs points in the chart. Manual harmonic pattern detection is painfully tedious and not suitable for everyone. You are often exposed under subjective pattern identification with manual pattern detection. To avoid these limitations, Harmonic Pattern Plus was designed to automate your harmonic pattern detection process. The functionality
KT Alpha Hunter Arrows MT4
KEENBASE SOFTWARE SOLUTIONS
Çoğu ok göstergesi size yalnızca bir sinyal verir ve geri kalan her şeyi sizin çözmenizi bekler. KT Alpha Hunter Arrows ise size eksiksiz bir işlem planı sunar. Her sinyal oku, grafikte hazır bir planla birlikte görünür: giriş çizgisi, stop loss, dört take profit seviyesi ve bu sembol ile zaman diliminin o anda işlem yapmaya değer olup olmadığını gösteren canlı edge kararı. Pakete dahil olan Trade Manager EA, siz işleme girdikten sonra yönetimi üstlenir. Böylece piyasa hareketli ve duygusal açıd
Break Axis Signal
Leandro Bernardez Camero
BreakAxis — Dönüş Noktasında Hassas Sinyaller Yeni güncellemeleri kaçırmamak için kanala katılın: https://www.mql5.com/en/channels/forexnewadvisor Eksen Kesişimine Dayalı Sinyal Mantığı BreakAxis Signal, sıfır ekseni kesişimlerine dayalı olarak fiyat yönündeki değişimleri algılamak üzere tasarlanmıştır. Histogram geçişleri, potansiyel piyasa momentumu değişimlerini vurgulamak için kullanılır ve yön okları ile görsel onay sağlanır. Sinyal Onayı ve Kararlılığı Her sinyal, belirli matematikse
PZ ABCD Retracement
PZ TRADING SLU
4 (5)
Identify precise entry and exit points with AB=CD patterns This indicator finds AB=CD retracement patterns. The AB=CD Retracement pattern is a 4-point price structure where the initial price segment is partially retraced and followed by an equidistant move from the completion of the pullback, and is the basic foundation for all harmonic patterns. [ Installation Guide | Update Guide | Troubleshooting | FAQ | All Products   ] Customizable pattern sizes Customizable AC and BD ratios Customizable b
Trend Lines PRO
Roman Podpora
5 (1)
TREND ÇİZGİLERİ PRO     Piyasanın gerçek yön değişimini anlamaya yardımcı olur. Gösterge, gerçek trend dönüşlerini ve büyük oyuncuların piyasaya yeniden girdiği noktaları gösterir. Anlıyorsun     BOS hatları  Daha yüksek zaman dilimlerindeki trend değişiklikleri ve önemli seviyeler, karmaşık ayarlar veya gereksiz gürültü olmadan gösterilir. Sinyaller yeniden çizilmez ve çubuk kapandıktan sonra grafikte kalır. VERSION MT 5     -    RFI LEVELS PRO  göstergesiyle birlikte kullanıldığında maksimum p
Legacy of Gann
Pavel Zamoshnikov
4.83 (12)
The indicator very accurately determines the levels of the possible end of the trend and profit fixing. The method of determining levels is based on the ideas of W.D.Gann, using an algorithm developed by his follower Kirill Borovsky. Extremely high reliability of reaching levels (according to K. Borovsky  - 80-90%) Indispensable for any trading strategy – every trader needs to determine the exit point from the market! Precisely determines targets on any timeframes and any instruments (forex, met
RFI levels PRO
Roman Podpora
5 (1)
Bu gösterge, fiyat dönüş noktalarını ve fiyat geri dönüş bölgelerini doğru bir şekilde gösterir.       Başlıca oyuncular   . Yeni trendlerin nerede oluştuğunu görüyorsunuz ve her işlem üzerinde kontrolü elinizde tutarak, azami hassasiyetle kararlar alıyorsunuz. TREND LINES PRO   göstergesiyle birlikte kullanıldığında maksimum potansiyelini ortaya koyar.  VERSION MT5 Göstergenin gösterdiği şey: Yeni bir trendin başlangıcında aktivasyonla birlikte tersine dönüş yapıları ve tersine dönüş seviyeler
ŞU ANDA %40 INDIRIMLI !!! Yeni Başlayanlar veya Uzman Tüccarlar için En İyi Çözüm! Bu gösterge benzersiz, yüksek kaliteli ve uygun fiyatlı bir ticaret aracıdır çünkü bir dizi tescilli özellik ve gizli bir formül ekledik. Yalnızca BİR grafikle 28 döviz çiftinin tümü için Uyarılar verir. Yeni bir trendin veya scalping fırsatının tam tetik noktasını belirleyebildiğiniz için ticaretinizin nasıl gelişeceğini hayal edin! Yeni temel algoritmalar üzerine inşa edilen bu sistem, potansiyel işlemlerin
Yazarın diğer ürünleri
KT Auto Support Resistance Levels: MetaTrader 4/5 için Çoklu Zaman Dilimi S&R, Smart Zones ve Seviye Paneli Swing tepeleri. Pivotlar. Order block’lar. Önceki tepe ve dipler. Her trader piyasayı biraz farklı şekilde işaretler ve bunun bedelini genellikle grafik öder. Tek ekrana yeterince fazla yöntem yığarsanız, grafik artık bir harita olmaktan çıkar. Gürültüye dönüşür. KT Auto Support Resistance Levels bunu çözer. Aylık, haftalık, günlük ve mevcut zaman diliminizi aynı anda tarar, ardından gerçe
ACB Breakout Arrows MT5
KEENBASE SOFTWARE SOLUTIONS
3.5 (2)
ACB Breakout Arrows göstergesi, özel bir kırılma modelini tespit ederek piyasada önemli bir giriş sinyali sağlar. Göstergenin algoritması, fiyatın belirli bir yönde ivme kazandığı anları sürekli olarak tarar ve ana hareketten hemen önce doğru giriş sinyali verir. Çok sembollü ve çok zaman dilimli tarayıcıyı buradan alın - ACB Breakout Arrows MT5 için Tarayıcı Temel Özellikler Gösterge, Stop Loss ve Take Profit seviyelerini otomatik olarak belirler. Tüm zaman dilimlerinde kırılma sinyallerini i
KT Auto Support Resistance Levels: MetaTrader 4/5 için Çoklu Zaman Dilimi S&R, Smart Zones ve Seviye Paneli Swing tepeleri. Pivotlar. Order block’lar. Önceki tepe ve dipler. Her trader piyasayı biraz farklı şekilde işaretler ve bunun bedelini genellikle grafik öder. Tek ekrana yeterince fazla yöntem yığarsanız, grafik artık bir harita olmaktan çıkar. Gürültüye dönüşür. KT Auto Support Resistance Levels bunu çözer. Aylık, haftalık, günlük ve mevcut zaman diliminizi aynı anda tarar, ardından gerçe
Eğer Forex piyasasında işlem yapıyorsanız, döviz gücü ve döviz çiftleri arasındaki korelasyon hakkında ayrıntılı bilgi sahibi olmak, işlem performansınızı yeni bir seviyeye taşıyabilir. Korelasyon, riskinizi yarıya indirmenize yardımcı olurken, güç analizi kârınızı maksimize etmenizi sağlar. Bu gösterge, döviz gücü analizi ile döviz çiftleri korelasyonunu birleştirerek en uygun döviz çiftlerini seçmek için hibrit bir yaklaşım sunar. Döviz Gücü Analizi Nasıl Kullanılır Örneğin, işlem stratejiniz
ACB Trade Filter MT5
KEENBASE SOFTWARE SOLUTIONS
ACB Trade Filter indicator provides a way to filtering out the low probability trading entries in a trading strategy. The indicator uses a sophisticated filtration algorithm based on the market sentiment and trend. The MT4 version of the same indicator is available here ACB Trade Filter MT4 Applications Works great with our indicator ACB Breakout Arrows MT5 Filter out low probability signals from any indicator. Avoid over-trading and minimize the losses. Trade in the direction of market sentime
KT Heiken Ashi Smoothed MT4
KEENBASE SOFTWARE SOLUTIONS
KT Heiken Ashi Smoothed, standart Heiken Ashi’nin yumuşatılmış sürümüdür; ayrıca trend değişiminde al/sat okları çizer. Durum ayıdan boğaya döndüğünde alım oku çizilir. Durum boğadan ayıya döndüğünde satım oku çizilir. Mobil bildirim, e-posta, ses ve pop-up uyarıları dahildir. Heiken Ashi Smoothed tam olarak nedir? Standart Heiken Ashi’deki yalancı sinyalleri ve gürültüyü iki hareketli ortalama ile filtreleyerek fiyatı yumuşatır. Bir miktar gecikme olsa da, salınım noktalarını ve yeni oluşan t
KT Momentum Arrows MT5
KEENBASE SOFTWARE SOLUTIONS
5 (2)
KT Momentum Arrows göstergesi, belirli bir yönde meydana gelen bant sapması ve ortaya çıkan volatiliteye dayalı olarak hesaplanan ani kırılmalara dayanır. Fiyat üst banda kapanış yaparsa alış sinyali, alt banda kapanış yaparsa satış sinyali üretilir. Tek bir katsayı (Magnitude Coefficient), bant sapması ve volatilite hesaplamasını aynı anda etkiler. Bu değer, kullanılan enstrümana ve zaman dilimine göre dikkatlice seçilmelidir. Temel Özellikler Repaint yok! Momentum odaklı işlem yapanlar için
KT Auto Fibo MT5
KEENBASE SOFTWARE SOLUTIONS
5 (1)
KT Auto Fibo, mevcut trend yönüne göre Fibonacci düzeltme seviyelerini otomatik olarak çizer. En yüksek ve en düşük noktalar, grafikteki mevcut maksimum ve minimum değerler kullanılarak otomatik olarak seçilir. Fibonacci seviyelerini buna göre ayarlamak için grafiği yakınlaştırabilir, uzaklaştırabilir ve kaydırabilirsiniz. Modlar Otomatik:  Grafik alanına göre Fibonacci seviyelerini otomatik olarak çizer. Manuel: Fibonacci seviyelerini yalnızca bir kez çizer. Daha sonra, bağlantı noktalarını ma
KT Heiken Ashi Smoothed MT5
KEENBASE SOFTWARE SOLUTIONS
KT Heiken Ashi Smoothed, standart Heiken Ashi’nin yumuşatılmış sürümüdür; ayrıca trend değişiminde al/sat okları çizer. Durum ayıdan boğaya döndüğünde alım oku çizilir. Durum boğadan ayıya döndüğünde satım oku çizilir. Mobil bildirim, e-posta, ses ve pop-up uyarıları dahildir. Heiken Ashi Smoothed tam olarak nedir? Standart Heiken Ashi’deki yalancı sinyalleri ve gürültüyü iki hareketli ortalama ile filtreleyerek fiyatı yumuşatır. Bir miktar gecikme olsa da, salınım noktalarını ve yeni oluşan t
KT Psar Arrows
KEENBASE SOFTWARE SOLUTIONS
KT Psar Arrows, standart Parabolic SAR göstergesini kullanarak grafikte oklar çizer. Mumun en yüksek noktası SAR'a temas ettiğinde yükseliş oku çizilir. Mumun en düşük noktası SAR'a temas ettiğinde düşüş oku çizilir. Sinyaller, mum kapanışını beklemeden gerçek zamanlı olarak üretilir.  Özellikler Parabolic SAR göstergesini kullanan ticaret stratejilerini denemek isteyen yatırımcılar için faydalı bir araçtır.  Piyasadaki dönüş noktalarını bulmak için kullanılabilir. Özel PSAR girişlerini destekl
KT Round Numbers MT5
KEENBASE SOFTWARE SOLUTIONS
KT Round Numbers plots the round number levels which are also commonly known as psychological levels in the Forex world. In the context of Forex trading, round number levels are those levels in which there are two or more zeroes at the end. They are named as 00 levels on the chart. Some traders also consider the halfway points as a valid round number level. They are named as 50 levels on the chart. Use of round number levels in trading Round number levels work as strong support and resistance
ACB Breakout Arrows
KEENBASE SOFTWARE SOLUTIONS
4.15 (34)
ACB Breakout Arrows göstergesi, özel bir kırılma modelini tespit ederek piyasada kritik bir giriş sinyali sağlar. Gösterge, belirli bir yönde güçlenen momentumu sürekli tarar ve büyük bir hareket başlamadan hemen önce doğru giriş sinyalini verir.  Çoklu sembol ve çoklu zaman dilimi tarayıcıyı buradan edinin - ACB Breakout Arrows MT4 için Tarayıcı Temel Özellikler Gösterge, Stop Loss ve Take Profit seviyelerini otomatik olarak sağlar. Tüm zaman dilimlerinde kırılma sinyallerini takip eden MTF Ta
ACB Trade Filter MT4
KEENBASE SOFTWARE SOLUTIONS
5 (1)
The ACB Trade Filter indicator provides a solution for filtering out the low probability trading setups in a trading strategy. The indicator uses a sophisticated filtration algorithm based on the market sentiment and trend. Applications Works great with our indicator " ACB Breakout Arrows ". Filter out low probability signals from any indicator. Avoid overtrading and minimize the losses. Trade in the direction of market sentiment and trend. Avoid the choppiness in the market. How to use Only L
KT Momentum Arrows
KEENBASE SOFTWARE SOLUTIONS
KT Momentum Arrows göstergesi, belirli bir yönde meydana gelen bant sapması ve ortaya çıkan volatiliteye dayalı olarak hesaplanan ani kırılmalara dayanır. Fiyat üst banda kapanış yaparsa alış sinyali, alt banda kapanış yaparsa satış sinyali üretilir. Tek bir katsayı (Magnitude Coefficient), bant sapması ve volatilite hesaplamasını aynı anda etkiler. Bu değer, kullanılan enstrümana ve zaman dilimine göre dikkatlice seçilmelidir. Temel Özellikler Repaint yok! Momentum odaklı işlem yapanlar için
KT COG Advanced MT4
KEENBASE SOFTWARE SOLUTIONS
1 (1)
KT COG is an advanced implementation of the center of gravity indicator presented by John F. Ehlers in the May 2002 edition of Technical Analysis of Stocks & Commodities magazine. It's a leading indicator which can be used to identify the potential reversal points with the minimum lag. The COG oscillator catches the price swings quite effectively. MT5 version of the same indicator is available here KT COG Advanced MT5 Calculation of COG The COG indicator is consist of the two lines. The main l
KT Pin Bar
KEENBASE SOFTWARE SOLUTIONS
KT Pin Bar identifies the pin bar formation which is a type of price action pattern which depicts a sign of reversal or rejection of the trend. When combined with support and resistance, BRN and other significant levels, Pin Bar pattern proved to be a very strong sign of reversal. Basically, a pin bar is characterized by a small body relative to the bar length which is closed either in upper or lower 50% part of its length. They have very large wicks and small candle body. A pin bar candlestic
KT Trend Magic
KEENBASE SOFTWARE SOLUTIONS
KT Trend Magic shows the trend depiction on chart using the combination of market momentum and volatility. A smoothing coefficient is used to smooth out the noise from the signal.It can be used to find out the new entries or confirm the trades produced by other EA/Indicators. Usage Drag n drop MTF scanner which scans for the new signals across multiple time-frames. Find new entries in the trend direction. Improve the accuracy of other indicators when used in conjunction. Can be used as a dynami
KT Auto Fibo
KEENBASE SOFTWARE SOLUTIONS
KT Auto Fibo, mevcut trend yönüne göre Fibonacci düzeltme seviyelerini otomatik olarak çizer. En yüksek ve en düşük noktalar, grafikteki mevcut maksimum ve minimum değerler kullanılarak otomatik olarak seçilir. Fibonacci seviyelerini buna göre ayarlamak için grafiği yakınlaştırabilir, uzaklaştırabilir ve kaydırabilirsiniz. Modlar Otomatik:  Grafik alanına göre Fibonacci seviyelerini otomatik olarak çizer. Manuel: Fibonacci seviyelerini yalnızca bir kez çizer. Daha sonra, bağlantı noktalarını ma
KT Ichimoku Trader
KEENBASE SOFTWARE SOLUTIONS
1 (1)
KT Ichimoku Trader is a fully automated expert advisor that offers five popular trading strategies based on the Ichimoku indicator. Each strategy has it's own entry and exit method without any interference to other strategies. The Ichimoku system can be applied to all major currency pairs and metals. However, we found that it performs reasonably well mainly on two pairs.   MT5 Version is available here  https://www.mql5.com/en/market/product/35043 Features Trade up to 5 famous trading strategi
KT Volatility Oscillator
KEENBASE SOFTWARE SOLUTIONS
KT Volatilite Osilatörü, geçmiş ve mevcut piyasa verilerini matematiksel bir formül kullanarak analiz eder ve sonucu bir osilatör formunda gösterir. Yükselen ve azalan dalgalar, varlığın yüksek ve düşük volatilitesine karşılık gelir.  Kısaca, volatilite bir varlığın belirli bir zaman diliminde fiyat dalgalanmalarının ölçüsüdür. Volatilite olmasaydı, piyasada çok az hareket olurdu ve traderlar fiyat değişimlerinden kazanç sağlayamazdı. Forex Piyasasında Volatilite Kullanımı Forex piyasasında vol
KT COG Robot
KEENBASE SOFTWARE SOLUTIONS
KT COG Robot is a fully automated Expert Advisor based on the KT COG Indicator . The COG indicator was originally presented by John F. Ehlers in the May 2002 edition of Technical Analysis of Stocks & Commodities magazine. The EA fires a long trade when COG line cross above the signal line and a short trade is fired when the COG line cross below the signal line.  Adaptive Filtration Our adaptive filtration algorithm combines the original COG formula with the major trend direction and market acce
ACB Breakout Arrows EA
KEENBASE SOFTWARE SOLUTIONS
Bu, özel olarak geliştirdiğimiz "ACB Breakout Arrows" adlı göstergemize dayalı %100 otomatik bir uzman danışmandır. Girişler, iki yönlü olarak sık sık oluşan bir kırılma modeline dayanır. Giriş sinyallerinin şiddeti, "Signal Sensitivity" adlı harici girişle ayarlanabilir. İşlem Onayı ACB Breakout Arrows EA, başka bir özel göstergemiz olan ACB Trade Filter kullanılarak girişleri filtreleme yeteneği sunar. Güçlü Al: Yukarı ok + Yeşil histogram + Yükseliş trendi Güçlü Sat: Aşağı ok + Kırmızı hist
KT Asian Breakout
KEENBASE SOFTWARE SOLUTIONS
4 (1)
KT Asian Breakout carefully analyzes the range-bound market during the Asian session and then fires a long or short trade after doing some preassessment based on its inbuilt technical analysis module. The executed orders are closed within a day before the completion of the next day session. The inbuilt technical analysis module checks for the session range and compares it with the last 20 days price movement. If it finds any erratic price movement within the session, the orders are not executed
KT London Breakout
KEENBASE SOFTWARE SOLUTIONS
First thirty minutes are essential for a trading session. The early reaction of traders and market players sets a path for the rest of the day. KT London Breakout EA takes advantage of this phenomenon, and after analyzing the first thirty minutes of London session, it places two bidirectional pending orders. One of pending order is eventually canceled after realizing the market direction with certainty. It has been strictly tested and developed for EUR/JPY using 30-Min Time Frame. You can expe
MACD Divergence Seeker
KEENBASE SOFTWARE SOLUTIONS
KT MACD Divergence Seeker trades the regular and hidden divergence signals generated by our free indicator named KT MACD Divergence indicator. Trading the standalone divergences can be a risky affair that's why the KT MACD Divergence Seeker combines the standard divergence signals with an advanced analysis module to exploit the price inefficiencies on some FX pairs. What is the Divergence exactly? As a general conception if the price is making higher highs, then macd should also be making hig
KT Asian Breakout Indicator
KEENBASE SOFTWARE SOLUTIONS
KT Asian Breakout göstergesi, Asya seansının kritik bir bölümünü analiz ederek fiyatın kırılma yönüne göre çift yönlü alım ve satım sinyalleri üretir. Fiyat seansın en yüksek seviyesini kırarsa alım sinyali oluşur, en düşük seviyesini kırarsa satış sinyali oluşur. Dikkat Edilmesi Gerekenler Eğer seans kutusu dikey olarak çok genişse, yeni bir işlemden kaçınılmalıdır çünkü fiyat hareketlerinin büyük bir kısmı zaten bu kutu içinde gerçekleşmiştir. Eğer kırılma mumu çok büyükse, fiyat genellikle s
MACD Divergence MT4
KEENBASE SOFTWARE SOLUTIONS
KT MACD Divergence, fiyat ile osilatör arasında oluşan düzenli ve gizli uyumsuzlukları gösterir. Eğer ticaret stratejinizde trend dönüşü bekleniyorsa, potansiyel dönüş noktalarını belirlemek için MACD’nin düzenli uyumsuzluğunu kullanabilirsiniz. Trendin devamına dayalı stratejilerde ise MACD’nin gizli uyumsuzluğu daha uygun bir tercih olacaktır. KT MACD Divergence'nın Sınırlamaları MACD uyumsuzluğunu tek başına giriş sinyali olarak kullanmak riskli olabilir. Her uyumsuzluk mutlaka bir trend dö
KT Bollinger Bands Trader MT4
KEENBASE SOFTWARE SOLUTIONS
KT Bollinger Bands Trader, düşük volatilite dönemlerinde Bollinger Bantlarını kullanarak ortalamaya dönüş stratejisi uygulayan %100 otomatik bir uzman danışmandır (Expert Advisor). Fiyat genellikle Bollinger Bantlarının üst veya alt çizgisine tepki verir, ancak her zaman bir dönüş gerçekleşmez. Bununla birlikte, düşük volatilite dönemlerinde fiyat dönüşü olasılığı daha yüksektir. Girişler Fiyat Bollinger Bantlarının alt çizgisinin altına doğru şekilde hizalandığında alış işlemi başlatılır. Fiya
KT CCI Divergence MT4
KEENBASE SOFTWARE SOLUTIONS
KT CCI Divergence shows the regular and hidden divergence created between the price and CCI oscillator. Divergence is one of the vital signals that depicts the upcoming price reversal in the market. Manually spotting the divergence between price and CCI can be a hectic and ambiguous task. Limitations of KT CCI Divergence   Using the CCI divergence as a standalone entry signal can be risky. Every divergence can't be interpreted as a strong reversal signal. For better results, try to combine it w
KT MA Crossover MT4
KEENBASE SOFTWARE SOLUTIONS
KT MA Crossover, seçilen hareketli ortalamaların kesişimine göre alım ve satım oklarını çizer. Ayrıca her ardışık sinyal için uygun uyarıları üretir ve MFE (En Avantajlı Sapma) değerini görüntüler. Hareketli ortalama kesişimi, dünya çapında trader'lar tarafından yaygın olarak kullanılan temel stratejilerden biridir. Genellikle biri hızlı, diğeri yavaş olmak üzere iki hareketli ortalamadan oluşur ve kesişim yönüne göre alım ya da satım sinyali üretir. Alım sinyali – hızlı MA, yavaş MA'nın üzerin
Filtrele:
Değerlendirme yok
Değerlendirmeye yanıt