KT Bulls Bears MT4

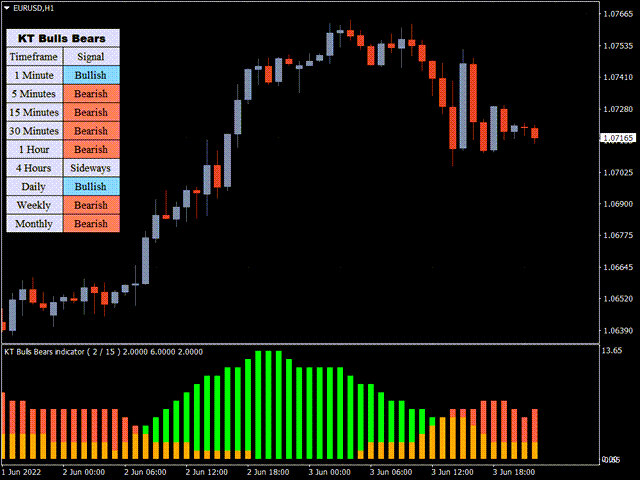
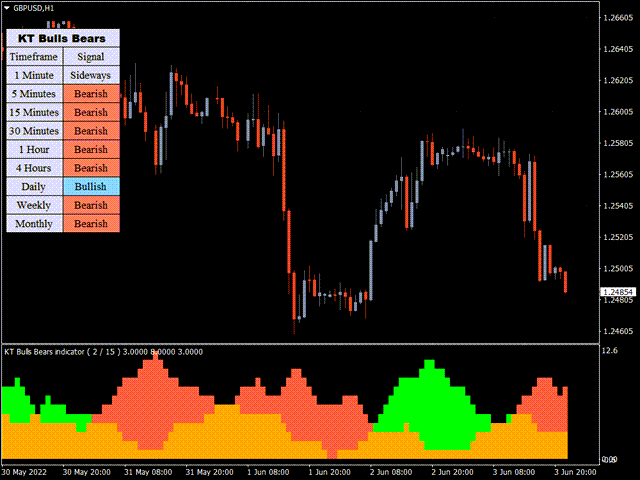
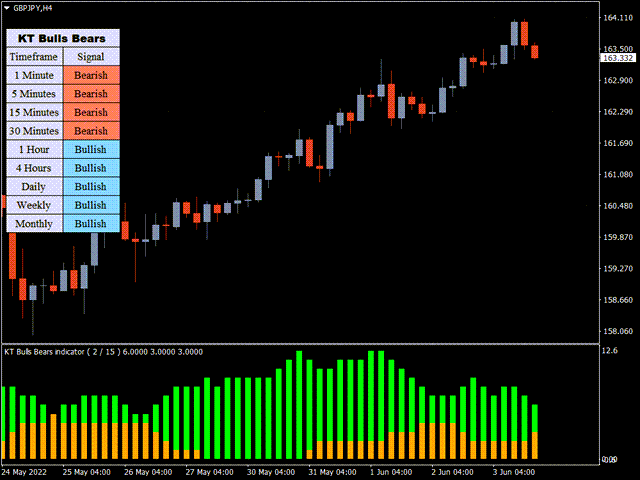
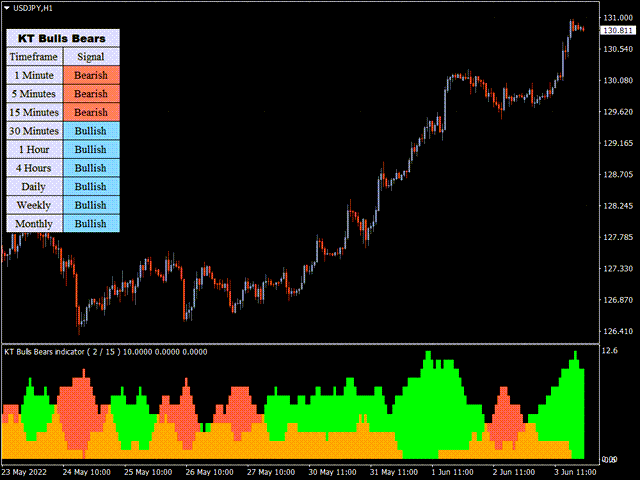
Este indicador mostra o regime altista/baixista do mercado com base no número de barras que se movem acima e abaixo das regiões de sobrecompra/sobrevenda do RSI. O histograma verde representa a força dos touros, enquanto o vermelho representa a força dos ursos.

Características

  • Pode ser utilizado para abrir novas operações ou validar operações de outras estratégias ou indicadores.
  • Inclui um scanner multi-timeframe que analisa a força dos touros e ursos em todos os períodos de tempo.
  • É uma excelente ferramenta para aumentar a confiança dos traders iniciantes, ajudando-os a validar suas entradas com a força altista/baixista.
  • Inclui todos os alertas padrão do MetaTrader.

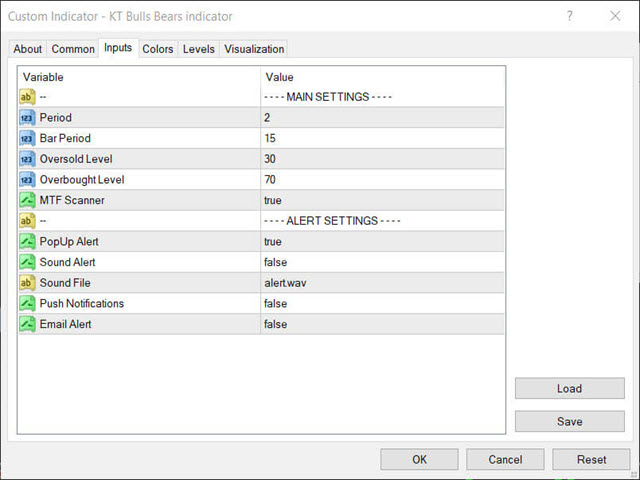
Parâmetros de Entrada

  • Período: Período do RSI utilizado para identificar os níveis de sobrecompra/sobrevenda.
  • Período de Barras: Número de barras consideradas acima/abaixo dos níveis de sobrecompra/sobrevenda do RSI.
  • Nível de Sobrevenda: Nível do RSI para definir a zona de sobrevenda. 
  • Nível de Sobrecompra: Nível do RSI para definir a zona de sobrecompra. 
  • Scanner MTF: Scanner de múltiplos períodos para obter sinais de todos os timeframes disponíveis. 
  • Configurações de Alerta
Produtos recomendados
TMoney OrderblockDay
Moises Orlando Urbina Sojo
The indicator is triggered at the start of each trading day and detects both bullish and bearish ORDERBLOCK potentials. These levels are of high operational probability, being able to use a minimum ratio of 3 to 1 to maximize profits. It is recommended to use TimeFrame M5 to M30 for a proper display and consider pending orders at the OB levels of the chart and place the SL up to a maximum of 20 pips from the entry price. Submit the indicator to Backtesting to become familiar with its performan
KT Price Border MT4
KEENBASE SOFTWARE SOLUTIONS
O KT Price Border cria um canal de preços de três bandas que identifica possíveis áreas de máximos e mínimos no mercado. Esses níveis também podem ser usados como suporte e resistência dinâmicos. A banda do meio também pode ser usada para identificar a direção da tendência, funcionando assim como um indicador seguidor de tendências. Além disso, sua facilidade de uso e a simplicidade na interpretação dos sinais de negociação são especialmente benéficas para traders iniciantes. Características F
Este indicador é um indicador para análise automática de ondas que é perfeito para negociações práticas! Caso... Nota:   Não estou acostumado a usar nomes ocidentais para classificação de ondas. Devido à influência da convenção de nomenclatura de Tang Lun (Tang Zhong Shuo Zen), nomeei a onda básica como   uma caneta   e a banda de onda secundária como   um segmento   . ao mesmo tempo, o segmento tem a direção da tendência.   O segmento de tendência principal   é nomeado (esse método de nomencl
The Strong Volume Trend  MT4 indicator is a powerful tool designed to help traders identify and capitalize on significant volume trends in the financial markets. With its advanced algorithm, this indicator accurately detects the strength and direction of volume movements, allowing traders to make informed trading decisions. Features: Volume Strength Analysis: The indicator analyzes the volume data and identifies strong volume trends, helping traders spot potential market reversals, breakouts, or
KT Bullish Bearish MT4
KEENBASE SOFTWARE SOLUTIONS
KT Bullish Bearish shows the bullish/bearish regime of the market in the form of a colored histogram representing both of the market states alternately. Bull Market (Blue Histogram): A bull market indicates an uptrend when an instrument price rises over a continued period like days, months, or years. Bear Market (Red Histogram): A bear market indicates a downtrend when an instrument price rises over a continued period like days, months, or years. Applications It prevents trading against the big
This indicator is designed to find the difference in MACD price and indicator.  This indicator shows the price and indicator difference on the screen. The user is alerted with the alert sending feature. Our Popular Products Super Oscillator HC Cross Signal Super Cross Trend Strong Trend Super Signal Parameters divergenceDepth -  Depth of 2nd ref. point search Fast ema -  Fast ema setting Slow ema - slow ema setting MACD sma - macd sma setting indAppliedPrice -  Applied price of indicator indMAM
My Point MT4
Claudia Ramona Angerer
4 (1)
Diagnosis of major and minor pivot Trend detection with many signals Can be used in all symbols Can be used in all time frames Settings: Back Show: The number of candles it displays If you need any adjustments, or have any questions or suggestions, message me How to trade: Blue: sell signal Red: buy signal Blue and red at the same time: no signal Exit signal: Opposite signal
O Stochastic Divergence Multicurrency Scanner MT4 é um indicador de ponta projetado especificamente para MetaTrader 4, permitindo que os traders identifiquem de forma eficiente sinais de divergência Stochastic de alta e baixa em uma ampla variedade de pares de moedas e prazos. Esta ferramenta é perfeita para traders que buscam aprimorar sua análise de mercado e tomar decisões informadas sem a necessidade de monitoramento manual constante. Com suas capacidades de varredura em tempo real e um pain
To access the TD sequential Scanner for MT5, please check https://www.mql5.com/en/market/product/123369?source=Site +Market+My+Products+Page. One of the MT5 versions includes additional timeframes such as M1, M2, M3,H2,H6,H8 and so on.( https://www.mql5.com/en/market/product/123367?source=Site +Market+My+Products+Page) TD Sequential Scanner: An Overview The TD Sequential scanner is a powerful technical analysis tool designed to identify potential price exhaustion points and trend reversals in fi
This indicator is designed to find the difference in RSI price and indicator.  This indicator shows the price and indicator difference on the screen. The user is alerted with the alert sending feature. Our Popular Products Super Oscillator HC Cross Signal Super Cross Trend Strong Trend Super Signal Parameters divergenceDepth -   Depth of 2nd ref. point search RSI_Period -   Second calculation period indAppliedPrice -   Applied price of indicator indMAMethod -   MA calculation method findExtInte
Este indicador traça até 6 níveis que podem ser ativados / desativados para tornar o gráfico mais limpo conforme a exigência do trader Estes 6 níveis estão em 2 conjuntos: Alto e Baixo Para cada conjunto, um período de tempo diferente pode ser selecionado É baseado na estratégia de reversão de alta baixa anterior, pois considera-se que o preço geralmente mostra rejeição em prazos menores, como 5 minutos, quando o preço atinge a alta diária, semanal ou mensal. Recursos : - Acompanhe até 6 p
KT DMA is a modified and advanced version of the classic Displaced Moving Averages with buy/sell crossover alerts and a Multi-Timeframe scanner that shows DMA's direction across each real-time time frame. A Displaced Moving Average is a simple moving average that moves ahead or backward in a time frame (either short-term or long-term). It also allows you to predict price movement more accurately. Features Depicts the trend direction using the alignment of three moving averages. Buy/Sell signals
KT Tether Line MT4
KEENBASE SOFTWARE SOLUTIONS
The KT Tether Line is a trend-following tool consisting of three indicators that work together to generate trading signals. It can correctly identify market trends while signaling trade entries. It was first introduced by Bryan Strain in the Stock & Commodities magazine in 2000 in "How to get with the trend and out at the end." The Concept When a market trend is confirmed, the most challenging part is determining the timing of the entries. This indicator alerts you to potential trend reversals
Trend Waves indicator is a trend indicator that uses Average True Range and Standard Deviation indications. It is aimed to find more healthy trends with this indicator. This indicator can be used alone as a trend indicator. Detailed review 4 different trend colors appear on this indicator.  The aqua color represents the rising trend. Dark aqua color means the train is getting weaker. pink color represents the downtrend trend. The dark pink color  means the trend is weaker. Parameters Stdeviatio
KT Market Speed MT4
KEENBASE SOFTWARE SOLUTIONS
The KT Market Speed is a unique and straightforward oscillator-based technical analysis tool that helps traders visualize the speed at which the price of an instrument changes based on the preset length. The Market Speed representation helps correctly map the price momentum: is it moving fast, slowing down, or trapped in a range? These are the questions the indicator answers, giving traders more bandwidth to execute better-informed trade positions. Formula It's a simple technical analysis tool
Apresentando o   Bollinger Band Volume Breakout Detector   , um poderoso indicador técnico projetado para aprimorar a popular   Bollinger Band Breakout Strategy   . Este indicador leva o acompanhamento de tendências para o próximo nível, incorporando dados de volume, minimizando efetivamente os sinais falsos. Ao aderir ao princípio de "o volume confirma o preço", esta ferramenta permite que os traders identifiquem quebras de preço acompanhadas de aumentos significativos no volume, garantindo dec
O       Scanner de Breakout Parabólico Pro       é um       ferramenta abrangente de análise de mercado       projetado para       monitorar vários pares de moedas e prazos simultaneamente       usando       Detecção de rompimento de SAR parabólico   . Este indicador       escaneia continuamente       através de vários       instrumentos de negociação       e       horizontes de tempo   , identificando       potenciais padrões de fuga       e fornecer aos comerciantes uma       painel centraliz
PTW NON REPAINT TRADING SYSTEM + HISTOGRAM Non-Repainting ,   Non-Redrawing   and   Non-Lagging  Trading System. Does the following: - Gives Accurate Entry and Exit Points - Scalping, Day and Swing Trading  - 95% Accuracy  - Targets, where to take profits. - Shows Trends, Support and resistance levels - Works on All Brokers - Works on All Currencies, CFDs and Stocks - It does not place trades for you, it only shows you what trades to place. - It works on All Timeframes - It is for Trend or ran
KT Top G MT4
KEENBASE SOFTWARE SOLUTIONS
O KT Top G é um indicador baseado em ação do preço que combina análise inteligente de canais para identificar possíveis topos e fundos do mercado. Quando uma possível reversão é detectada, ele exibe setas grandes e claras no gráfico, oferecendo um alerta antecipado antes da virada do mercado. Setas Grandes: Destacam topos e fundos de alta probabilidade ao detectar exaustão do preço e mudança de momentum. Setas Pequenas: Indicam pontos de reversão com menor probabilidade, que frequentemente são r
The Average True Range (ATR) is a tool to measure volatility. ATR MTF (Multi Time Frame) indicator provides all timeframe trends helps to identify in which kind of volatility environment the market .This indicator can be used with any Trading Systems for additional confirmation of trading entries or exits. It is a very helpful tool to calculate Targets and Stops according the current market conditions.
Four rsi mt4
Vincent Albert Feugier
Multi-RSI – 4 RSIs in 1 for Complete Market Analysis Analyze market strength and momentum like a pro! Multi-RSI combines 4 distinct RSIs in a single window , giving you a clear and fast view of market momentum across multiple timeframes. Each RSI has its own configurable period , allowing you to adapt the indicator to your trading strategies and style. Key Features: 4 RSIs in one indicator – track multiple periods simultaneously. ️ Fully customizable periods – adjust each RSI individ
Rira VWAP Bands
Vitor Palmeira Abbehusen
VWAP Bands gives you the regular Volume-Weighted Average Price and also the deviation bands. Use this indicator to see the possible amount of market movement, find support and resistance lines, find good spots for entry and exit,  and the most important feature is to find possible pivot points. This indicator has been mathematically improved by Rira team. The calculation begins at the start of each trading day
Detailed blog post with screenshots here: https://www.mql5.com/en/blogs/post/762513 Features: This scanner will show: NRTR Basket Trading Trend direction Last NRTR Switch (breakout) - number of bars and if it was a high volume bar How many bars has the SR stayed steady for When price last entered an NRTR shadow When price bounced off the NRTR shadow back inside NRTR Explained: https://www.mql5.com/en/blogs/post/762509 Basket Trading If you like to basket trade, then you can set multiple scann
It could help to calculate Risk-Reward easily before placing a BUY-SELL position. TradeSizeCalculator is a Multi-Tasking Calculator. It will calculate the others when we define the value in one of the columns. Stoploss, risk percentage, risk-money, lot size, take-profit , reward-money, and reward-ratio. Depending on which value is changed. All values in the columns are editable. Also, we can get those calculation results by drag-drop the stop-loss/take-profit line. Parameter: The inputs below ar
QuantumAlert Stoch Navigator is a free indicator available for MT4/MT5 platforms, its work is to provide "alerts" when the market is inside "overbought and oversold" regions in the form of "buy or sell" signals. This indicator comes with many customization options mentioned in the parameter section below, user can customise these parameters as needful. Join our   MQL5 group , where we share important news and updates. You are also welcome to join our private channel as well, contact me for the p
FREE
Similar to logic used in: Golden MA MTF TT   Overview "Golden MA" indicator for OB/OS levels. It's based on High/Lows of higher timeframe (HTF) previous bar. Only useful in swing trading or scalping. Best for at least M15+. For lower timeframes you'll need to change StartPips to lower value to get consistent lines. Because lower timeframes will have smaller pip distances.   Features - Define Higher Timeframes for Current Timeframe: Use a comma-separated list to define the higher timeframe for th
FREE
About Scanner: It will show you the Higher/Lower Highs and Lows of zigzag price. Use it to keep track of best ongoing trends and price ranges. Detailed blog post: https://www.mql5.com/en/blogs/post/750232 Symbols: HH: Higher Highs HL: Higher Lows When price makes higher and higher Highs or higher Lows: It will count Zigzag in reverse and find total number of last "Higher Highs" and "Higher Lows" or "Lower Lows" and "Lower Highs". LL: Lower Lows LH: Lower Highs How to Use: Suppose price is
Este indicador multi-quadro de tempo e multi-símbolo identifica topo / fundo duplo, cabeça       E       ombros, flâmula / triângulo e padrões de bandeira. Também é possível configurar alertas apenas quando uma ruptura do decote / triângulo / mastro tiver ocorrido (ruptura do decote = sinal confirmado para parte superior / inferior e cabeça e ombros).   O indicador também pode ser usado no modo de gráfico único. Por favor, leia mais sobre esta opção no produto   blog .       Combinado com suas p
MT Scanner
Niravkumar Maganbhai Patel
4 (2)
This indicator helps you to Scan symbols which are in the Market Watch Window  and filter out trends with alerts. It works based on the effective indicator "SUPERTREND" which is used by many traders for trading: When box color changes to " Green " or " Red " color, it indicates you for trend change for long and short entry. And also you will get alerted on screen. When it changes to " Green ", it indicates you that trend is going upwards, and you can take the long entry. If the color changes to
FREE
Signal Arrows is an indicator that generates trade arrows. It generates trade arrows with its own algorithm. These arrows give buying and selling signals.  Can be used in all pairs. Sends a signal to the user with the alert feature. The indicator certainly does not repaint. Trade rules Enter the signal when the buy signal arrives. In order to exit from the transaction, an opposite signal must be received. It is absolutely necessary to close the operation when an opposite signal is received. The
Os compradores deste produto também adquirem
Gann Made Easy
Oleg Rodin
4.83 (157)
Gann Made Easy é um sistema de negociação Forex profissional e fácil de usar, baseado nos melhores princípios de negociação usando a teoria do sr. W. D. Gann. O indicador fornece sinais precisos de COMPRA e VENDA, incluindo níveis de Stop Loss e Take Profit. Você pode negociar mesmo em movimento usando notificações PUSH. Entre em contato comigo após a compra para receber instruções de negociação e ótimos indicadores extras gratuitamente! Provavelmente você já ouviu muitas vezes sobre os métodos
O indicador " Dynamic Scalper System " foi desenvolvido para o método de scalping, operando dentro de ondas de tendência. Testado nos principais pares de moedas e ouro, é possível a compatibilidade com outros instrumentos de negociação. Fornece sinais para a abertura de posições de curto prazo ao longo da tendência, com suporte adicional para o movimento dos preços. O princípio do indicador: As setas grandes determinam a direção da tendência. Um algoritmo para gerar sinais de scalping sob a fo
M1 Sniper
Oleg Rodin
5 (20)
O M1 SNIPER é um sistema indicador de negociação fácil de usar. É um indicador de seta projetado para o período M1. O indicador pode ser usado como um sistema independente para scalping no período M1 e pode ser usado como parte do seu sistema de negociação existente. Embora este sistema de negociação tenha sido projetado especificamente para negociação no M1, ele também pode ser usado em outros períodos. Originalmente, desenvolvi este método para negociar XAUUSD e BTCUSD. Mas considero-o útil ta
Atomic Analyst
Issam Kassas
5 (4)
Primeiramente, vale ressaltar que este Indicador de Negociação não repinta, não redesenha e não apresenta atrasos, tornando-o ideal tanto para negociação manual quanto automatizada. Manual do utilizador: configurações, entradas e estratégia. O Analista Atômico é um Indicador de Ação de Preço PA que utiliza a força e o momentum do preço para encontrar uma vantagem melhor no mercado. Equipado com filtros avançados que ajudam a remover ruídos e sinais falsos, e aumentam o potencial de negociação.
Scalper Inside PRO
Alexey Minkov
4.74 (69)
An exclusive indicator that utilizes an innovative algorithm to swiftly and accurately determine the market trend. The indicator automatically calculates opening, closing, and profit levels, providing detailed trading statistics. With these features, you can choose the most appropriate trading instrument for the current market conditions. Additionally, you can easily integrate your own arrow indicators into Scalper Inside Pro to quickly evaluate their statistics and profitability. Scalper Inside
Trend Lines PRO
Roman Podpora
5 (1)
LINHAS DE TENDÊNCIA PRO       Ajuda a entender onde o mercado está realmente mudando de direção. O indicador mostra inversões de tendência reais e pontos onde os principais participantes retornam ao mercado. Você vê     Linhas BOS     Análise de tendências e níveis-chave em prazos maiores — sem configurações complexas ou ruídos desnecessários. Os sinais não são repintados e permanecem no gráfico após o fechamento da barra. VERSÃO MT 5      -      Revela seu potencial máximo quando emparelhada co
Volatility Trend System - um sistema de negociação que dá sinais para entradas. O sistema de volatilidade fornece sinais lineares e pontuais na direção da tendência, bem como sinais para sair dela, sem redesenho e atrasos. O indicador de tendência monitora a direção da tendência de médio prazo, mostra a direção e sua mudança. O indicador de sinal é baseado em mudanças na volatilidade e mostra entradas no mercado. O indicador está equipado com vários tipos de alertas. Pode ser aplicado a vários i
Trend indicator AI
Ramil Minniakhmetov
4.49 (84)
O indicador Trend Ai é uma ótima ferramenta que irá melhorar a análise de mercado de um trader, combinando a identificação de tendências com pontos de entrada acionáveis e alertas de reversão. Este indicador permite que os usuários naveguem pelas complexidades do mercado forex com confiança e precisão Além dos sinais primários, o indicador Trend Ai identifica pontos de entrada secundários que surgem durante retrações ou retrações, permitindo que os comerciantes capitalizem as correções de preço
Antes de tudo, vale ressaltar que esta Ferramenta de Negociação é um Indicador Não Repintante, Não Redesenhante e Não Atrasado, o que a torna ideal para negociação profissional. Curso online, manual do utilizador e demonstração. O Indicador de Conceitos de Ação de Preço Inteligente é uma ferramenta muito poderosa tanto para traders novos quanto experientes. Ele combina mais de 20 indicadores úteis em um único, combinando ideias avançadas de negociação como Análise do Trader do Círculo Interno e
Um indicador técnico que estrutura gráficos e identifica movimentos cíclicos de preços. Pode funcionar em qualquer gráfico. Vários tipos de notificações. Existem setas adicionais no próprio gráfico. Sem redesenhar a história, trabalha no fecho da vela. TF recomendado a partir de M5 e superior. Parâmetros fáceis de utilizar e configurar. Ao utilizar 2 indicadores com parâmetros diferentes, pode utilizá-los sem outros indicadores. Tem 2 parâmetros de entrada Ciclicidade e duração do sinal Estes
Auto Optimized Parabolic RSI: Avançado Motor de Momentum 3D A maioria dos indicadores de varejo falha porque depende de parâmetros estáticos que quebram no momento em que a volatilidade do mercado muda. O Auto Optimized Parabolic RSI resolve o problema de "obsolescência do indicador" recalculando continuamente a sua própria vantagem matemática, trazendo uma adaptação quantitativa de nível institucional diretamente para o seu terminal MT5. A Vantagem Principal: Otimização 3D em Memória Personaliz
RFI levels PRO
Roman Podpora
5 (1)
O indicador mostra com precisão os pontos de reversão e as zonas de retorno de preço onde o   Principais players . Você identifica onde novas tendências estão se formando e toma decisões com máxima precisão, mantendo o controle sobre cada negociação. VERSION MT5     -     Revela seu potencial máximo quando combinado com o indicador   TREND LINES PRO. O que o indicador mostra: Estruturas de reversão e níveis de reversão com ativação no início de uma nova tendência. Exibição dos níveis de   TAKE
Currency Strength Exotics
Bernhard Schweigert
4.88 (33)
ACTUALMENTE 20% DE DESCONTO ! A melhor solução para qualquer novato ou comerciante especializado! Este Indicador é especializado para mostrar a força da moeda para quaisquer símbolos como Pares Exóticos de Commodities, Índices ou Futuros. É o primeiro do seu género, qualquer símbolo pode ser adicionado à 9ª linha para mostrar a verdadeira força da moeda de Ouro, Prata, Petróleo, DAX, US30, MXN, TRY, CNH etc. Esta é uma ferramenta de negociação única, de alta qualidade e acessível, porque inco
Dynamic Forex28 Navigator
Bernhard Schweigert
4.43 (7)
Dynamic Forex28 Navigator - A ferramenta de negociação Forex de última geração. ATUALMENTE 49% DE DESCONTO. Dynamic Forex28 Navigator é a evolução dos nossos indicadores populares de longa data, combinando o poder de três em um: Indicador Advanced Currency Strength28 (695 avaliações) + Advanced Currency IMPULSE com ALERTA (520 avaliações) + Sinais CS28 Combo (Bônus). Detalhes sobre o indicador https://www.mql5.com/en/blogs/post/758844 O que o Next-Generation Strength Indicator oferece?  Tudo
Se você comprar este indicador, receberá meu Gerenciador de Operações Profissional   + EA  GRATUITAMENTE. Primeiramente, vale ressaltar que este Sistema de Trading é um Indicador Não Repintado, Não Redesenho e Não Atrasado, o que o torna ideal tanto para o trading manual quanto para o automatizado. Curso online, manual e download de predefinições. O "Sistema de Trading Inteligente MT5" é uma solução completa de trading projetada para traders novos e experientes. Ele combina mais de 10 indicador
Advanced Supply Demand
Bernhard Schweigert
4.91 (299)
Atualmente com 40% de desconto! A melhor solução para qualquer Trader Novato ou especialista! Este indicador é uma ferramenta de negociação exclusiva, de alta qualidade e acessível porque incorporamos uma série de recursos proprietários e uma nova fórmula. Com esta atualização, você poderá mostrar fusos horários duplos. Você não só será capaz de mostrar um TF mais alto, mas também mostrar ambos, o TF do gráfico, MAIS o TF mais alto: MOSTRANDO ZONAS ANINHADAS. Todos os traders de Oferta e Demanda
The Super Arrow Indicator provides non-repainting buy and sell signals with exceptional accuracy. Key Features No repainting – confirmed signals remain fixed Clear visual arrows: green for buy, red for sell Real-time alerts via pop-up, sound, and optional email Clean chart view with no unnecessary clutter Works on all markets: Forex, gold, oil, indices, crypto Adjustable Parameters TimeFrame Default: "current time frame" Function: Sets the time frame for indicator calculation Options: Can be set
Currency Strength Wizard é um indicador muito poderoso que fornece uma solução completa para uma negociação bem-sucedida. O indicador calcula o poder deste ou daquele par forex usando os dados de todas as moedas em vários intervalos de tempo. Esses dados são representados em uma forma de índice de moeda fácil de usar e linhas de energia de moeda que você pode usar para ver o poder desta ou daquela moeda. Tudo o que você precisa é anexar o indicador ao gráfico que deseja negociar e o indicador mo
Scalping Entry Points - é um sistema de negociação manual que pode se ajustar aos movimentos de preços e dar sinais para abrir negociações sem redesenhar. O indicador determina a direção da tendência pelo nível central de suporte e resistência. O indicador de ponto fornece sinais para entradas e saídas. Adequado para negociação intradiária manual, escalpelamento e opções binárias. Funciona em todos os prazos e instrumentos de negociação. O indicador dá vários tipos de alertas. Como usar o produ
Adaptive Volatility Range [AVR] is a powerful tool for identifying key trend reversal points. AVR accurately reflects the Average True Range (ATR) of volatility, taking into account the Volume-Weighted Average Price (VWAP). The indicator adapts to any market volatility by calculating the average volatility over a specific period, ensuring a stable rate of profitable trades. You receive not just an indicator but a professional automated trading system , AVR-EA . Advantages: Automated Trading Sys
TPSpro RFI Levels
Roman Podpora
4.86 (28)
INSTRUÇÕES RUS  /  INSTRUÇÕES   ENG  /  Versão MT5 Principais funções: Exibe zonas ativas de vendedores e compradores! O indicador exibe todos os níveis/zonas de impulso iniciais corretos para compras e vendas. Quando esses níveis/zonas são ativados, onde a busca por pontos de entrada começa, os níveis mudam de cor e são preenchidos com cores específicas. Setas também aparecem para uma percepção mais intuitiva da situação. LOGIC AI - Exibição de zonas (círculos) para busca de pontos de entrada
BTMM State Engine Pro is a MetaTrader 4 indicator for traders who use the Beat The Market Maker approach: Asian session context, kill zone timing, level progression, peak formation detection, and a multi-pair scanner from a single chart. It combines cycle state logic with a built-in scanner dashboard so you do not need the same tool on many charts at once. What it does Draws the Asian session range; session times can follow broker server offset or be set in inputs. Tracks level progression (L
TrendLine PRO MT4
Evgenii Aksenov
4.83 (167)
The Trend Line PRO indicator is an independent trading strategy. It shows the trend change, the entry point to the transaction, as well as automatically calculates three levels of Take Profit and Stop Loss protection. Trend Line PRO is perfect for all Meta Trader symbols: currencies, metals, cryptocurrencies, stocks and indices. The indicator is used in trading on real accounts, which confirms the reliability of the strategy. Robots using   Trend Line PRO   and real Signals can be found here:   
Looking for a powerful yet lightweight swing detector that accurately identifies market structure turning points? Want clear, reliable buy and sell signals that work across any timeframe and any instrument? Buy Sell Arrow MT Swing is built exactly for that — precision swing detection made simple and effective. This indicator identifies Higher Highs (HH) , Higher Lows (HL) , Lower Highs (LH) , and Lower Lows (LL) with remarkable clarity. It is designed to help traders easily visualize market stru
Torne-se um Negociador Breaker e lucre com as mudanças na estrutura do mercado à medida que o preço reverte. O indicador de quebra de bloco de pedidos identifica quando uma tendência ou movimento de preço está chegando à exaustão e pronto para reverter. Ele o alerta sobre mudanças na estrutura do mercado, que normalmente ocorrem quando uma reversão ou uma grande retração está prestes a ocorrer. O indicador usa um cálculo proprietário que identifica rupturas e momento do preço. Toda vez que um
CyberZingFx Volume Plus
Afsal Meerankutty
4.94 (17)
Advanced version of CyberZingFx Volume Plus, the ultimate MT4 indicator for traders seeking highly accurate buy and sell signals. With an additional strategy and price action dot signals that enhances its effectiveness, this indicator offers a superior trading experience for professionals and beginners alike. The CyberZingFx Volume Plus Advanced version combines the power of volume analysis and historical price data with an additional strategy, resulting in even more precise and reliable signals
Matrix Arrow Indicator MT4
Juvenille Emperor Limited
5 (3)
O Matrix Arrow Indicator MT4 é uma tendência única 10 em 1 seguindo um indicador multi-timeframe 100% sem repintura que pode ser usado em todos os símbolos/instrumentos: forex, commodities, criptomoedas, índices, ações. O Matrix Arrow Indicator MT4 determinará a tendência atual em seus estágios iniciais, reunindo informações e dados de até 10 indicadores padrão, que são: Índice de movimento direcional médio (ADX) Índice de canal de commodities (CCI) Velas clássicas de Heiken Ashi Média Móvel Di
Support Resistance screnner
STE S.S.COMPANY
4.95 (37)
O Support And Resistance Screener está em um indicador de nível para MetaTrader que fornece várias ferramentas dentro de um indicador. As ferramentas disponíveis são: 1. Screener de estrutura de mercado. 2. Zona de retração de alta. 3. Zona de retração de baixa. 4. Pontos de Pivô Diários 5. Pontos Pivot semanais 6. Pontos Pivot mensais 7. Forte suporte e resistência com base no padrão harmônico e volume. 8. Zonas de nível de banco. OFERTA POR TEMPO LIMITADO: O indicador de suporte e resistência
Actualmente 40% OFF ! A melhor solução para qualquer novato ou comerciante especializado! Este software de painel de instrumentos está a funcionar em 28 pares de moedas. É baseado em 2 dos nossos principais indicadores (Advanced Currency Strength 28 e Advanced Currency Impulse). Dá uma grande visão geral de todo o mercado Forex. Mostra valores avançados de força da moeda, velocidade de movimento da moeda e sinais para 28 pares de divisas em todos os (9) períodos de tempo. Imagine como a sua n
Super Reversal Indicator with Alert Visão Geral Super Reversal Indicator with Alert é uma ferramenta de trading multi timeframe projetada para identificar oportunidades de reversão de alta probabilidade no mercado, utilizando uma combinação de momentum do estocástico, zonas de oferta e demanda e sinais de rejeição de preço. O indicador ajuda os traders a detectar possíveis pontos de reversão no mercado através de sinais visuais claros e alertas em tempo real. Principais Funcionalidades Análise E
Mais do autor
ACB Trade Filter MT5
KEENBASE SOFTWARE SOLUTIONS
ACB Trade Filter indicator provides a way to filtering out the low probability trading entries in a trading strategy. The indicator uses a sophisticated filtration algorithm based on the market sentiment and trend. The MT4 version of the same indicator is available here ACB Trade Filter MT4 Applications Works great with our indicator ACB Breakout Arrows MT5 Filter out low probability signals from any indicator. Avoid over-trading and minimize the losses. Trade in the direction of market sentime
Use of support and resistance in systematic trading is very subjective. Every trader has their own idea and way to plotting the support and resistance levels on the chart. KT Support and Resistance indicator take out this ambiguity out of the situation and automatically draws support and resistance levels following an algorithmic approach using a unique multi-timeframe analysis. When launched on the chart, It immediately scan the most significant extreme points across all the available timefra
ACB Breakout Arrows MT5
KEENBASE SOFTWARE SOLUTIONS
3.5 (2)
O indicador ACB Breakout Arrows fornece um sinal de entrada crucial no mercado ao detectar um padrão especial de rompimento. O indicador escaneia constantemente o gráfico em busca de um momento de consolidação em uma direção e fornece o sinal preciso logo antes do movimento principal. Obtenha o scanner de múltiplos ativos e múltiplos períodos aqui - Scanner para ACB Breakout Arrows MT5 Principais recursos Níveis de Stop Loss e Take Profit são fornecidos pelo indicador. Acompanha um painel Scan
KT Round Numbers MT5
KEENBASE SOFTWARE SOLUTIONS
KT Round Numbers plots the round number levels which are also commonly known as psychological levels in the Forex world. In the context of Forex trading, round number levels are those levels in which there are two or more zeroes at the end. They are named as 00 levels on the chart. Some traders also consider the halfway points as a valid round number level. They are named as 50 levels on the chart. Use of round number levels in trading Round number levels work as strong support and resistance
KT Momentum Arrows MT5
KEENBASE SOFTWARE SOLUTIONS
5 (2)
O indicador KT Momentum Arrows é baseado em uma quebra momentânea que é calculada usando a variação das bandas e a volatilidade emergente em determinada direção. Um sinal de compra é gerado quando o preço fecha acima da banda superior, e um sinal de venda é gerado quando o preço fecha abaixo da banda inferior. Um coeficiente de magnitude é utilizado como parâmetro de entrada, influenciando tanto a variação das bandas quanto a medição da volatilidade. O valor desse coeficiente deve ser escolhido
ACB Breakout Arrows
KEENBASE SOFTWARE SOLUTIONS
4.15 (34)
O indicador ACB Breakout Arrows fornece um sinal de entrada essencial no mercado ao detectar um padrão especial de rompimento. Ele monitora constantemente o gráfico em busca de um momento de estabilização direcional e oferece um sinal preciso pouco antes de um grande movimento.  Obtenha o scanner multissímbolo e multitemporal aqui - Scanner para ACB Breakout Arrows MT4 Principais recursos O indicador fornece níveis de Stop Loss e Take Profit. Acompanha um painel de Scanner MTF que monitora sina
KT Asian Breakout
KEENBASE SOFTWARE SOLUTIONS
4 (1)
KT Asian Breakout carefully analyzes the range-bound market during the Asian session and then fires a long or short trade after doing some preassessment based on its inbuilt technical analysis module. The executed orders are closed within a day before the completion of the next day session. The inbuilt technical analysis module checks for the session range and compares it with the last 20 days price movement. If it finds any erratic price movement within the session, the orders are not executed
KT RSI Divergence Robot MT4
KEENBASE SOFTWARE SOLUTIONS
O KT RSI Divergence robot é um Expert Advisor 100 % automatizado que negocia divergências regulares e ocultas formadas entre o preço e o oscilador Relative Strength Index (RSI). Os sinais de divergência são obtidos do nosso indicador gratuito RSI Divergence. Nem toda divergência resulta numa reversão de preço bem-sucedida; por isso este EA combina os sinais brutos de divergência com o seu módulo interno de análise técnica para explorar a ineficiência de preço que surge após algumas divergência
KT CCI Divergence MT5
KEENBASE SOFTWARE SOLUTIONS
KT CCI Divergence shows the regular and hidden divergence created between the price and CCI oscillator. Divergence is one of the vital signals that depicts the upcoming price reversal in the market. Manually spotting the divergence between price and CCI can be a hectic and ambiguous task. Limitations of KT CCI Divergence   Using the CCI divergence as a standalone entry signal can be risky. Every divergence can't be interpreted as a strong reversal signal. For better results, try to combine it w
ACB Trade Filter MT4
KEENBASE SOFTWARE SOLUTIONS
5 (1)
The ACB Trade Filter indicator provides a solution for filtering out the low probability trading setups in a trading strategy. The indicator uses a sophisticated filtration algorithm based on the market sentiment and trend. Applications Works great with our indicator " ACB Breakout Arrows ". Filter out low probability signals from any indicator. Avoid overtrading and minimize the losses. Trade in the direction of market sentiment and trend. Avoid the choppiness in the market. How to use Only L
KT Momentum Arrows
KEENBASE SOFTWARE SOLUTIONS
O indicador KT Momentum Arrows é baseado em uma quebra momentânea que é calculada usando a variação das bandas e a volatilidade emergente em determinada direção. Um sinal de compra é gerado quando o preço fecha acima da banda superior, e um sinal de venda é gerado quando o preço fecha abaixo da banda inferior. Um coeficiente de magnitude é utilizado como parâmetro de entrada, influenciando tanto a variação das bandas quanto a medição da volatilidade. O valor desse coeficiente deve ser escolhido
KT COG Advanced MT4
KEENBASE SOFTWARE SOLUTIONS
1 (1)
KT COG is an advanced implementation of the center of gravity indicator presented by John F. Ehlers in the May 2002 edition of Technical Analysis of Stocks & Commodities magazine. It's a leading indicator which can be used to identify the potential reversal points with the minimum lag. The COG oscillator catches the price swings quite effectively. MT5 version of the same indicator is available here KT COG Advanced MT5 Calculation of COG The COG indicator is consist of the two lines. The main l
KT Pin Bar
KEENBASE SOFTWARE SOLUTIONS
KT Pin Bar identifies the pin bar formation which is a type of price action pattern which depicts a sign of reversal or rejection of the trend. When combined with support and resistance, BRN and other significant levels, Pin Bar pattern proved to be a very strong sign of reversal. Basically, a pin bar is characterized by a small body relative to the bar length which is closed either in upper or lower 50% part of its length. They have very large wicks and small candle body. A pin bar candlestic
KT Trend Magic
KEENBASE SOFTWARE SOLUTIONS
KT Trend Magic shows the trend depiction on chart using the combination of market momentum and volatility. A smoothing coefficient is used to smooth out the noise from the signal.It can be used to find out the new entries or confirm the trades produced by other EA/Indicators. Usage Drag n drop MTF scanner which scans for the new signals across multiple time-frames. Find new entries in the trend direction. Improve the accuracy of other indicators when used in conjunction. Can be used as a dynami
KT Auto Fibo
KEENBASE SOFTWARE SOLUTIONS
O KT Auto Fibo desenha automaticamente os níveis de retração de Fibonacci com base na direção atual da tendência. Os pontos máximos e mínimos são selecionados automaticamente usando os valores máximos e mínimos disponíveis no gráfico. Você pode dar zoom e rolar o gráfico para ajustar os níveis de Fibonacci conforme necessário. Modos Automático:  Desenha automaticamente os níveis de Fibonacci com base na área do gráfico. Manual: Desenha os níveis de Fibonacci apenas uma vez. Depois disso, você p
KT Psar Arrows
KEENBASE SOFTWARE SOLUTIONS
O KT Psar Arrows plota setas no gráfico utilizando o indicador padrão Parabolic SAR. Uma seta de alta é desenhada quando a máxima da vela toca o SAR. Uma seta de baixa é desenhada quando a mínima da vela toca o SAR. Os sinais são gerados em tempo real, sem a necessidade de esperar o fechamento da vela.  Recursos Uma ferramenta útil para traders que desejam experimentar estratégias de negociação que envolvem o indicador Parabolic SAR.  Pode ser usado para identificar pontos de reversão no mercad
KT Ichimoku Trader
KEENBASE SOFTWARE SOLUTIONS
1 (1)
KT Ichimoku Trader is a fully automated expert advisor that offers five popular trading strategies based on the Ichimoku indicator. Each strategy has it's own entry and exit method without any interference to other strategies. The Ichimoku system can be applied to all major currency pairs and metals. However, we found that it performs reasonably well mainly on two pairs.   MT5 Version is available here  https://www.mql5.com/en/market/product/35043 Features Trade up to 5 famous trading strategi
KT Volatility Oscillator
KEENBASE SOFTWARE SOLUTIONS
O Oscilador de Volatilidade KT analisa os dados de mercado passados e atuais utilizando uma fórmula matemática para exibir o resultado na forma de um oscilador. As ondas crescentes e decrescentes equivalem a alta e baixa volatilidade do ativo.  Em resumo, a volatilidade é simplesmente uma medida das flutuações de preço de um ativo ao longo de um determinado período de tempo. Sem volatilidade, haveria pouco movimento no mercado e os traders não poderiam lucrar com as variações de preço. Uso da V
KT COG Robot
KEENBASE SOFTWARE SOLUTIONS
KT COG Robot is a fully automated Expert Advisor based on the KT COG Indicator . The COG indicator was originally presented by John F. Ehlers in the May 2002 edition of Technical Analysis of Stocks & Commodities magazine. The EA fires a long trade when COG line cross above the signal line and a short trade is fired when the COG line cross below the signal line.  Adaptive Filtration Our adaptive filtration algorithm combines the original COG formula with the major trend direction and market acce
ACB Breakout Arrows EA
KEENBASE SOFTWARE SOLUTIONS
Este é um Expert Advisor 100% automatizado baseado no nosso indicador personalizado chamado "ACB Breakout Arrows" . As entradas são baseadas em um padrão de rompimento que ocorre constantemente em ambas as direções. A intensidade dos sinais pode ser ajustada com o parâmetro externo "Signal Sensitivity". Confirmação de operações O ACB Breakout Arrows EA oferece a capacidade de filtrar entradas usando outro de nossos indicadores personalizados chamado ACB Trade Filter . Compra forte: Seta para c
KT London Breakout
KEENBASE SOFTWARE SOLUTIONS
First thirty minutes are essential for a trading session. The early reaction of traders and market players sets a path for the rest of the day. KT London Breakout EA takes advantage of this phenomenon, and after analyzing the first thirty minutes of London session, it places two bidirectional pending orders. One of pending order is eventually canceled after realizing the market direction with certainty. It has been strictly tested and developed for EUR/JPY using 30-Min Time Frame. You can expe
Use of support and resistance in systematic trading is very subjective. Every trader has their own idea and way to plotting the support and resistance levels on the chart. KT Support and Resistance indicator take out this ambiguity out of the situation and automatically draws support and resistance levels following an algorithmic approach using a unique multi-timeframe analysis. When launched on the chart, It immediately scan the most significant extreme points across all the available timefra
Se você negocia Forex, ter informações detalhadas sobre a força das moedas e a correlação entre os pares pode levar suas operações a um novo patamar. A correlação ajudará a reduzir o risco pela metade, enquanto a análise de força ajudará a maximizar os lucros. Este indicador oferece uma abordagem híbrida para selecionar os pares de moedas mais adequados, combinando análise de força e correlação entre pares de moedas. Como usar a Análise de Força das Moedas Suponha que sua estratégia de negociaç
MACD Divergence Seeker
KEENBASE SOFTWARE SOLUTIONS
KT MACD Divergence Seeker trades the regular and hidden divergence signals generated by our free indicator named KT MACD Divergence indicator. Trading the standalone divergences can be a risky affair that's why the KT MACD Divergence Seeker combines the standard divergence signals with an advanced analysis module to exploit the price inefficiencies on some FX pairs. What is the Divergence exactly? As a general conception if the price is making higher highs, then macd should also be making hig
KT Asian Breakout Indicator
KEENBASE SOFTWARE SOLUTIONS
O indicador KT Asian Breakout analisa uma parte crítica da sessão asiática para gerar sinais de compra e venda em ambas as direções, com base na quebra de preço. Um sinal de compra ocorre quando o preço rompe acima da máxima da sessão, enquanto um sinal de venda ocorre quando o preço rompe abaixo da mínima da sessão. Coisas para lembrar Se a caixa da sessão for muito ampla verticalmente, deve-se evitar uma nova negociação, pois a maior parte da ação do preço já ocorreu dentro da sessão. Se a ve
MACD Divergence MT4
KEENBASE SOFTWARE SOLUTIONS
O KT MACD Divergence mostra as divergências regulares e ocultas formadas entre o preço e o oscilador. Se sua estratégia de trading antecipa uma reversão de tendência, você pode usar a divergência regular do MACD para identificar possíveis pontos de virada. Já se sua estratégia é baseada na continuação da tendência, a divergência oculta do MACD será uma boa escolha. Limitações do KT MACD Divergence Usar a divergência do MACD como único sinal de entrada pode ser arriscado. Nem toda divergência d
KT Bollinger Bands Trader MT4
KEENBASE SOFTWARE SOLUTIONS
O KT Bollinger Bands Trader é um consultor especializado 100% automatizado que utiliza uma estratégia de reversão à média com base nas Bandas de Bollinger durante períodos de baixa volatilidade. O preço frequentemente reage nas linhas superior ou inferior das bandas, mas a reversão nem sempre ocorre. No entanto, as chances de reversão aumentam em momentos de baixa volatilidade. Entradas Uma compra é ativada quando o preço se alinha corretamente abaixo da linha inferior das Bandas de Bollinger.
KT CCI Divergence MT4
KEENBASE SOFTWARE SOLUTIONS
KT CCI Divergence shows the regular and hidden divergence created between the price and CCI oscillator. Divergence is one of the vital signals that depicts the upcoming price reversal in the market. Manually spotting the divergence between price and CCI can be a hectic and ambiguous task. Limitations of KT CCI Divergence   Using the CCI divergence as a standalone entry signal can be risky. Every divergence can't be interpreted as a strong reversal signal. For better results, try to combine it w
KT Heiken Ashi Smoothed MT4
KEENBASE SOFTWARE SOLUTIONS
KT Heiken Ashi Smoothed é uma versão suavizada do Heiken Ashi padrão e ainda exibe setas de compra/venda quando ocorre mudança de tendência. Seta de compra quando o estado muda de baixista para altista. Seta de venda quando o estado muda de altista para baixista. Alertas por push móvel, email, som e pop-up incluídos. O que é exatamente o Heiken Ashi Smoothed? Ele filtra sinais falsos e ruídos presentes no Heiken Ashi padrão aplicando duas médias móveis para suavizar o preço. Ignorando um leve
KT MA Crossover MT4
KEENBASE SOFTWARE SOLUTIONS
O KT MA Crossover desenha setas de compra e venda com base no cruzamento das médias móveis selecionadas. Além disso, ele também gera os alertas apropriados e exibe o valor de MFE (Excursão Mais Favorável) para cada sinal consecutivo. O cruzamento de médias móveis é uma das estratégias mais utilizadas por traders em todo o mundo. Normalmente envolve uma média móvel rápida e uma lenta para identificar sinais de compra e venda com base na direção do cruzamento. Sinal de compra – quando a média móv
Filtro:
Sem comentários
Responder ao comentário