KT Bulls Bears MT4
- インディケータ
- バージョン: 1.0
- アクティベーション: 5

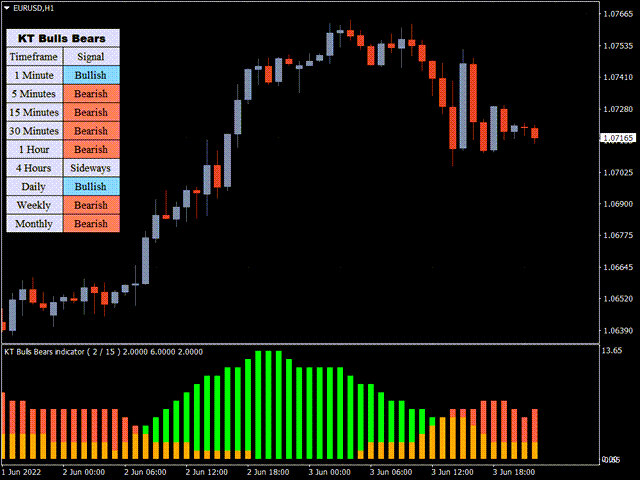
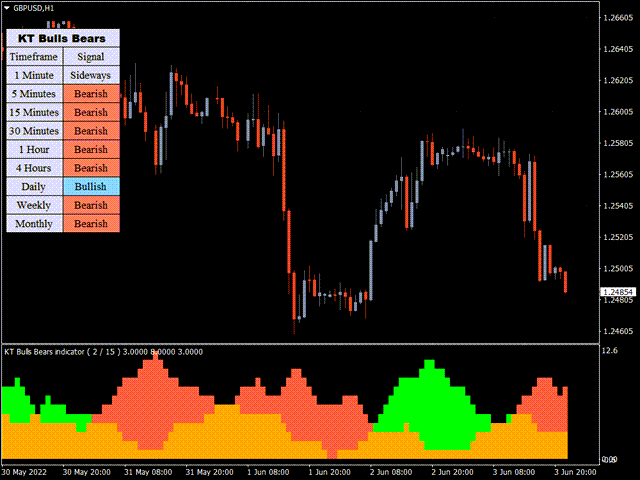
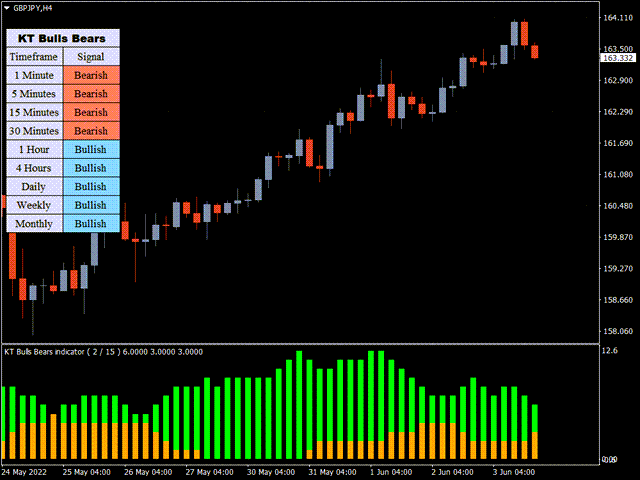
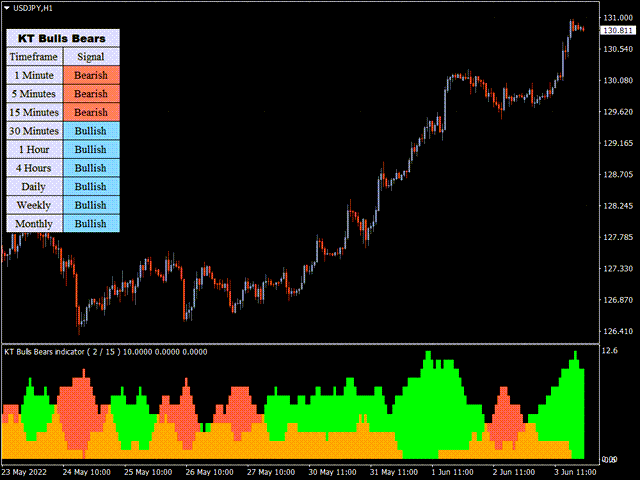
このインジケーターは、RSIの買われ過ぎ/売られ過ぎの領域を上回るまたは下回るバーの数を使用して、市場の強気/弱気の状態を表示します。緑のヒストグラムは強気の力を示し、赤のヒストグラムは弱気の力を示します。
特徴
- 新しいトレードのエントリーに使用することも、他の戦略やインジケーターのトレードを確認するために使用することもできます。
- 複数の時間軸をスキャンするマルチタイムフレームスキャナーが搭載されており、各時間軸の強気/弱気の勢力を分析します。
- 初心者トレーダーが強気/弱気の勢力を利用してエントリーを確認できるため、自信を持ってトレードできるようになります。
- MetaTraderの全アラート機能を搭載。
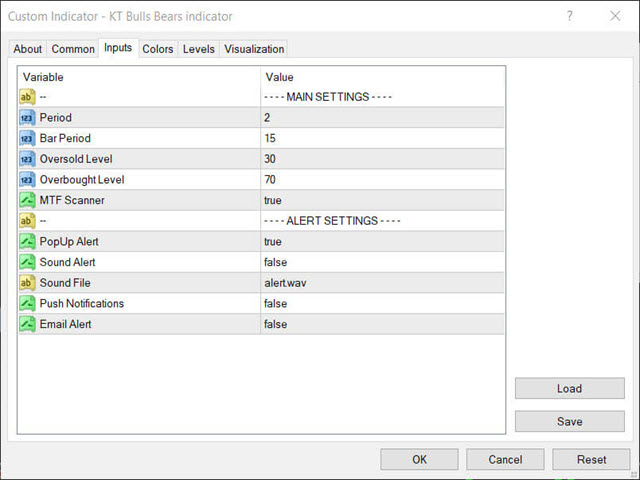
入力パラメーター
- 期間: RSIの買われ過ぎ/売られ過ぎレベルを特定するための期間。
- バー期間: RSIの買われ過ぎ/売られ過ぎレベルを上回る/下回るバーの数。
- 売られ過ぎレベル: RSIで売られ過ぎの水準を決定する値。
- 買われ過ぎレベル: RSIで買われ過ぎの水準を決定する値。
- MTFスキャナー: すべての時間足からシグナルを取得するマルチタイムフレームスキャナー。
- アラート設定