Important Levels ResSup
- Göstergeler
- Sürüm: 1.21
- Güncellendi: 29 Kasım 2021
- Etkinleştirmeler: 5

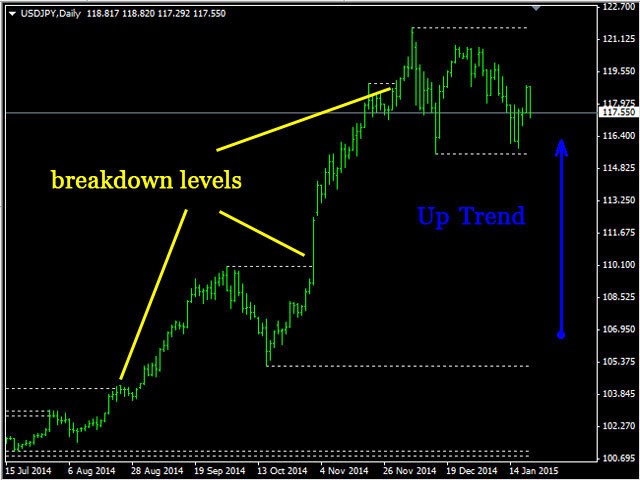
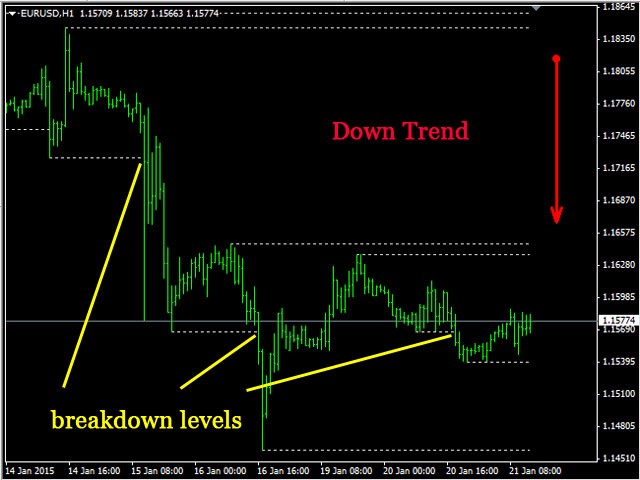
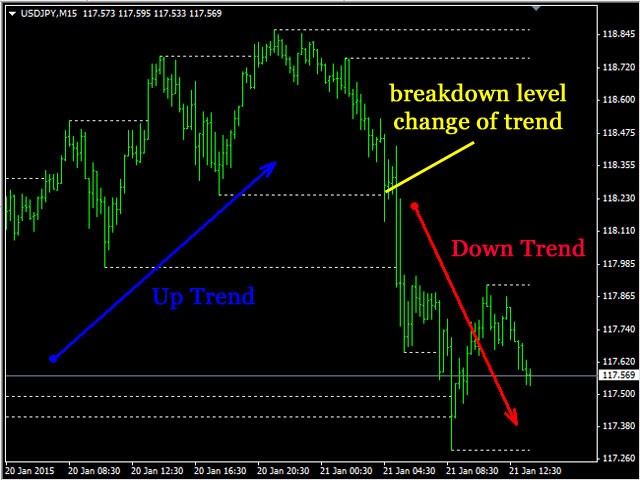
The main rule of the profitable trading is opening trades in the direction of a trend. You can define the current trend using fractal analysis. Important Levels ResSup displays important price levels on the chart. The breakthrough of those levels shows the price direction. The data panel allows you to track the current trends on all timeframes. The current timeframe's important level values are shown in the comments.
The indicator can be useful for traders working by levels. It can also be a part of a trading system.