Pnitrol Levels

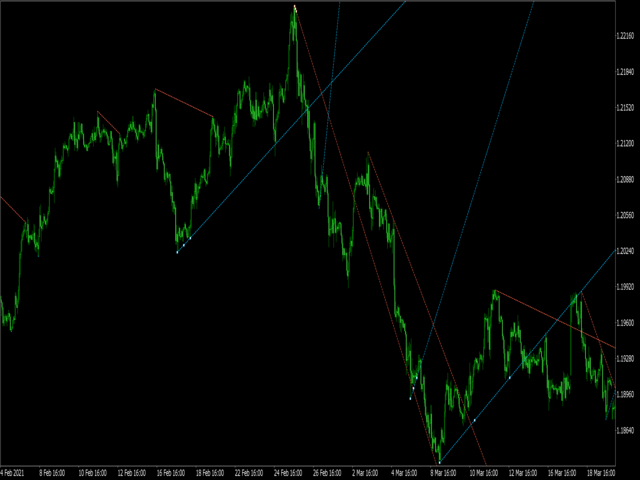
Draws trend lines from the high and / or low values ​​of the week.

The color and thickness of the levels are customizable.

All trend lines can be edited.

Suitable levels of the past can be renamed and other properties changed.

Levels are re-read only on the H1 timeframe once an hour.


...

⣿⣿⣿⣿⣿⣿⣿⣿⣿⣿⣿⣿⣿⣿⣿⣿⣿⣿⣿⣿⣿⣿⣿⣿⡟⣫⣿⣿⣿⣿

⣿⣿⣿⣿⣿⣿⣿⣿⣿⣿⣿⣿⣿⣿⣿⣿⣿⣿⣿⣿⣿⢿⠛⣩⣾⣿⣿⣿⣿⣿

⣿⣿⣿⣿⣿⣿⣿⣿⡛⠛⠛⠛⠛⠛⠛⢿⢻⣿⡿⠟⠋⣴⣾⣿⣿⣿⣿⣿⣿⣿

⣿⣿⣿⣿⡿⢛⣋⠉⠁⠄⢀⠠⠄⠄⠄⠈⠄⠋⡂⠠⣿⣿⣿⣿⣿⣿⣿⣿⣿⣿

⣿⣿⣿⣛⣛⣉⠄⢀⡤⠊⠁⠄⠄⠄⢀⠄⠄⠄⠄⠲⣾⣿⣿⣿⣿⣿⣿⣿⣿⣿

⣿⡿⠟⠋⠄⠄⡠⠊⠄⠄⠄⠄⠄⣀⣼⣤⣤⣤⣀⠄⠸⣿⣿⣿⣿⣿⣿⣿⣿⣿

⣿⠛⣁⡀⠄⡠⠄⠄⠄⠄⠄⠄⢠⣿⣿⣿⣿⣿⣿⣷⣶⣿⣿⣿⣿⣿⣿⣿⣿⣿

⣿⠿⢟⡉⠰⠁⠄⠄⠄⠄⠄⠄⠄⠙⠿⠿⢿⣿⣿⣿⣿⣿⣿⣿⣿⣿⣿⣿⣿⣿

⡇⠄⠄⠙⠃⠄⠄⠄⠄⠄⠄⠄⠄⠄⠄⠄⠄⠄⠈⠉⠉⠛⠛⠛⠻⢿⣿⣿⣿⣿

⣇⠄⢰⣄⠄⠄⠄⠄⠄⠄⠄⠄⠄⠄⠄⠄⠄⠄⠄⠄⠄⠄⠄⠄⠄⠄⠉⠻⣿⣿

⣿⠄⠈⠻⣦⣤⡀⠄⠄⠄⠄⠄⠄⠄⠄⠄⠄⠄⠄⠄⠄⠄⠄⠄⠄⠄⠄⣦⠙⣿

⣿⣄⠄⠚⢿⣿⡟⠄⠄⠄⢀⡀⠄⠄⠄⠄⠄⠄⠄⠄⠄⠄⠄⠄⠄⠄⢀⣿⣧⠸

⣿⣿⣆⠄⢸⡿⠄⠄⢀⣴⣿⣿⣿⣿⣷⣶⣶⣶⣶⠄⠄⠄⠄⠄⠄⢀⣾⣿⣿⠄

⣿⣿⣿⣷⡞⠁⢀⣴⣿⣿⣿⣿⣿⣿⣿⣿⣿⣿⣿⣧⡀⠄⠄⣠⣾⣿⣿⣿⣿⢀

⣿⣿⣿⡿⠁⢠⣿⣿⣿⣿⣿⣿⣿⣿⣿⣿⣿⣿⣿⣿⡿⠄⠄⠘⣿⣿⡿⠟⢃⣼

⣿⣿⠏⠄⠠⣿⣿⣿⣿⣿⣿⣿⣿⣿⣿⣿⣿⠿⠛⠉⢀⡠⢄⡠⡭⠄⣠⢠⣾⣿

⠏⠄⠄⣸⣾⣿⣿⣿⣿⣿⣿⣿⣿⣿⡟⠁⠄⢀⣦⣒⣁⣒⣩⣄⣃⢀⣮⣥⣼⣿

⣿⣿⣿⣿⣿⣿⣿⣿⣿⣿⣿⣿⣿⣿⣿⣿⣿⣿⣿⣿⣿⣿⣿⣿⣿⣿⣿⣿⣿⣿

Önerilen ürünler
Free automatic Fibonacci is an indicator that automatically plots a Fibonacci retracement based on the number of bars you select on the BarsToScan setting in the indicator. The Fibonacci is automatically updated in real time as new highest and lowest values appears amongst the selected bars. You can select which level values to be displayed in the indicator settings. You can also select the color of the levels thus enabling the trader to be able to attach the indicator several times with differe
FREE
Important Lines
Terence Gronowski
4.88 (24)
This indicator displays Pivot-Lines, preday high and low, preday close and the minimum and maximum of the previous hour. You just have to put this single indicator to the chart to have all these important lines, no need to setup many single indicators. Why certain lines are important Preday high and low : These are watched by traders who trade in a daily chart. Very often, if price climbs over or falls under a preday low/high there is an acceleration in buying/selling. It is a breakout out of a
FREE
PZ Penta O MT5
PZ TRADING SLU
3.5 (4)
The Penta-O is a 6-point retracement harmonacci pattern which usually precedes big market movements. Penta-O patterns can expand and repaint quite a bit. To make things easier this indicator implements a twist: it waits for a donchian breakout in the right direction before signaling the trade. The end result is an otherwise repainting indicator with a very reliable trading signal. The donchian breakout period is entered as an input. [ Installation Guide | Update Guide | Troubleshooting | FAQ | A
FREE
Donchian Breakout And Rsi
Mattia Impicciatore
4.5 (2)
Genel Açıklama Bu gösterge, klasik Donchian Kanalı ’nın geliştirilmiş bir versiyonudur ve gerçek işlem için pratik işlevlerle zenginleştirilmiştir. Standart üç çizgiye (üst, alt ve orta çizgi) ek olarak sistem breakout (fiyat kırılımı) noktalarını tespit eder ve bunları grafikte oklarla görsel olarak gösterir. Ayrıca grafiği sadeleştirmek için mevcut trend yönünün tersindeki çizgi yalnızca görüntülenir. Gösterge şunları içerir: Görsel sinyaller : Kırılım sırasında renkli oklar Otomatik bildiriml
FREE
Statistical Arbitrage Spread Generator for Cointegration [MT5] What is Pair Trading? Pair trading is a market-neutral strategy that looks to exploit the relative price movement between two correlated assets — instead of betting on the direction of the market. The idea? When two assets that usually move together diverge beyond a statistically significant threshold, one is likely mispriced. You sell the expensive one, buy the cheap one , and profit when they converge again. It’s a statistica
FREE
Follow The Line MT5
Oliver Gideon Amofa Appiah
4.6 (35)
This indicator obeys the popular maxim that: "THE TREND IS YOUR FRIEND" It paints a GREEN line for BUY and also paints a RED line for SELL. (you can change the colors). It gives alarms and alerts of all kinds. IT DOES NOT REPAINT and can be used for all currency pairs and timeframes. Yes, as easy and simple as that. Even a newbie can use it to make great and reliable trades. NB: For best results, get my other premium indicators for more powerful and reliable signals. Get them here: https://www.m
FREE
Daily Support and Resistance Levels 는 클래식 피벗 포인트 방식으로 일중 거래 핵심 가격 레벨을 자동 계산/표시하는 전문 지표입니다. 주요 기능: 피벗 포인트(PP) 자동 계산 3개의 저항 레벨(R1, R2, R3) 3개의 지지 레벨(S1, S2, S3) 전일 고가/저가 표시 실시간 정보 패널 상승/하락 바이어스 표시 최근 레벨까지 거리 표시 색상/표시 완전 사용자 설정 매일 자동 업데이트 모든 타임프레임 지원 계산 방식: 전일 고가/저가/종가 기반 클래식 피벗 포인트. 트레이딩 활용: 지지/저항 반등 매매 돌파 전략 레인지 거래 방향성 판단 목표가 설정 사용 방법: 차트에 인디케이터 적용 레벨 자동 생성 가격 > PP = 상승 바이어스 가격 < PP = 하락 바이어스 S1-S3 = 지지 구간 R1-R3 = 저항 구간 설정 옵션: 피벗/지지/저항 색상 라인 굵기/스타일 가격 라벨 표시/숨기기 정보 패널 ON/OFF 패널 위치/폰트 크기 전일 고가/저가 표
FREE
FlatBreakout MT5 (Free Version) Flat Range Detector and Breakout Panel for MT5 — GBPUSD Only FlatBreakout MT5   is the free version of the professional FlatBreakoutPro MT5 indicator, specially designed for flat (range) detection and breakout signals on the   GBPUSD   pair only. Perfect for traders who want to experience the unique fractal logic of FlatBreakout MT5 and test breakout signals on a live market without limitations. Who Is This Product For? For traders who prefer to trade breakout of
FREE
"Haven Key Levels PDH PDL"   göstergesi, yatırımcıların grafikteki kilit seviyeleri görselleştirmesine yardımcı olur. Aşağıdaki seviyeleri otomatik olarak işaretler: DO (Daily Open)   — Günlük Açılış seviyesi. NYM (New York Midnight)   — New York Gece Yarısı seviyesi. PDH (Previous Day High)   — Önceki Günün En Yüksek seviyesi. PDL (Previous Day Low)   — Önceki Günün En Düşük seviyesi. WO (Weekly Open)   — Haftalık Açılış seviyesi. MO (Monthly Open)   — Aylık Açılış seviyesi. PWH (Previous Week
FREE
DF Fib Trader Pro DF Fib Trader Pro, MetaTrader 5 için tasarlanmış otomatik bir işlem sistemidir. Giriş ve çıkış noktalarını tanımlamak için Fibonacci tabanlı fiyat seviyelerini trend ve yapı analiziyle birleştirir. EA hem uzun hem de kısa pozisyonları destekler ve yerleşik risk yönetimi parametreleri içerir. Temel Özellikler: • Giriş, SL ve TP noktalarını çizmek için Fibonacci geri çekilme ve uzatma mantığını kullanır. • Yapılandırılabilir lot büyüklüğü ve zarar durdurma/kâr alma seviyeleri •
FREE
LT Donchian Channel
Thiago Duarte
4.86 (7)
Donchian Channel is an indicator created by Richard Donchian. It is formed by taking the highest high and the lowest low of the last specified period in candles. The area between high and low is the channel for the chosen period. Its configuration is simple. It is possible to have the average between the upper and lower lines, plus you have alerts when price hits one side. If you have any questions or find any bugs, please contact me. Enjoy!
FREE
Easy Correlations Indicator The Easy Correlations Indicator is designed to help traders analyze the relationship between two correlated instruments. By monitoring the distance between their Relative Strength Index (RSI) values, the indicator highlights situations where one instrument has moved significantly further than the other. This creates potential trading opportunities: Sell the stronger instrument (overstretched RSI) Buy the weaker instrument (lagging RSI) Because the positions are opened
FREE
Are you tired of drawing trendlines every time you're analyzing charts? Or perhaps you would like more consistency in your technical analysis. Then this is for you. This indicator will draw trend lines automatically when dropped on a chart. How it works Works similar to standard deviation channel found on mt4 and mt5. It has 2 parameters: 1. Starting Bar 2. Number of bars for calculation The   starting bar   is the bar which drawing of the trend lines will begin, while the   number of bars for c
FREE
Pivot Point Fibo RSJ, Fibonacci oranlarını kullanarak günün destek ve direnç çizgilerini izleyen bir göstergedir. Bu muhteşem gösterge, Fibonacci oranlarını kullanarak Pivot Point üzerinden 7 seviyeye kadar destek ve direnç oluşturur. Fiyatların, bir operasyonun olası giriş/çıkış noktalarını algılamanın mümkün olduğu bu destek ve direncin her bir düzeyine uyması harika. Özellikleri 7 seviyeye kadar destek ve 7 seviye direnç Seviyelerin renklerini ayrı ayrı ayarlayın Girişler Pivot Tipi Pivo
FREE
MACD Enhanced
Nikita Berdnikov
5 (3)
Introducing the MACD  Enhanced – an advanced MACD (Moving Average Convergence Divergence) indicator that provides traders with extended capabilities for trend and momentum analysis in financial markets. The indicator uses the difference between the fast and slow exponential moving averages to determine momentum, direction, and strength of the trend, creating clear visual signals for potential entry and exit points. Attention! To achieve the best results, it is recommended to adapt the indicator
FREE
The indicator identifies when a divergence occurs between price and an indicator or oscillator. It identifies both regular and hidden divergences. Combined with your own rules and techniques, this indicator will allow you to create (or enhance) your own powerful system. For higher probability setups I can recommend you to use my Supply Demand indicator and trade only if the divergence occurs inside a zone. Supply zone for bearish div and demand zone for bullish div. The optimal scenario is if it
FREE
ProTrade Technical Assistant Otomatik Destek/Direnç bölgeleri tespiti, Adil Değer Boşlukları (FVG) tanımlama ve Fibonacci düzeltme seviyelerine sahip profesyonel piyasa yapısı analiz göstergesi. Ürün İşlevi ProTrade Technical Assistant, piyasa yapısının temel unsurlarını otomatik olarak tespit eder ve MT5 grafiğiniz üzerine doğrudan çizer: Destek ve Direnç Bölgeleri - Salınım yüksek/düşük noktalarından otomatik tespit Adil Değer Boşlukları (FVG) - 3 mumluk dengesizlik desenlerinin tespiti Fibona
Second Level Candles And Alligator Indicators 每12秒产生一个K线,而且自带Alligator指标,对超短线选手交易非常有帮助。程序启动时可能不成功,是因为MT5 MqlTick 数据加载少的原因。可以通过修改显示的数据参数避免,比如display=100,程序正常之后再将参数调大 display=300 。如果数据不正常,也可以采用重新加载的方式解决。 如果您对这个指标有任何建议,请联系作者。  Second Level Candles And Alligator Indicators  produced a candle per 12 seconds,include Alligator, it's helpful to Short-Term Trading。You'd better reload the indicator every start MT5 or change display parameter to reslove data bug. Please attach author when  you had some su
FREE
Heiken Ashi MT5 Göstergesi Heiken Ashi MT5 Göstergesi, standart fiyat verilerini daha yumuşak ve trend odaklı mumlara dönüştürerek, piyasa trendlerini ve potansiyel dönüş noktalarını daha kolay belirlemenizi sağlayan güçlü bir araçtır. Ana Özellikler: Net trend tanımlama: Yükseliş ve düşüş trendlerini farklı mum renkleriyle görsel olarak ayırt eder. Gürültü azaltma: Fiyat dalgalanmalarını filtreleyerek piyasanın ana hareketlerine daha net odaklanmanızı sağlar. Erken trend tespiti: Standart graf
FREE
High Low Open Close
Alexandre Borela
4.98 (44)
Bu projeyi seviyorsanız, 5 yıldız incelemesi bırakın. Bu gösterge açık, yüksek, düşük ve belirtilen fiyatlar için çizer Dönem ve belirli bir zaman bölgesi için ayarlanabilir. Bunlar birçok kurumsal ve profesyonel tarafından görünen önemli seviyelerdir. tüccarlar ve daha fazla olabileceği yerleri bilmeniz için yararlı olabilir Aktif. Mevcut dönemler şunlardır: Önceki gün. Önceki Hafta. Önceki Ay. Previous Quarter. Önceki yıl. Veya: Mevcut gün. Hafta. Şimdi Ay. Şimdiki Mahallesi. Bugün yıl.
FREE
Introduction Welcome to the world of Forex trading, where every tick of the market can be influenced by news events. Introducing our expert advisor for MetaTrader, your ultimate tool for navigating the complexities of news trading. This innovative advisor is specifically designed to automate your trading strategy during key macroeconomic releases, ensuring you never miss an opportunity.  When important indicators are announced, volatility often spikes, creating potential for profit. Our expert
FREE
MT5 için NAS100 Auto SL ve TP Maker ile tanışın: MetaTrader 5'te Nasdaq 100 piyasasında gezinen yatırımcılar için vazgeçilmez bir yardımcı olan NAS100 Auto SL ve TP Maker ile StopLoss ve TakeProfit ayarlarını bir daha asla kaçırmayın. Bu araç, StopLoss ve TakeProfit seviyelerinin yönetimini otomatikleştirmek için sorunsuz bir çözüm arayanlar için tasarlanmıştır. Temel Özellikler: Zahmetsiz Otomasyon: StopLoss ve/veya TakeProfit olmadan Nasdaq 100 işlemlerini otomatik olarak izler. Kullanıcı ta
FREE
Candle Countdown — MT5 için mum kapanışına kalan süreyi hassas şekilde gösterir Candle Countdown, mevcut mumun kapanmasına kalan süreyi doğrudan grafikte gösteren basit ve hassas bir araçtır. Eğer giriş kararınız mum kapanışına bağlıysa, birkaç saniye bile fark yaratabilir. Bu gösterge, tam zamanı görmenizi sağlar ve acele etmeden, tahmin yürütmeden karar vermenize yardımcı olur. Mum kapanış zamanını hassas şekilde kontrol etmek için tasarlanmış bir göstergedir. Gösterge şunları gösterir: mum k
FREE
Coral Indi
Dinh Duong Luong
Coral trend is   a trend-following indicator that is widely popular among FOREX traders . It is usually used as a confluence with other indicators. It uses combinations of moving averages with complex smoothing formulas! It has two configurable parameters: Coefficient   - smoothing ratio (*) Applied price Calculation: Coral = (-0.064) * B6 + 0.672 * B5 - 2.352 * B4 + 2.744 * B3
FREE
Enhanced Volume Profile: The Ultimate Order Flow & Liquidity Analysis Tool Overview Enhanced Volume Profile is an indicator for MetaTrader 5 that displays the traded volume at specific price levels over a defined period. It separates the total volume into buy and sell components, presenting them as a side-by-side histogram on the chart. This allows users to observe the volume distribution and the proportion of buy and sell volumes at each price level. Graphics Rendering The indicator uses the
FREE
Hunter’s Scope: Volatilite ve Trend Gücü Göstergesi (MT5) Hunter’s Scope; yönsel güç ve volatiliteyi filtreleyerek fiyat genişlemesini belirleyen, MetaTrader 5 için yüksek momentumlu bir göstergedir. Önemli dürtüsel (impulse) mumları tespit etmek için tasarlanmış olup, momentum tabanlı işlemler için net ve objektif sinyaller sağlar. Temel Mantık: Çift Katmanlı Filtre Gecikmeli kesişimler yerine Hunter’s Scope, iki yönlü bir doğrulama modeli kullanır: Trend Gücü (ADX): Sinyaller yalnızca ADX kull
FREE
RSI abcd
Francisco Gomes Da Silva
4.33 (3)
RSI ABCD Desen Bulucu: Teknik Strateji 1. Gösterge Nasıl Çalışır? Klasik RSI ile otomatik ABCD harmonik desen tespitini birleştirir. Temel Bileşenler Standart RSI (ayarlanabilir periyot) Tepe ve dip işaretleri (oklar) ABCD desenleri (yeşil/kırmızı çizgiler) Aşırı alım (70) ve aşırı satım (30) filtreleri 2. MT5 Kurulumu period = 14 ; // RSI periyodu size = 4 ; // Maksimum desen boyutu OverBought = 70 ; // Aşırı alım seviyesi OverSold = 30 ; // Aşırı satım seviyesi Filter = USE_FILTER_ YES ; // On
FREE
Volume Weighted Average Price or VWAP is an indicator wich shows different average prices on chart. This is very useful to find strong negotiation price areas and as trend following. Configurations: Day, Week and Month - Show different VWAPs according to the period. You can change each line style on "colors" tab. Any doubt or suggestion please contact us. Enjoy! This is a free indicator, but it took hours to develop. If you want to pay me a coffee, I appreciate a lot   <3 PayPal, Skrill, Nete
FREE
Pivot MT5
Dmitrij Isaenko
The indicator draws daily support and resistance lines on the chart, as well as the Pivot level (reversal level). Adapted to work in MT5 The standard timeframe for calculating support and resistance levels is D1. You can choose other timeframes according to your strategy (for example, for M1-M15, the optimal timeframe for calculations is H1) The function for calculating support and resistance levels has been updated; in this calculation option, fibonacci levels are taken into account, respec
FREE
Bu küçük araç, grafik üzerinde basit bir çizgi sürükleyerek risk yönetiminizi tanımlamanıza yardımcı olur. Hesap yüzdesi veya sabit para tutarı üzerinden hesaplanan gerçek lot büyüklüğünü doğrudan satırda gösterir. Tek yapmanız gereken klavyenizdeki "t" tuşuna basarak hattı aktif hale getirmek ve hattı stoploss noktanıza sürüklemek. Bu kadar. Ayarlarda çizgi ve metnin rengini ve genişliğini, ayrıca metinden satıra kadar olan boşluğu ve sağı tanımlayabilir ve riski hesap yüzdesi veya sabit para
FREE
Bu ürünün alıcıları ayrıca şunları da satın alıyor
Trade Assistant MT5
Evgeniy Kravchenko
4.42 (208)
It helps to calculate the risk per trade, the easy installation of a new order, order management with partial closing functions, trailing stop of 7 types and other useful functions. Additional materials and instructions Installation instructions - Application instructions - Trial version of the application for a demo account Line function -   shows on the chart the Opening line, Stop Loss, Take Profit. With this function it is easy to set a new order and see its additional characteristics bef
Trade Manager EA’ye hoş geldiniz! Ticaretin daha sezgisel, hassas ve verimli hale gelmesi için tasarlanmış nihai risk yönetim aracı ile tanışın. Bu sadece bir emir verme aracı değil; ticaret planlaması, pozisyon yönetimi ve risk kontrolü için kapsamlı bir çözüm. İster yeni başlayan bir yatırımcı olun, ister deneyimli bir trader ya da hızlı emir gerektiren bir scalper, Trade Manager EA ihtiyaçlarınıza uyum sağlar ve forex, endeksler, emtialar ve kripto paralar dahil tüm piyasalarda esneklik sunar
Local Trade Copier EA MT5
Juvenille Emperor Limited
4.96 (135)
Local Trade Copier EA MT5   ile olağanüstü hızlı işlem kopyalama deneyimi yaşayın. Kolay 1 dakikalık kurulumuyla bu işlem kopyalayıcısı, aynı Windows bilgisayarda veya Windows VPS'te birden fazla MetaTrader terminali arasında işlemleri kopyalamanıza olanak tanır ve 0.5 saniyenin altındaki şimşek hızında kopyalama hızları sunar. Başlangıç seviyesinde veya profesyonel bir tüccar olsanız da,   Local Trade Copier EA MT5 , spesifik ihtiyaçlarınıza göre özelleştirmek için geniş bir seçenek yelpazesi s
TradePanel MT5
Alfiya Fazylova
4.87 (151)
Trade Panel, çok işlevli bir ticaret asistanıdır. Uygulama, manuel ticaret için 50'den fazla ticaret fonksiyonu içerir ve çoğu ticaret görevini otomatikleştirmeyi mümkün kılar. Dikkat! İndirimler sınırlı süreli olup, her salı fiyat 5$ artacaktır. (100$'a kadar). Satın almadan önce demo hesapta demo sürümü test edebilirsiniz. Demo hesap için uygulamanın deneme sürümünü indirin: https://www.mql5.com/en/blogs/post/750865 . Talimatların tamamı buraya . Ticaret. Tek tıklamayla ticaret işlemleri yapma
Beta Sürümü Telegram to MT5 Signal Trader resmi alfa sürümüne neredeyse hazır. Bazı özellikler hâlâ geliştirilmekte olup küçük hatalarla karşılaşabilirsiniz. Sorun yaşarsanız lütfen bildirin, geri bildiriminiz yazılımın herkes için gelişmesine yardımcı olur. Telegram to MT5 Signal Trader , Telegram kanallarından veya gruplarından gelen işlem sinyallerini otomatik olarak MetaTrader 5 hesabınıza kopyalayan güçlü bir araçtır. Herkese açık ve özel kanalları destekler ve birden fazla sinyal sağlayıc
Farmed Hedge Yield Farming | All Markets (Manual - Hybrid - Semi/Automated EA) MULTI-ASSET SUPPORT Trade any asset available on your broker - Forex: Major, Minor, Exotic pairs - Crypto: BTC, ETH, XRP, SOL, BNB - Stocks: Apple, Tesla, Amazon, Google, etc. - Commodities: Gold, Silver, Oil, Gas - Indices: US30, NAS100, SPX500, DAX40 - Any CFD your broker offers VERIFIED TRADING RESULTS - Farmed Hedge Yield Axi Copy:  https://www.mql5.com/en/signals/2356376 - Farmed Hedge Yield Exn Copy:   https:/
Tired of complex order placement and manual calculations? Trade Dashboard is your solution. With its user-friendly interface, placing orders becomes effortless, by a single click, you can open trades, set stop loss and take profit levels, manage trade lot size, and calculate risk to reward ratios, allowing you to only focus on your strategy. Say goodbye to manual calculations and streamline your trading experience with Trade Dashboard. Download  Demo Version  right now. You can find  Details of
Exp COPYLOT CLIENT for MT5
Vladislav Andruschenko
3.82 (34)
MetaTrader 5 için profesyonel işlem kopyalayıcı MetaTrader için hızlı, profesyonel ve güvenilir bir işlem kopyalayıcı . COPYLOT , MT4 ve MT5 terminalleri arasında Forex işlemlerini kopyalamanıza olanak tanır ve Hedge ile Netting hesaplarını destekler. COPYLOT MT5 sürümü şunları destekler: - MT5 Hedge → MT5 Hedge - MT5 Hedge → MT5 Netting - MT5 Netting → MT5 Hedge - MT5 Netting → MT5 Netting - MT4 → MT5 Hedge - MT4 → MT5 Netting MT4 sürümü Tam açıklama + DEMO + PDF Nasıl satın alınır Nasıl kurul
Footprint Chart Pro — Professional OrderFlow EA for MetaTrader 5 Version 6.34 | Professional tool for real traders | Institutional-Grade Visualization DEMO USERS - PLEASE SELECT EVERY TICK / REAL TICK WHEN TESTING AND YOU HAVE DOWNLOADED HISTORICAL DATA. IF YOU SEE A WAITING SCREEN AND IT IS NOT DOWNLOADING, IT MEANS YOU HAVE LOW HISTORICAL DATA. TRY 1 MIN AND 5 MIN FIRST ON 1 DAY DATA. ONE DAY DATA SHOULD BE THE NEWEST AND MOST CURRENT DATE. PLEASE WAIT UNTIL THE MARKET HAS ROLLED OVER PERIOD.
Trade copier MT5
Alfiya Fazylova
4.58 (40)
Trade Copier, ticaret hesapları arasındaki işlemleri kopyalamak ve senkronize etmek için tasarlanmış profesyonel bir yardımcı programdır. Kopyalama, tedarikçinin hesabından/terminalinden alıcının aynı bilgisayarda veya vps'de kurulu olan hesabına/terminaline gerçekleşir. KAMPANYA - Eğer zaten "Trade copier MT5" aldıysanız, "Trade copier MT4"ü ücretsiz olarak alabilirsiniz (MT4 > MT5 ve MT4 < MT5 kopyalamalar için). Koşullar hakkında daha fazla bilgi almak için lütfen bizimle özel mesaj yoluyla i
Timeless Charts
Samuel Manoel De Souza
5 (3)
Timeless Charts , saniye grafikleri / saniye zaman dilimleri, renko grafikleri / renko çubukları, küme grafikleri / footprint grafikleri ve popüler platformlarda bulunan gelişmiş araçlar dahil olmak üzere, özel grafikler / özel zaman dilimleri arayan profesyonel traderlar için tasarlanmış gelişmiş bir grafik çözümüdür. Geleneksel çevrimdışı grafikler veya basit özel göstergelerden farklı olarak, bu çözüm gerçek zaman damgası doğruluğuna (milisaniye düzeyine kadar) sahip tamamen özel çubuklar ol
Bu ürün, haber saatlerinde tüm uzman danışmanları ve manüel grafikleri filtreler, böylece manüel ticaret kurulumlarınızı veya diğer uzman danışmanlar tarafından girilen işlemleri yok edebilecek ani fiyat dalgalanmaları konusunda endişelenmenize gerek kalmaz. Bu ürün, herhangi bir haber yayınlanmadan önce açık pozisyonlarınızı ve bekleyen emirlerinizi yönetebilen tam bir sipariş yönetim sistemi ile birlikte gelir.   The News Filter'ı   satın aldığınızda, gelecekteki uzman danışmanlar için yerleşi
Copy Cat More Trade Copier MT5 (Kopyalayıcı Kedi MT5) , günümüzün ticaret zorluklarına yönelik tasarlanmış yerel bir ticaret kopyalayıcısı ve eksiksiz risk yönetimi ve yürütme çerçevesidir. Prop firması zorluklarından kişisel portföy yönetimine kadar, sağlam yürütme, sermaye koruması, esnek yapılandırma ve gelişmiş ticaret işleme kombinasyonu ile her duruma uyum sağlar. Kopyalayıcı hem Master (gönderici) hem de Slave (alıcı) modunda çalışır, piyasa ve bekleyen emirlerin, ticaret değişikliklerini
MT5 to Telegram Signal Provider , hesabınızı bir sinyal sağlayıcı haline getirerek belirtilen sinyalleri Telegram'ın sohbetine, kanalına veya grubuna göndermeyi sağlayan kullanımı kolay, tamamen özelleştirilebilir bir araçtır. Rakip ürünlerin çoğunun aksine, DLL içe aktarması yapmaz. [ Demo ] [ Kılavuz ] [ MT4 Versiyonu ] [ Discord Versiyonu ] [ Telegram Kanalı ]  New: [ Telegram To MT5 ] Kurulum Adım adım bir kullanıcı kılavuzu mevcuttur. Telegram API'si hakkında bilgi gerekmemektedir; ihtiyac
HINN MAGIC ENTRY – the ultimate tool for entry and position management! Place orders by selecting a level directly on the chart! full description   ::  demo-version  :: 60-sec-video-description Key features: - Market, limit, and pending orders - Automatic lot size calculation - Automatic spread and commission accounting - Unlimited partitial take-profits  - Breakeven and trailing stop-loss and take-profit  functions - Invalidation leves - Intuitive, adaptive, and customizable interface - Works
Ultimate Extractor - Professional Trading Analytics for MT5 *****this is the local HTML version of Ultimate Extractor. !!!!!it is not compatible with Cloud!!!! For the online version please reach out to me directly****** Ultimate Extractor transforms your MetaTrader 5 trading history into actionable insights with comprehensive analytics, interactive charts, and real-time performance tracking. What It Does Automatically analyzes your MT5 trading history across all Expert Advisors and generates
AntiOverfit PRO: backtestler hakkındaki rahatsız edici gerçek O EA’yı satın almadan önce bir an dur. Az önce yıllık %250 vaat eden bir sistem buldun. Backtest mükemmel görünüyor. Satıcı 399 dolar, belki de 1.999 dolar istiyor. Kâğıt üzerinde her şey kusursuz görünüyor. Ama bir sorun var: o backtest senin düşündüğünü kanıtlamıyor. Geçmiş veriler tek başına pek bir şey kanıtlamaz. Kanıtladığı tek şey, o mantığın piyasadaki tek bir belirli fiyat dizisinde işe yaramış olmasıdır. Fiyat farklı bir yo
Limited time offer: 20% off for a few days only!  - Annual subscription $360 instead of $450  - Lifetime plan $550 instead of $690 The core idea: using the user interface, you configure the parameters the chart must meet before entering a position (or positions), choose which entry models to use, and set the rules for when trading and planning should end. Lazy Trader  handles the rest: it  takes over all the routine chart watching and execution! full description  :: 3 key videos [1] ->  [2]   -
The product will copy all telegram signal to MT5 ( which you are member) , also it can work as remote copier.  Easy to set up, copy order instant, can work with almost signal formats, image signal,  s upport to translate other language to English Work with all type of channel or group, even channel have "Restrict Saving Content", work with  multi channel, multi MT5 Work as remote copier: with signal have ticket number, it will copy exactly via ticket number. Support to backtest signal. How to s
Custom Alerts AIO: Tüm Piyasaları Takip Et — Hiçbir Kurulum Gerekmez Genel Bakış Custom Alerts AIO , hiçbir ek yapılandırma gerektirmeyen, kullanıma hazır bir piyasa izleme çözümüdür. Gerekli tüm göstergeler — FX Power, FX Volume, FX Dynamic, FX Levels, IX Power — iç yapısına gömülüdür. Grafik görüntülemesi olmadan çalışır, bu da onu sessiz ve verimli bir şekilde gerçek zamanlı alarm üretimi için mükemmel hale getirir. Brokerınızın sunduğu tüm varlık sınıflarını destekler: Forex, Metaller, End
Tum izleme listenizi asiri barlar icin tarayin - gercek zamanli. Power Bar Scanner tum sembollerinizi ayni anda izler ve asiri bir fiyat bari belirdiginde sizi aninda uyarir. Artik grafikler arasinda gecis yapmak yok. Her firsati tek bir panelde gorun. Her timeframe'de calisir. Forex, Endeksler, Altin, Crypto - hepsi tek bir gorunumde. Nasil calisir Tarayici, Market Watch'taki her sembolu mum govdesinin N x ATR 'yi astigi barlar icin kontrol eder. Birini buldugunda, sembol yon (BUY/SELL), ATR o
Trader Evolution
Siarhei Vashchylka
5 (7)
" Trader Evolution " - A utility designed for traders who use wave and technical analysis in their work. One tab of the utility is capable of money management and opening orders, and the other can help in making Elliott wave and technical analysis. Manual (Be sure to read before purchasing) | Version for MT4 Advantages 1. Trading in a few clicks. Immediate and pending orders are available in the panel 2. Money management. The program automatically selects the appropriate lot size 3. Simplifies
MT4 için Expert Advisor Risk Manager çok önemli ve bence her yatırımcı için gerekli bir program. Bu Uzman Danışman ile ticaret hesabınızdaki riski kontrol edebileceksiniz. Risk ve kar kontrolü hem parasal hem de yüzdesel olarak yapılabilir. [Instruction for Risk Manager parameters] Danışman işlevleri Bu risk yöneticisi, riskleri kontrol etmenize yardımcı olacaktır: - bir anlaşma için - günlük - bir hafta için - Bir ay için Ayrıca kontrol edebilirsiniz 1) Ticaret yaparken izin verilen ma
Telegram'dan MT5'e:   Nihai Sinyal Kopyalama Çözümü Telegram'dan MT5'e işlemlerinizi basitleştirin, DLL'lere ihtiyaç duymadan işlem sinyallerini doğrudan Telegram kanallarından ve sohbetlerinden MetaTrader 5 platformunuza kopyalayan modern araç. Bu güçlü çözüm hassas sinyal yürütme, kapsamlı özelleştirme seçenekleri sağlar, zamandan tasarruf sağlar ve verimliliğinizi artırır. [ Instructions and DEMO ] Temel Özellikler Doğrudan Telegram API Entegrasyonu Telefon numarası ve güvenli kod ile kimlik
Riskinizi otomatik olarak hesaplarken işlemlere hızlı bir şekilde girip çıkmanıza yardımcı olacak Ticaret Yöneticisi. Aşırı Ticaret, İntikam Ticareti ve Duygusal Ticaretten korunmanıza yardımcı olacak özellikler içerir. İşlemler otomatik olarak yönetilebilir ve hesap performans ölçümleri bir grafikte görselleştirilebilir. Bu özellikler, bu paneli tüm manuel yatırımcılar için ideal kılar ve MetaTrader 5 platformunun geliştirilmesine yardımcı olur. Çoklu Dil desteği. MT4 Sürümü  |  Kullanım Kılavu
Grid Manual MT5
Alfiya Fazylova
4.9 (21)
Grid Manual, sipariş ızgarasıyla çalışmak için kullanılan bir ticaret yardımcı programıdır. Yardımcı program evrenseldir, esnek ayarlara ve sezgisel bir arayüze sahiptir. Sadece kayıpların ortalaması yönünde değil, aynı zamanda kazanç artışı yönünde de bir emir ızgarası ile çalışır. Tüccarın bir emir ızgarası oluşturmasına ve eşlik etmesine gerek yoktur, bu yardımcı programı yapacaktır. Emri açmanız yeterlidir ve Grid manual otomatik olarak ona bir emir ızgarası oluşturacak ve kapanana kadar ona
Poc Breakout Signal: The Ultimate Institutional Order Flow & Price Action System Elevate your trading with Poc Breakout, a comprehensive technical analysis tool designed to bridge the gap between retail trading and institutional market understanding. This all-in-one system combines powerful Buy/Sell signals, advanced Volume Profile analysis, real-time Order Flow (Depth of Market), and critical macroeconomic data to give you a clear, unambiguous edge in the markets. Poc Breakout Signal decodes c
The Ultimate TradingView to MT5 Bridge Automation Manuel işlemleri ve gecikme sorunlarını durdurun. TradingView to MT5 Copier PRO , TradingView alarmlarınızı doğrudan MetaTrader 5 üzerinde yürütmek için en hızlı ve en güvenilir köprüdür (bridge). İster özel göstergeler, ister Strateji Test Komut Dosyaları veya manuel çizimler kullanın, bu Uzman Danışman (EA), Yüksek Hızlı WebSocket teknolojisini kullanarak işlemlerinizi anında gerçekleştirir. Basit kopyalayıcıların aksine, bu PRO sürüm Arena Sta
Equity Protect Pro: Endişesiz İşlem İçin Kapsamlı Hesap Koruma Uzmanınız Hesap koruması, öz sermaye koruması, portföy koruması, çoklu strateji koruması, kar koruması, kar toplama, işlem güvenliği, risk kontrol programları, otomatik risk kontrolü, otomatik tasfiye, koşullu tasfiye, planlı tasfiye, dinamik tasfiye, iz süren stop loss, tek tıklamayla kapatma, tek tıklamayla tasfiye ve tek tıklamayla geri yükleme gibi özellikler arıyorsanız, Equity Protect Pro ihtiyacınız olan programdır. Kurulumu
Cerberus Equity Watcher
Samuel Bandi Roccatello
5 (3)
Cerberus the Equity Watcher , hesap öz sermayenizi sürekli olarak izleyen ve hatalı EA'ların veya isteğe bağlı bir tüccarsanız duygusal davranışınızın neden olduğu büyük düşüşlerden kaçınan bir risk yönetimi aracıdır. Hatalar içerebilecek veya beklenmedik piyasa koşullarında iyi performans göstermeyebilecek EA'lara güvenen sistematik tüccarlar için son derece yararlıdır. Cerberus, bir minimum öz sermaye değeri ve (isteğe bağlı olarak) bir maksimum değer belirlemenize izin verir, bunlardan herhan
Yazarın diğer ürünleri
Auto Fibo DWM
Nikolay Mitrofanov
The indicator takes the last closed bar from three timeframes (daily, weekly, monthly) and draws Fibonacci levels based on the high and low prices of that bar. Depending on the opening and closing prices, the high and low are reversed. That is, if the candle is bullish, the low price is used as the starting price; otherwise, the high price is used. There's a second drawing option. Two opposing Fibonacci levels are drawn, each colored differently. Coincident levels and levels within the 0-100 ra
FREE
The utility draws pivot levels based on a selection from day week month The previous candlestick of the selected timeframe is taken and the values for the levels are calculated using the following formulas: Pivot = (high + close + low) / 3 R1 = ( 2 * Pivot) - low S1 = ( 2 * Pivot) - high R2 = Pivot + (R1 -S1) R3 = high + ( 2 * (Pivot - low)) S2 = Pivot - (R1 - S1) S3 = low - ( 2 * (high - Pivot)); The style and thickness for all lines are adjusted. The colors for the R, Pivot and S lines ar
FREE
RSI Chart Levels
Nikolay Mitrofanov
4.83 (6)
The indicator draws levels based on the overbought and oversold values ​​of the RSI indicator. The maximum values ​​are taken into account, which are equal to or exceeded certain limits. That is, for example, when the price has gone into the overbought zone, the highest price is selected from all prices in this zone for this period of time, and as soon as the indicator value returns to a value below the overbought value, the level is fixed and the calculation of new values ​​begins. The same
FREE
Mahisto Trend Chart
Nikolay Mitrofanov
5 (2)
The indicator makes calculations based on data obtained from one of seven (7) moving averages and colors the chart. Simple moving averages are those that have only one important calculation parameter - the period. The shift in the indicator is not used. There is a shift trick setting, it is used to smooth the result of calculations. You can see the changes if you reduce this parameter to 1 (minimum value). shift trick must always be less than the period value. Available averages: MA Simpl
FREE
Strong movement levels
Nikolay Mitrofanov
5 (2)
Looks for strong price movements and draws levels upon their completion. You determine the strength of the movement yourself by specifying in the settings the number of points and the number of candles of the same color in a row in one direction. There are 2 types of building in the settings: extrenum - high / low close - close price You can also adjust the number of displayed levels and the number of candles for calculations. By default, the settings indicate 5 levels for 360 candles. That
FREE
The indicator draws a normal chart by coloring it in colors based on prices calculated by the Heiken Ashi indicator algorithm. That is, the shape of the candles does not change. In fact, this is the same Heiken Ashi that does not distort the price chart. Then there will be a drawing of a cat, because there is nothing more to write about the indicator. .                                                       
FREE
The indicator highlights in color the places on the chart where the price moves in one direction continuously from the selected number of candles. You can specify the number of points from the beginning of the movement to select only movements from this amount. It can be useful for looking for reversals or sharp impulses. I also recommend purchasing this utility to determine local weekly / monthly trends and support and resistance lines. https://www.mql5.com/en/market/product/61401
FREE
The utility automatically sets the take-profit and stop-loss levels specified by the user in the parameters and moves the stop-loss line when the specified number of points above the trade price is exceeded. There are 4 trailing stop options: Disabled - Disabled Trail - Simply move the stop-loss level To breakeven - Move the stop-loss to breakeven when the value of points specified in the settings is exceeded and do not move the level any further As steps - Move the stop-loss to breakeven when
FREE
The indicator uses moving average reversal values ​​on all selected timeframes to plot levels where the moving average has reversed, which can be considered support or resistance levels, as well as trend change signals on the timeframe of the newly drawn line. The moving average is passed through the RSI indicator. The line colors are customizable and, by default, indicate the following: 1. Purple - the moving average has changed direction downwards. 2. Gold - the moving average has changed di
FREE
Trendline Equalizer
Nikolay Mitrofanov
1.5 (2)
When creating, modifying and moving a trend line, two anchor points will be selected: high / low, open / close, median or weighted from the candlestick prices. For high / low, open / close, if the anchor point is above the candlestick, the upper price will be taken, below the candlestick - the lower one. If the point is inside the candlestick, then if the first point is higher than the second, then the first one goes up, the second goes down. Conversely, if the second is higher than the first.
FREE
Calculates pivot levels. It paints the histogram depending on the location of prices relative to these levels. Parameter values: style - select the type of display (Histogram, Line, Arrow) price - price, has little effect on the final look, but this can be customized timeframe - select a timeframe for calculating levels. color over pivot line - color of everything above the pivot level color under pivot line - color of everything below the pivot level pivot line intersection color - the color
FREE
The utility draws reversal levels using the formulas for each of the selected number of candles: Pivot = (high + close + low) / 3 R1 = ( 2 * Pivot) - low S1 = ( 2 * Pivot) - high R2 = Pivot + (R1 -S1) R3 = high + ( 2 * (Pivot - low)) S2 = Pivot - (R1 - S1) S3 = low - ( 2 * (high - Pivot)) H = high L = low U = if the candle is bullish, then close. Otherwise - open D = if the candle is bullish, then open. Otherwise - close On any timeframe. After a new candle closes on the calculated timeframe
FREE
The indicator draws a colored histogram from comparisons of the strengths of bulls and bears. It works like this: The values ​​of two indicators Bears and Bulls are taken, who is stronger on the candlestick is compared, the column is filled in. It's all. .
FREE
The indicator draws levels based on the overbought and oversold values ​​of the RSI indicator. All timeframes are available. Can be enabled or disabled in any combination. The most recently closed overbought levels are selected based on the bar's closing price or the level of the first RSI indicator intersection with the 50% line. For more information, you can enable the display of RSI values ​​for the most recently closed bars (candles) and the current values ​​of all enabled indicators (upda
The indicator averages the price using one of four methods: Simple Exponential Linear Weighted Smoothed Tema Dema None Then filters the result through the RSI values. This results in a line drawn that approximates the trend change in the RSI peak zones. The last three screenshots show two indicators on a single chart with RSI high and low prices and the rest of the default parameters. The up color (red) for the high prices is set to None, while the down color (blue) for the low prices is set to
Filtrele:
Michael-MT5
449
Michael-MT5 2024.08.18 10:11 
 

Kullanıcı değerlendirmeye herhangi bir yorum bırakmadı

[Silindi] 2021.10.03 12:17 
 

Kullanıcı değerlendirmeye herhangi bir yorum bırakmadı

Nikolay Mitrofanov
17822
Geliştiriciden yanıt Nikolay Mitrofanov 2021.10.03 18:48
Всё показывает на всех таймфреймах. Обновляет и рисует линии только на H1.
Попробуйте на пустой график применить, потому что возможно, что другие утилиты или индикаторы очищают экран от объектов.
Değerlendirmeye yanıt