Pnitrol Levels

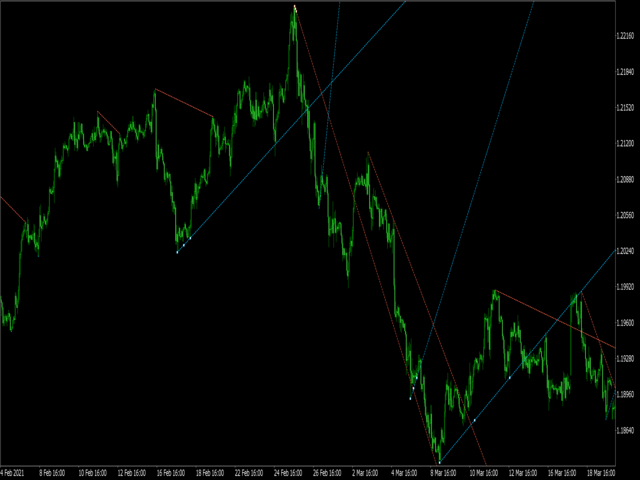
Draws trend lines from the high and / or low values ​​of the week.

The color and thickness of the levels are customizable.

All trend lines can be edited.

Suitable levels of the past can be renamed and other properties changed.

Levels are re-read only on the H1 timeframe once an hour.


...

⣿⣿⣿⣿⣿⣿⣿⣿⣿⣿⣿⣿⣿⣿⣿⣿⣿⣿⣿⣿⣿⣿⣿⣿⡟⣫⣿⣿⣿⣿

⣿⣿⣿⣿⣿⣿⣿⣿⣿⣿⣿⣿⣿⣿⣿⣿⣿⣿⣿⣿⣿⢿⠛⣩⣾⣿⣿⣿⣿⣿

⣿⣿⣿⣿⣿⣿⣿⣿⡛⠛⠛⠛⠛⠛⠛⢿⢻⣿⡿⠟⠋⣴⣾⣿⣿⣿⣿⣿⣿⣿

⣿⣿⣿⣿⡿⢛⣋⠉⠁⠄⢀⠠⠄⠄⠄⠈⠄⠋⡂⠠⣿⣿⣿⣿⣿⣿⣿⣿⣿⣿

⣿⣿⣿⣛⣛⣉⠄⢀⡤⠊⠁⠄⠄⠄⢀⠄⠄⠄⠄⠲⣾⣿⣿⣿⣿⣿⣿⣿⣿⣿

⣿⡿⠟⠋⠄⠄⡠⠊⠄⠄⠄⠄⠄⣀⣼⣤⣤⣤⣀⠄⠸⣿⣿⣿⣿⣿⣿⣿⣿⣿

⣿⠛⣁⡀⠄⡠⠄⠄⠄⠄⠄⠄⢠⣿⣿⣿⣿⣿⣿⣷⣶⣿⣿⣿⣿⣿⣿⣿⣿⣿

⣿⠿⢟⡉⠰⠁⠄⠄⠄⠄⠄⠄⠄⠙⠿⠿⢿⣿⣿⣿⣿⣿⣿⣿⣿⣿⣿⣿⣿⣿

⡇⠄⠄⠙⠃⠄⠄⠄⠄⠄⠄⠄⠄⠄⠄⠄⠄⠄⠈⠉⠉⠛⠛⠛⠻⢿⣿⣿⣿⣿

⣇⠄⢰⣄⠄⠄⠄⠄⠄⠄⠄⠄⠄⠄⠄⠄⠄⠄⠄⠄⠄⠄⠄⠄⠄⠄⠉⠻⣿⣿

⣿⠄⠈⠻⣦⣤⡀⠄⠄⠄⠄⠄⠄⠄⠄⠄⠄⠄⠄⠄⠄⠄⠄⠄⠄⠄⠄⣦⠙⣿

⣿⣄⠄⠚⢿⣿⡟⠄⠄⠄⢀⡀⠄⠄⠄⠄⠄⠄⠄⠄⠄⠄⠄⠄⠄⠄⢀⣿⣧⠸

⣿⣿⣆⠄⢸⡿⠄⠄⢀⣴⣿⣿⣿⣿⣷⣶⣶⣶⣶⠄⠄⠄⠄⠄⠄⢀⣾⣿⣿⠄

⣿⣿⣿⣷⡞⠁⢀⣴⣿⣿⣿⣿⣿⣿⣿⣿⣿⣿⣿⣧⡀⠄⠄⣠⣾⣿⣿⣿⣿⢀

⣿⣿⣿⡿⠁⢠⣿⣿⣿⣿⣿⣿⣿⣿⣿⣿⣿⣿⣿⣿⡿⠄⠄⠘⣿⣿⡿⠟⢃⣼

⣿⣿⠏⠄⠠⣿⣿⣿⣿⣿⣿⣿⣿⣿⣿⣿⣿⠿⠛⠉⢀⡠⢄⡠⡭⠄⣠⢠⣾⣿

⠏⠄⠄⣸⣾⣿⣿⣿⣿⣿⣿⣿⣿⣿⡟⠁⠄⢀⣦⣒⣁⣒⣩⣄⣃⢀⣮⣥⣼⣿

⣿⣿⣿⣿⣿⣿⣿⣿⣿⣿⣿⣿⣿⣿⣿⣿⣿⣿⣿⣿⣿⣿⣿⣿⣿⣿⣿⣿⣿⣿

추천 제품
Free automatic Fibonacci is an indicator that automatically plots a Fibonacci retracement based on the number of bars you select on the BarsToScan setting in the indicator. The Fibonacci is automatically updated in real time as new highest and lowest values appears amongst the selected bars. You can select which level values to be displayed in the indicator settings. You can also select the color of the levels thus enabling the trader to be able to attach the indicator several times with differe
FREE
Important Lines
Terence Gronowski
4.88 (24)
This indicator displays Pivot-Lines, preday high and low, preday close and the minimum and maximum of the previous hour. You just have to put this single indicator to the chart to have all these important lines, no need to setup many single indicators. Why certain lines are important Preday high and low : These are watched by traders who trade in a daily chart. Very often, if price climbs over or falls under a preday low/high there is an acceleration in buying/selling. It is a breakout out of a
FREE
PZ Penta O MT5
PZ TRADING SLU
3.5 (4)
The Penta-O is a 6-point retracement harmonacci pattern which usually precedes big market movements. Penta-O patterns can expand and repaint quite a bit. To make things easier this indicator implements a twist: it waits for a donchian breakout in the right direction before signaling the trade. The end result is an otherwise repainting indicator with a very reliable trading signal. The donchian breakout period is entered as an input. [ Installation Guide | Update Guide | Troubleshooting | FAQ | A
FREE
Donchian Breakout And Rsi
Mattia Impicciatore
4.5 (2)
개요 이 지표는 클래식 돈치안 채널(Donchian Channel) 의 향상된 버전으로, 실전 트레이딩을 위한 다양한 기능이 추가되었습니다. 표준 세 개의 선(상단, 하단, 중앙선) 외에도 브레이크아웃 을 감지하여 차트에 화살표로 시각적으로 표시하며, 차트를 깔끔하게 보기 위해 현재 추세 방향의 반대 라인만 표시 합니다. 지표 기능: 시각적 신호 : 브레이크아웃 시 컬러 화살표 표시 자동 알림 : 팝업, 푸시 알림, 이메일 RSI 필터 : 시장의 상대 강도를 기반으로 신호 검증 사용자 맞춤 설정 : 색상, 선 두께, 화살표 코드, RSI 임계값 등 동작 원리 돈치안 채널은 다음을 계산합니다: 상단선 : 최근 N개의 종가 완료 캔들에서 가장 높은 고가 하단선 : 최근 N개의 종가 완료 캔들에서 가장 낮은 저가 중앙선 : 고가와 저가의 평균값 상방 브레이크아웃 은 종가가 상단선을 돌파할 때 발생하며, 하방 브레이크아웃 은 종가가 하단선 아래로 내려갈 때 발생합니다. 이 지표는: 세 개의
FREE
Statistical Arbitrage Spread Generator for Cointegration [MT5] What is Pair Trading? Pair trading is a market-neutral strategy that looks to exploit the relative price movement between two correlated assets — instead of betting on the direction of the market. The idea? When two assets that usually move together diverge beyond a statistically significant threshold, one is likely mispriced. You sell the expensive one, buy the cheap one , and profit when they converge again. It’s a statistica
FREE
Follow The Line MT5
Oliver Gideon Amofa Appiah
4.6 (35)
This indicator obeys the popular maxim that: "THE TREND IS YOUR FRIEND" It paints a GREEN line for BUY and also paints a RED line for SELL. (you can change the colors). It gives alarms and alerts of all kinds. IT DOES NOT REPAINT and can be used for all currency pairs and timeframes. Yes, as easy and simple as that. Even a newbie can use it to make great and reliable trades. NB: For best results, get my other premium indicators for more powerful and reliable signals. Get them here: https://www.m
FREE
Daily Support and Resistance Levels 는 클래식 피벗 포인트 방식으로 일중 거래 핵심 가격 레벨을 자동 계산/표시하는 전문 지표입니다. 주요 기능: 피벗 포인트(PP) 자동 계산 3개의 저항 레벨(R1, R2, R3) 3개의 지지 레벨(S1, S2, S3) 전일 고가/저가 표시 실시간 정보 패널 상승/하락 바이어스 표시 최근 레벨까지 거리 표시 색상/표시 완전 사용자 설정 매일 자동 업데이트 모든 타임프레임 지원 계산 방식: 전일 고가/저가/종가 기반 클래식 피벗 포인트. 트레이딩 활용: 지지/저항 반등 매매 돌파 전략 레인지 거래 방향성 판단 목표가 설정 사용 방법: 차트에 인디케이터 적용 레벨 자동 생성 가격 > PP = 상승 바이어스 가격 < PP = 하락 바이어스 S1-S3 = 지지 구간 R1-R3 = 저항 구간 설정 옵션: 피벗/지지/저항 색상 라인 굵기/스타일 가격 라벨 표시/숨기기 정보 패널 ON/OFF 패널 위치/폰트 크기 전일 고가/저가 표
FREE
FlatBreakout MT5
Aleksei Vorontsov
FlatBreakout MT5 (Free Version) Flat Range Detector and Breakout Panel for MT5 — GBPUSD Only FlatBreakout MT5   is the free version of the professional FlatBreakoutPro MT5 indicator, specially designed for flat (range) detection and breakout signals on the   GBPUSD   pair only. Perfect for traders who want to experience the unique fractal logic of FlatBreakout MT5 and test breakout signals on a live market without limitations. Who Is This Product For? For traders who prefer to trade breakout of
FREE
Haven Key Levels PDH PDL
Maksim Tarutin
5 (8)
"Haven Key Levels PDH PDL"   인디케이터는 트레이더가 차트에서 핵심 레벨을 시각화하는 데 도움을 줍니다. 다음 레벨을 자동으로 표시합니다: DO (Daily Open)   — 일일 시가. NYM (New York Midnight)   — 뉴욕 자정 레벨. PDH (Previous Day High)   — 전일 고가. PDL (Previous Day Low)   — 전일 저가. WO (Weekly Open)   — 주간 시가. MO (Monthly Open)   — 월간 시가. PWH (Previous Week High)   — 전주 고가. PWL (Previous Week Low)   — 전주 저가. CMH (Current Month High)   — 당월 고가. CML (Current Month Low)   — 당월 저가. PMH (Previous Month High)   — 전월 고가. PML (Previous Month Low)   — 전월 저가. 다른
FREE
DF Fib Trader Pro DF Fib Trader Pro는 MetaTrader 5용으로 설계된 자동 거래 시스템입니다. 피보나치 기반 가격 수준과 추세 및 구조 분석을 결합하여 진입 및 청산 시점을 정의합니다. EA는 롱 포지션과 숏 포지션을 모두 지원하며, 내장된 위험 관리 매개변수를 포함합니다. 핵심 기능: • 피보나치 되돌림 및 확장 로직을 사용하여 진입, 손절매, 이익실현 시점을 표시합니다. • 랏 크기 및 손절매/이익실현 수준 설정 가능 • 진입 시점 1개 또는 2개 선택 가능 • 시장 상황에 따라 고정 또는 동적 손절매 및 이익실현 지원 • 다양한 시간대 및 통화쌍 지원 • 최대 스프레드, 슬리피지, 거래 빈도 제어 옵션 포함 • 자동 거래 관리: 손익분기점, 트레일링 손절매, 부분 청산 옵션 • 원하는 경우 시장가 주문 지원 입력 개요: • 위험 관리: 랏 크기, 거래당 위험, 최대 거래 수 • 진입 조건: 피보나치 레벨 선택, 추세 필터 옵션 • 청산 관리:
FREE
LT Donchian Channel
Thiago Duarte
4.86 (7)
Donchian Channel is an indicator created by Richard Donchian. It is formed by taking the highest high and the lowest low of the last specified period in candles. The area between high and low is the channel for the chosen period. Its configuration is simple. It is possible to have the average between the upper and lower lines, plus you have alerts when price hits one side. If you have any questions or find any bugs, please contact me. Enjoy!
FREE
Easy Correlations Indicator The Easy Correlations Indicator is designed to help traders analyze the relationship between two correlated instruments. By monitoring the distance between their Relative Strength Index (RSI) values, the indicator highlights situations where one instrument has moved significantly further than the other. This creates potential trading opportunities: Sell the stronger instrument (overstretched RSI) Buy the weaker instrument (lagging RSI) Because the positions are opened
FREE
Trendline mt5 indicator
David Muriithi
4 (2)
Are you tired of drawing trendlines every time you're analyzing charts? Or perhaps you would like more consistency in your technical analysis. Then this is for you. This indicator will draw trend lines automatically when dropped on a chart. How it works Works similar to standard deviation channel found on mt4 and mt5. It has 2 parameters: 1. Starting Bar 2. Number of bars for calculation The   starting bar   is the bar which drawing of the trend lines will begin, while the   number of bars for c
FREE
Pivot Point Fibo RSJ
JETINVEST
4.38 (21)
피봇 포인트 Fibo RSJ는 피보나치 비율을 사용하여 당일의 지지선과 저항선을 추적하는 지표입니다. 이 멋진 지표는 피보나치 비율을 사용하여 피벗 포인트를 통해 최대 7단계의 지지와 저항을 생성합니다. 가격이 작업의 가능한 진입/종료 지점을 인식할 수 있는 이 지원 및 저항의 각 수준을 어떻게 존중하는지 환상적입니다. 특징 최대 7단계 지원 및 7단계 저항 레벨의 색상을 개별적으로 설정 입력 피벗 유형 피벗 피보 RSJ1 = 피보 비율 1 계산 피벗 피보 RSJ2 = 피보 비율 2 계산 피벗 Fibo RSJ3 = Fibo 비율 3 계산 피벗 피보 클래식 = 클래식 피벗 계산 최소 피벗 수준 피벗 3 레벨 피벗 4 레벨 피벗 5 레벨 6단계 피벗 피벗 7 레벨 여전히 질문이 있는 경우 다이렉트 메시지로 저에게 연락하십시오: https://www.mql5.com/ko/users/robsjunqueira/
FREE
MACD Enhanced
Nikita Berdnikov
5 (3)
Introducing the MACD  Enhanced – an advanced MACD (Moving Average Convergence Divergence) indicator that provides traders with extended capabilities for trend and momentum analysis in financial markets. The indicator uses the difference between the fast and slow exponential moving averages to determine momentum, direction, and strength of the trend, creating clear visual signals for potential entry and exit points. Attention! To achieve the best results, it is recommended to adapt the indicator
FREE
The indicator identifies when a divergence occurs between price and an indicator or oscillator. It identifies both regular and hidden divergences. Combined with your own rules and techniques, this indicator will allow you to create (or enhance) your own powerful system. For higher probability setups I can recommend you to use my Supply Demand indicator and trade only if the divergence occurs inside a zone. Supply zone for bearish div and demand zone for bullish div. The optimal scenario is if it
FREE
ProTrade Technical Assistant 자동 지원/저항 구역 감지, 공정 가치 갭(FVG) 식별, 피보나치 되돌림 레벨을 갖춘 전문적인 시장 구조 분석 인디케이터입니다. 제품 기능 ProTrade Technical Assistant 는 주요 시장 구조 요소를 자동으로 식별하여 MT5 차트에 직접 표시합니다: 지원 및 저항 구역 - 스윙 고점/저점 기반 자동 감지 공정 가치 갭 (FVG) - 3 캔들 불균형 패턴 감지 피보나치 되돌림 - 최근 스윙 포인트 기반 자동 표시 원클릭 제어 - 인디케이터 재첨부 없이 기능 온/오프 전환 프라이스 액션 트레이더, 기관 스타일 트레이더, 그리고 수동 그리기 없이 시장 구조 자동 감지를 원하는 모든 분께 적합합니다. 주요 기능 지원 및 저항 구역 최근 가격 동작을 스캔하여 중요한 스윙 포인트 식별 주요 가격 수준에 채워진 사각형 구역 표시 지원 (SUP) 과 저항 (RES) 을 구분하는 색상 코드 라벨 감도 및 구역 간 최소 거리 설정
Second Level Candles And Alligator Indicators 每12秒产生一个K线,而且自带Alligator指标,对超短线选手交易非常有帮助。程序启动时可能不成功,是因为MT5 MqlTick 数据加载少的原因。可以通过修改显示的数据参数避免,比如display=100,程序正常之后再将参数调大 display=300 。如果数据不正常,也可以采用重新加载的方式解决。 如果您对这个指标有任何建议,请联系作者。  Second Level Candles And Alligator Indicators  produced a candle per 12 seconds,include Alligator, it's helpful to Short-Term Trading。You'd better reload the indicator every start MT5 or change display parameter to reslove data bug. Please attach author when  you had some su
FREE
Heiken Ashi fxam
Ely Alsedy
5 (1)
헤이킨 아시 MT5 인디케이터 헤이킨 아시 MT5 인디케이터는 표준 가격 데이터를 더 부드럽고 추세 중심의 캔들스틱으로 변환하여 시장 트렌드와 잠재적인 역전 지점을 더 쉽게 식별할 수 있도록 하는 강력한 도구입니다. 주요 특징: 명확한 트렌드 식별: 다른 캔들 색상으로 상승 추세와 하락 추세를 시각적으로 구분합니다. 노이즈 감소: 가격 변동을 필터링하여 시장의 주요 움직임을 더 명확하게 표시합니다. 조기 트렌드 감지: 표준 차트에서 트렌드 변화가 명확해지기 전에 잠재적인 트렌드 변화를 예측합니다. 다용도성: 독립적으로 사용하거나 다른 기술적 지표와 함께 종합적인 분석에 사용할 수 있습니다. 사용자 정의 설정: 인디케이터를 특정 거래 선호도와 전략에 맞게 조정할 수 있습니다. 장점: 트렌드를 식별하고 잠재적인 진입 및 청산 지점을 파악하는 능력을 향상시킵니다. 시장 노이즈의 영향을 줄이고 중요한 가격 변동에 집중합니다. 시장 역학에 대한 더 명확한 이해를 바탕으로 더 나은 거래 결정
FREE
High Low Open Close
Alexandre Borela
4.98 (44)
이 프로젝트를 좋아한다면 5 스타 리뷰를 남겨주세요. 이 지표는 열리고, 높은, 낮은 및 마감 가격을 지정합니다. 기간과 그것은 특정한 시간대를 위해 조정될 수 있습니다. 이들은 많은 기관 및 전문가에 의해 보는 중요한 수준입니다 상인은 당신이 더 많은 것일 수있는 장소를 알고 도움이 될 수 있습니다 이름 * 사용 가능한 기간: 이전 날. 이전 주. 지난 달. 이전 분기. 이전 연도. 또는: 현재 날. 현재 주. 현재 달. 현재 분기. 현재 년.
FREE
Introduction Welcome to the world of Forex trading, where every tick of the market can be influenced by news events. Introducing our expert advisor for MetaTrader, your ultimate tool for navigating the complexities of news trading. This innovative advisor is specifically designed to automate your trading strategy during key macroeconomic releases, ensuring you never miss an opportunity.  When important indicators are announced, volatility often spikes, creating potential for profit. Our expert
FREE
MT5용 NAS100 Auto SL 및 TP 메이커를 소개합니다: 메타트레이더 5에서 나스닥 100 시장을 탐색하는 트레이더에게 없어서는 안될 보조 도구인 NAS100 Auto SL 및 TP 메이커로 손절 및 테이크프로핏 설정을 다시는 놓치지 마세요. 이 도구는 손절 및 테이크프로핏 레벨을 자동으로 관리할 수 있는 원활한 솔루션을 찾는 분들을 위해 설계되었습니다. 주요 특징: 손쉬운 자동화: 스톱로스 및/또는 테이크프로핏 없이 나스닥 100 거래를 자동으로 모니터링합니다. 사용자가 구성한 설정에 따라 레벨을 동적으로 조정합니다. 다양한 주문 유형: 나스닥 100의 시장가 및 지정가 주문 모두와 호환됩니다. 메타트레이더 5에서 사용할 수 있는 다양한 주문 유형을 지원합니다. 맞춤형 구성: 사용자 친화적인 매개변수 설정으로 추적 기본 설정 및 손절/익절 수준을 사용자 지정할 수 있습니다. 유연한 범위: 실행되는 특정 NAS100 상품 또는 거래되는 모든 상품에 대해 손절 및 테이크프
FREE
Candle Countdown — MT5용 정확한 캔들 종료 시간 카운트다운 Candle Countdown은 차트 위에 현재 캔들이 종료될 때까지 남은 시간 을 표시하는 간단하고 정확한 도구입니다. 진입 시점이 캔들 마감에 의존하는 경우, 몇 초의 차이도 중요합니다. 이 인디케이터는 정확한 시간을 보여주어 서두르거나 추측하지 않고 결정을 내릴 수 있도록 도와줍니다. 캔들 종료 시간을 정확하게 제어하기 위한 인디케이터입니다. 표시 내용: 캔들 종료까지 남은 시간 현재 서버 시간 스프레드 Stop Level 타이머는 틱에 의존하지 않고 플랫폼의 내부 타이머를 통해 업데이트되므로, 시장 움직임이 적은 상황에서도 안정적으로 동작합니다. 이로 인해 낮은 변동성 구간에서도 부드럽고 안정적인 카운트다운을 제공합니다. 모든 정보는 배경 블록에 표시되어 어떤 차트 색상에서도 잘 보이며, 차트 분석을 방해하지 않습니다. 캔들 종료 시점이 가까워질수록 타이머 색상이 변경되어 빠르게 상황을 파악할 수
FREE
Coral Indi
Dinh Duong Luong
Coral trend is   a trend-following indicator that is widely popular among FOREX traders . It is usually used as a confluence with other indicators. It uses combinations of moving averages with complex smoothing formulas! It has two configurable parameters: Coefficient   - smoothing ratio (*) Applied price Calculation: Coral = (-0.064) * B6 + 0.672 * B5 - 2.352 * B4 + 2.744 * B3
FREE
Enhanced Volume Profile: The Ultimate Order Flow & Liquidity Analysis Tool Overview Enhanced Volume Profile is an indicator for MetaTrader 5 that displays the traded volume at specific price levels over a defined period. It separates the total volume into buy and sell components, presenting them as a side-by-side histogram on the chart. This allows users to observe the volume distribution and the proportion of buy and sell volumes at each price level. Graphics Rendering The indicator uses the
FREE
Gold Hunters Scope
Vishnu Bajpai
5 (1)
Hunter’s Scope: 변동성 및 추세 강도 지표 (MT5) Hunter’s Scope는 방향성 강도와 변동성을 모두 필터링하여 가격 확장을 식별하는 MetaTrader 5용 고모멘텀 지표입니다. 유의미한 임펄스(충동) 캔들을 감지하도록 설계되어 모멘텀 기반 거래를 위한 명확하고 객관적인 신호를 제공합니다. 핵심 로직: 이중 레이어 필터 지연된 교차(Crossover) 방식 대신 Hunter’s Scope는 두 가지 확인 모델을 사용합니다: 추세 강도 (ADX): ADX가 사용자가 정의한 임계값을 초과할 때만 신호가 트리거되어 횡보장이나 저모멘텀 시장을 걸러냅니다. 변동성 확장 (ATR): 특정 ATR 배수를 초과하는 캔들만 임펄스로 간주하여 해당 움직임이 통계적으로 유의미함을 보장합니다. 주요 특징 비재계산(Non-Repainting): 신호는 캔들이 완성된 후 생성되어 고정됩니다. 모멘텀 중심: 반응이 느린 지표가 아닌 임펄스 움직임을 타겟팅합니다. 통합 진단 패널: ADX
FREE
RSI abcd
Francisco Gomes Da Silva
4.33 (3)
RSI ABCD 패턴 파인더: 기술적 전략 1. 지표 작동 방식 클래식 RSI 와 ABCD 하모닉 패턴 자동 감지를 결합합니다. 주요 구성 요소 표준 RSI (조정 가능한 기간) 고점 및 저점 마커 (화살표) ABCD 패턴 (초록/빨강 선) 과매수 (70) 및 과매도 (30) 필터 2. MT5 설정 period = 14 ; // RSI 기간 size = 4 ; // 최대 패턴 크기 OverBought = 70 ; // 과매수 수준 OverSold = 30 ; // 과매도 수준 Filter = USE_FILTER_ YES ; // 확인 필터 3. 트레이딩 전략 3.1. 매수 진입 (강세 ABCD) 조건: RSI가 다음을 형성: 저점 ( A ) → 고점 ( B ) → 더 높은 저점 ( C ) D 는 과매도 (30) 위지만 C 아래 확인: A-B-C-D 연결 초록 선 목표: TP1: B-C의 61.8% TP2: B-C의 100% 손절: D 아래 3.2. 매도 진입 (약세 ABCD) 조건:
FREE
Volume Weighted Average Price or VWAP is an indicator wich shows different average prices on chart. This is very useful to find strong negotiation price areas and as trend following. Configurations: Day, Week and Month - Show different VWAPs according to the period. You can change each line style on "colors" tab. Any doubt or suggestion please contact us. Enjoy! This is a free indicator, but it took hours to develop. If you want to pay me a coffee, I appreciate a lot   <3 PayPal, Skrill, Nete
FREE
Pivot MT5
Dmitrij Isaenko
The indicator draws daily support and resistance lines on the chart, as well as the Pivot level (reversal level). Adapted to work in MT5 The standard timeframe for calculating support and resistance levels is D1. You can choose other timeframes according to your strategy (for example, for M1-M15, the optimal timeframe for calculations is H1) The function for calculating support and resistance levels has been updated; in this calculation option, fibonacci levels are taken into account, respec
FREE
이 작은 도구는 차트에서 간단한 선을 드래그하여 위험 관리를 정의하는 데 도움이 됩니다. 계정 % 또는 라인에서 직접 고정 금액으로 계산된 실제 로트 크기를 보여줍니다. 당신이 해야 할 일은 키보드의 "t" 키를 눌러 라인을 활성화하고 라인을 손실 정지 지점으로 드래그하는 것입니다. 그게 다야. 설정에서 선과 텍스트의 색상과 너비, 선과 오른쪽 사이의 텍스트 공간을 정의할 수 있으며 계정 비율 또는 고정 금액 크기로 위험을 설정할 수 있습니다. 질문이나 희망사항이 있으시면 언제든지 문의해 주세요. 이 작은 도구는 차트에서 간단한 선을 드래그하여 위험 관리를 정의하는 데 도움이 됩니다. 계정 % 또는 라인에서 직접 고정 금액으로 계산된 실제 로트 크기를 보여줍니다. 당신이 해야 할 일은 키보드의 "t" 키를 눌러 라인을 활성화하고 라인을 손실 정지 지점으로 드래그하는 것입니다. 그게 다야. 설정에서 선과 텍스트의 색상과 너비, 선과 오른쪽 사이의 텍스트 공간을 정의할 수
FREE
이 제품의 구매자들이 또한 구매함
Trade Assistant MT5
Evgeniy Kravchenko
4.42 (208)
거래당 위험 계산, 라인을 사용한 손쉬운 신규 주문, 부분 청산 기능을 통한 주문 관리, 7가지 유형의 트레일링 스탑 및 기타 유용한 기능을 제공합니다. 추가 자료 및 지침 설치 지침   -   애플리케이션 지침   -   데모 계정용 애플리케이션 평가판 라인 기능       - 차트에 개시선, 손절매, 차익실현을 표시합니다. 이 기능을 사용하면 새로운 주문을 쉽게 하고 개봉 전에 추가 특성을 볼 수 있습니다. 위기 관리       -       위험 계산 기능은 설정된 위험과 손절매 주문의 크기를 고려하여 새 주문의 볼륨을 계산합니다. 이를 통해 손절매 크기를 설정하고 동시에 설정된 위험을 존중할 수 있습니다. 로트 계산 버튼 - 위험 계산을 활성화/비활성화합니다. 필요한 위험 값은 위험 필드에 0에서 100 사이의 백분율 또는 예금 통화로 설정됩니다. 설정 탭에서 위험 계산 옵션을 선택합니다. $ 통화, % 잔액, % 지분, % 자유 마진, % 사용자 정의, % AB 이전
Trade Manager EA에 오신 것을 환영합니다. 이 도구는 거래를 보다 직관적이고 정확하며 효율적으로 만들기 위해 설계된 궁극적인 리스크 관리 도구 입니다. 단순한 주문 실행 도구가 아닌, 원활한 거래 계획, 포지션 관리 및 리스크 제어를 위한 종합 솔루션입니다. 초보자부터 고급 트레이더, 빠른 실행이 필요한 스캘퍼에 이르기까지 Trade Manager EA는 외환, 지수, 상품, 암호화폐 등 다양한 시장에서 유연성을 제공합니다. Trade Manager EA를 사용하면 복잡한 계산은 이제 과거의 일이 됩니다. 시장을 분석하고 진입, 손절 및 익절 수준을 차트의 수평선으로 표시한 후 리스크를 설정하면, Trade Manager가 이상적인 포지션 크기를 즉시 계산하고 SL 및 TP 값을 실시간으로 표시합니다. 모든 거래가 간편하게 관리됩니다. 주요 기능: 포지션 크기 계산기 : 정의된 리스크에 따라 거래 크기를 즉시 결정합니다. 간단한 거래 계획 : 진입, 손절, 익절을 위한
Local Trade Copier EA MT5
Juvenille Emperor Limited
4.96 (135)
Local Trade Copier EA MT5 를 사용하여 매우 빠른 거래 복사 경험을 해보세요. 1분 안에 간편하게 설정할 수 있으며, 이 거래 복사기를 사용하면 Windows 컴퓨터 또는 Windows VPS에서 여러 개의 MetaTrader 터미널 간에 거래를 0.5초 미만의 초고속 복사 속도로 복사할 수 있습니다. 초보자든 전문가든   Local Trade Copier EA MT5 는 다양한 옵션을 제공하여 사용자의 특정 요구에 맞게 맞춤 설정할 수 있습니다. 이는 수익 잠재력을 높이려는 모든 사람을 위한 최고의 솔루션입니다. 지금 사용해보시고 이것이 왜 시장에서 가장 빠르고 쉬운 무역용 복사기인지 알아보세요! 팁: 여기 에서 데모 계정에서 Local Trade Copier EA MT5 데모 버전을 다운로드하여 사용해 볼 수 있습니다. 다운로드한 무료 데모 파일을 MT5 >> File >> Open Data Folder >> MQL5 >> Experts 폴더에 붙여넣고 터
TradePanel MT5
Alfiya Fazylova
4.87 (151)
Trade Panel은 다기능 거래 도우미입니다. 이 애플리케이션에는 50개 이상의 수동 거래 기능이 포함되어 있으며 대부분의 거래 작업을 자동화할 수 있습니다. 주의! 할인은 시간 제한이 있으며, 매주 화요일마다 가격이 5달러씩 인상됩니다. (최대 100달러까지). 구매하기 전에 데모 계정에서 데모 버전을 테스트할 수 있습니다. 데모 계정용 애플리케이션 체험판 다운로드: https://www.mql5.com/en/blogs/post/750865 . 전체 지침 여기 . 거래. 한 번의 클릭으로 거래를 수행할 수 있습니다: 리스크 자동 계산과 함께 예약 주문 및 포지션 열기. 한 번의 클릭으로 여러 주문 및 포지션 열기. 주문 그리드 열기. 예약 주문 및 포지션을 그룹별로 닫기. 포지션 방향 전환 (Buy 닫기 > Sell 열기, Sell 닫기 > Buy 열기). 포지션 잠금 (부족한 포지션을 열어 Buy와 Sell 포지션의 수량을 동일하게 만들기). 모든 포지션 한 번의 클릭으로 부
베타 출시 Telegram to MT5 Signal Trader 는 곧 공식 알파 버전을 출시할 예정입니다. 일부 기능은 아직 개발 중이며, 작은 버그가 발생할 수 있습니다. 문제가 있으면 꼭 보고해 주세요. 여러분의 피드백은 소프트웨어 개선에 도움이 됩니다. Telegram to MT5 Signal Trader 는 Telegram 채널 또는 그룹의 거래 신호를 자동으로 MetaTrader 5 계정으로 복사하는 강력한 도구입니다. 공개 및 비공개 채널을 모두 지원하며, 여러 신호 제공자를 여러 MT5 계정에 연결할 수 있습니다. 소프트웨어는 빠르고 안정적으로 동작하며, 복사된 거래를 완벽히 제어할 수 있습니다. 인터페이스는 깔끔하며 대시보드와 차트가 시각적으로 구성되어 있고, 직관적인 네비게이션이 가능합니다. 여러 Signal Account를 관리하고, 공급자별 설정을 세밀하게 조정하며, 모든 동작을 실시간으로 모니터링할 수 있습니다. 필수 조건 MQL의 제한으로 인해 EA는 Te
Farmed Hedge Yield Farming | All Markets (Manual - Hybrid - Semi/Automated EA) MULTI-ASSET SUPPORT Trade any asset available on your broker - Forex: Major, Minor, Exotic pairs - Crypto: BTC, ETH, XRP, SOL, BNB - Stocks: Apple, Tesla, Amazon, Google, etc. - Commodities: Gold, Silver, Oil, Gas - Indices: US30, NAS100, SPX500, DAX40 - Any CFD your broker offers VERIFIED TRADING RESULTS - Farmed Hedge Yield Axi Copy:  https://www.mql5.com/en/signals/2356376 - Farmed Hedge Yield Exn Copy:   https:/
Trade Dashboard MT5
Fatemeh Ameri
4.94 (121)
Tired of complex order placement and manual calculations? Trade Dashboard is your solution. With its user-friendly interface, placing orders becomes effortless, by a single click, you can open trades, set stop loss and take profit levels, manage trade lot size, and calculate risk to reward ratios, allowing you to only focus on your strategy. Say goodbye to manual calculations and streamline your trading experience with Trade Dashboard. Download  Demo Version  right now. You can find  Details of
Exp COPYLOT CLIENT for MT5
Vladislav Andruschenko
3.82 (34)
MetaTrader 5용 전문 트레이드 복사기 MetaTrader 용 빠르고 전문적이며 신뢰할 수 있는 트레이드 복사기 입니다. COPYLOT 은 MT4와 MT5 터미널 간의 Forex 거래 복사를 지원하며, Hedge 및 Netting 계좌를 모두 지원합니다. COPYLOT MT5 버전 지원 구성: - MT5 Hedge → MT5 Hedge - MT5 Hedge → MT5 Netting - MT5 Netting → MT5 Hedge - MT5 Netting → MT5 Netting - MT4 → MT5 Hedge - MT4 → MT5 Netting MT4 버전 전체 설명 + DEMO + PDF 구매 방법 설치 방법 로그 파일 확인 방법 테스트 및 최적화 방법 Expforex의 모든 제품 MT4 터미널로도 거래를 복사할 수 있습니다(MT4 → MT4, MT5 → MT4): COPYLOT CLIENT for MT4 COPYLOT은 2개, 3개, 심지어 10개의 터미널과 동시에 작동할
Footprint Chart Pro — Professional OrderFlow EA for MetaTrader 5 Version 6.34 | Professional tool for real traders | Institutional-Grade Visualization DEMO USERS - PLEASE SELECT EVERY TICK / REAL TICK WHEN TESTING AND YOU HAVE DOWNLOADED HISTORICAL DATA. IF YOU SEE A WAITING SCREEN AND IT IS NOT DOWNLOADING, IT MEANS YOU HAVE LOW HISTORICAL DATA. TRY 1 MIN AND 5 MIN FIRST ON 1 DAY DATA. ONE DAY DATA SHOULD BE THE NEWEST AND MOST CURRENT DATE. PLEASE WAIT UNTIL THE MARKET HAS ROLLED OVER PERIOD.
Trade copier MT5
Alfiya Fazylova
4.58 (40)
Trade Copier는 거래 계정 간의 거래를 복사하고 동기화하도록 설계된 전문 유틸리티입니다. 복사는 공급자의 계정/단말기에서 동일한 컴퓨터 또는 vps에 설치된 수신자의 계정/단말기로 발생합니다. 프로모션 - 이미 "Trade copier MT5"를 구매하셨다면, "Trade copier MT4"를 무료로 받으실 수 있습니다 (MT4 → MT5 및 MT4 ← MT5 복사용). 조건에 대한 자세한 정보를 원하시면, 개인 메시지를 통해 저희에게 문의해 주시기 바랍니다! 구매하기 전에 데모 계정에서 데모 버전을 테스트할 수 있습니다. 데모 버전 여기 . 전체 지침 여기 . 주요 기능 및 이점: 복사기는 "МТ5> МТ5", "МТ4> МТ5", "МТ5> МТ4" 복사를 지원합니다. 복사기는 데모 계정 > 실 계정, 실 계정 > 데모 계정, 데모 계정 > 데모 계정 및 실제 계정 > 실 계정 복사를 지원합니다. 복사기는 읽기 전용 암호가 적용된 투자자 계정에서 복사를 지원합니다. 하
Timeless Charts
Samuel Manoel De Souza
5 (3)
Timeless Charts is an advanced charting solution designed for professional traders seeking for custom charts / custom timeframes , including seconds charts / seconds timeframe, renko charts / renko bars, cluster charts / footprint charts and advanced tools present in most of the popular platforms. Unlike traditional offline charts or simplistic custom indicators, this solution constructs fully custom bars with true timestamp accuracy , down to miliseconds, allowing for a powerful and precise tr
The News Filter MT5
Leolouiski Gan
4.77 (22)
이 제품은 뉴스 시간 동안 모든 전문가 어드바이저 및 수동 차트를 필터링하여 수동 거래 설정이나 다른 전문가 어드바이저가 입력한 거래가 파괴될 수 있는 급격한 가격 상승으로부터 걱정하지 않아도 됩니다. 이 제품은 또한 뉴스 발표 전에 열린 포지션과 대기 주문을 처리할 수 있는 완전한 주문 관리 시스템이 함께 제공됩니다.   The News Filter  를 구매하면 더 이상 내장 뉴스 필터에 의존할 필요가 없으며 이제부터 모든 전문가 어드바이저를 여기서 필터링할 수 있습니다. 뉴스 선택 뉴스 소스는 Forex Factory의 경제 캘린더에서 얻어집니다. USD, EUR, GBP, JPY, AUD, CAD, CHF, NZD 및 CNY와 같은 어떤 통화 기준으로 선택할 수 있습니다. Non-Farm (NFP), FOMC, CPI 등과 같은 키워드 식별을 기준으로 선택할 수도 있습니다. 저, 중, 고 영향을 가지는 뉴스를 필터링할 수 있도록 선택할 수 있습니다. 차트와 관련된 뉴스만 선
Copy Cat More Trade Copier MT5 (복사 고양이 MT5) 는 오늘날의 거래 과제를 위해 설계된 로컬 거래 복사기이자 완전한 위험 관리 및 실행 프레임워크입니다. 프롭펌 챌린지부터 개인 포트폴리오 관리까지, 견고한 실행, 자본 보호, 유연한 구성 및 고급 거래 처리의 조합으로 모든 상황에 적응합니다. 복사기는 마스터(송신자)와 슬레이브(수신자) 모드 모두에서 작동하며, 시장 주문과 예약 주문, 거래 수정, 부분 청산 및 헷지 청산 작업의 실시간 동기화를 제공합니다. 데모 및 실계좌, 거래 또는 투자자 로그인과 호환되며, EA, 터미널 또는 VPS가 재시작되어도 지속적인 거래 메모리 시스템을 통해 복구를 보장합니다. 고유 ID로 여러 마스터와 슬레이브를 동시에 관리할 수 있으며, 브로커 간 차이는 접두사/접미사 조정 또는 사용자 정의 심볼 매핑을 통해 자동으로 처리됩니다. 매뉴얼/설정  | Copy Cat More MT4 | 채널  특별 기능: 설정이 간편함 —
MT5 to Telegram Signal Provider 는 사용하기 쉽고 완전히 커스터마이즈 가능한 유틸리티로, 특정 신호를 Telegram의 채팅, 채널 또는 그룹으로 전송하고, 귀하의 계정을 신호 제공자 로 만듭니다. 경쟁 제품과 달리 DLL 임포트를 사용하지 않습니다. [ 데모 ] [ 매뉴얼 ] [ MT4 버전 ] [ 디스코드 버전 ] [ 텔레그램 채널 ]  New: [ Telegram To MT5 ] 설정 단계별 사용자 가이드 가 제공됩니다. 텔레그램 API에 대한 지식은 필요하지 않습니다; 개발자가 제공하는 모든 것이 필요합니다. 주요 특징 구독자에게 보낸 주문 상세 정보를 커스터마이즈할 수 있습니다. 예를 들어, 브론즈, 실버, 골드와 같은 계층 구독 모델을 만들 수 있습니다. 골드 구독에서는 모든 신호를 받습니다. id, 심볼, 또는 코멘트로 주문을 필터링할 수 있습니다. 주문이 실행된 차트의 스크린샷이 포함됩니다 보낸 스크린샷에 닫힌 주문을 그려 추가 검증을 합니다
HINN MagicEntry Extra
ALGOFLOW OÜ
4.71 (14)
HINN MAGIC ENTRY – the ultimate tool for entry and position management! Place orders by selecting a level directly on the chart! full description   ::  demo-version  :: 60-sec-video-description Key features: - Market, limit, and pending orders - Automatic lot size calculation - Automatic spread and commission accounting - Unlimited partitial take-profits  - Breakeven and trailing stop-loss and take-profit  functions - Invalidation leves - Intuitive, adaptive, and customizable interface - Works
Ultimate Extractor
Clifton Creath
5 (9)
Ultimate Extractor - Professional Trading Analytics for MT5 *****this is the local HTML version of Ultimate Extractor. !!!!!it is not compatible with Cloud!!!! For the online version please reach out to me directly****** Ultimate Extractor transforms your MetaTrader 5 trading history into actionable insights with comprehensive analytics, interactive charts, and real-time performance tracking. What It Does Automatically analyzes your MT5 trading history across all Expert Advisors and generates
AntiOverfit PRO MT5
Enrique Enguix
5 (3)
AntiOverfit PRO: 백테스트에 대한 불편한 진실 그 EA를 사기 전에, 잠깐만 멈춰 보세요. 연 250% 수익을 약속하는 시스템을 방금 발견했습니다. 백테스트는 정말 완벽해 보입니다. 판매자는 399달러, 어쩌면 1,999달러를 요구합니다. 겉으로 보기엔 모든 게 그럴듯합니다. 하지만 문제가 있습니다. 그 백테스트는 당신이 생각하는 것을 증명하지 않습니다. 과거 데이터만으로는 거의 아무것도 증명되지 않습니다. 그것이 보여주는 유일한 사실은 그 로직이 하나의 특정한 시장 시퀀스에서 작동했다는 점입니다. 가격이 다른 경로로 움직이기 시작하는 순간, 로봇은 무너지기 시작합니다. 그리고 대부분의 비싼 EA는 სწორედ 여기서 무너집니다. AntiOverfit PRO가 하는 일 AntiOverfit PRO는 시스템을 팔기 전에 거의 아무도 보여주지 않는 것을 제공합니다. 바로 돈을 쓰기 전에 그 시스템의 견고함을 확인할 수 있는 방법입니다. 수학자일 필요도 없고, 복잡하게 생
HINN Lazy Trader
ALGOFLOW OÜ
5 (2)
Limited time offer: 20% off for a few days only!  - Annual subscription $360 instead of $450  - Lifetime plan $550 instead of $690 The core idea: using the user interface, you configure the parameters the chart must meet before entering a position (or positions), choose which entry models to use, and set the rules for when trading and planning should end. Lazy Trader  handles the rest: it  takes over all the routine chart watching and execution! full description  :: 3 key videos [1] ->  [2]   -
The product will copy all telegram signal to MT5 ( which you are member) , also it can work as remote copier.  Easy to set up, copy order instant, can work with almost signal formats, image signal,  s upport to translate other language to English Work with all type of channel or group, even channel have "Restrict Saving Content", work with  multi channel, multi MT5 Work as remote copier: with signal have ticket number, it will copy exactly via ticket number. Support to backtest signal. How to s
Custom Alerts AIO: 다중 시장을 동시에 모니터링 – 설정 없이 즉시 사용 가능 개요 Custom Alerts AIO 는 복잡한 설정 없이 즉시 사용할 수 있는 통합 시장 모니터링 도구입니다. FX Power, FX Volume, FX Dynamic, FX Levels, IX Power 등 필요한 모든 지표가 내장되어 있어 별도의 설치나 구성 없이 알림 기능을 바로 사용할 수 있습니다. 차트 그래픽 없이 작동하며, Forex, 금속, 지수, 암호화폐 등 주요 자산군을 모두 지원합니다. 주식(Symbols)은 별도로 입력하여 추가할 수 있으나, MetaTrader에서는 일반적으로 제한적으로만 사용됩니다. 1. 왜 Custom Alerts AIO를 선택해야 하나요? 추가 라이선스가 필요 없습니다 • 모든 Stein Investments 지표가 내장되어 있어 별도 구매가 필요 없습니다. • 즉시 알림 기능을 시작할 수 있어 빠르고 간편합니다. 모든 시장을 하나의 도구로
전체 워치리스트에서 극단적인 바를 실시간으로 스캔하세요. Power Bar Scanner는 모든 심볼을 동시에 모니터링하고 극단적인 가격 바가 나타나는 순간 알림을 보냅니다. 더 이상 차트를 일일이 넘길 필요가 없습니다. 모든 기회를 하나의 패널에서 확인하세요. 모든 타임프레임에서 작동합니다. Forex, Indices, 골드, Crypto - 모두 한 화면에서 확인. 작동 방식 스캐너는 Market Watch의 각 심볼에서 캔들 몸통이 N x ATR 을 초과하는 바를 확인합니다. 발견되면 해당 심볼이 방향(BUY/SELL), ATR 비율, 시그널이 몇 바 전에 발생했는지와 함께 표시됩니다. 어떤 심볼이 현재 활성 상태인지 한눈에 확인할 수 있습니다. 원클릭 내비게이션 스캐너에서 심볼 이름을 클릭하면 차트가 즉시 해당 심볼로 전환됩니다. 시그널을 발견하고, 클릭하고, 분석하세요. 수동으로 심볼을 전환하거나 차트 탭을 검색할 필요가 없습니다. 정렬 가능한 컬럼 컬럼 헤더를 클릭하여
Trader Evolution
Siarhei Vashchylka
5 (7)
" Trader Evolution " - A utility designed for traders who use wave and technical analysis in their work. One tab of the utility is capable of money management and opening orders, and the other can help in making Elliott wave and technical analysis. Manual (Be sure to read before purchasing) | Version for MT4 Advantages 1. Trading in a few clicks. Immediate and pending orders are available in the panel 2. Money management. The program automatically selects the appropriate lot size 3. Simplifies
Risk Manager for MT5
Sergey Batudayev
4.31 (16)
MT5의 Expert Advisor Risk Manager는 매우 중요하며 제 생각에는 모든 거래자에게 필요한 프로그램입니다. 이 Expert Advisor를 사용하면 거래 계정의 위험을 제어할 수 있습니다. 위험 및 이익 통제는 금전적 측면과 백분율 측면에서 모두 수행될 수 있습니다. Expert Advisor가 작동하려면 통화 쌍 차트에 첨부하고 예금 통화 또는 현재 잔액의 %로 허용되는 위험 값을 설정하기만 하면 됩니다. [Instruction for Risk Manager parameters] 어드바이저 기능 이 위험 관리자는 위험을 제어하는 ​​데 도움이 됩니다. - 거래를 위해 - 하루 - 일주일 동안 - 한 달 동안 당신은 또한 제어할 수 있습니다 1) 거래 시 최대 허용 랏 2) 1일 최대 주문 수 3) 하루 최대 수익 4) 지분 인수 이익 설정 그게 다가 아닙니다. 설정에서 자동 설정을 지정하면 고문이 기본 SL 및 TP를 설정할 수도 있습니다. 상
Telegram to MT5 Coppy
Sergey Batudayev
5 (8)
Telegram에서 MT5로:   최고의 신호 복사 솔루션 DLL 없이도 Telegram 채널과 채팅에서 MetaTrader 5 플랫폼으로 거래 신호를 직접 복사하는 최신 도구인 Telegram to MT5를 사용하여 거래를 간소화하세요. 이 강력한 솔루션은 정밀한 신호 실행, 광범위한 사용자 정의 옵션을 제공하고 시간을 절약하며 효율성을 높여줍니다. [ Instructions and DEMO ] 주요 특징 직접 Telegram API 통합 전화번호와 보안 코드를 통해 인증하세요. 사용자 친화적인 EXE 브리지를 통해 채팅 ID를 쉽게 관리하세요. 여러 채널/채팅을 추가, 삭제, 새로 고침하여 동시에 신호를 복사합니다. 고급 필터를 사용한 신호 파싱 예외 단어(예: "보고서", "결과")가 포함된 원치 않는 신호를 건너뜁니다. 유연한 SL 및 TP 형식을 지원합니다: 가격, 핍 또는 포인트. 가격 대신 포인트를 지정하는 신호에 대한 진입 포인트를 자동으로 계산합니다. 주문 맞춤화 및
Trade Manager DaneTrades
Levi Dane Benjamin
4.36 (28)
거래 관리자는 위험을 자동으로 계산하는 동시에 거래를 빠르게 시작하고 종료하는 데 도움을 줍니다. 과잉 거래, 복수 거래 및 감정 거래를 방지하는 데 도움이 되는 기능이 포함되어 있습니다. 거래를 자동으로 관리할 수 있으며 계정 성과 지표를 그래프로 시각화할 수 있습니다. 이러한 기능은 이 패널을 모든 수동 거래자에게 이상적으로 만들고 MetaTrader 5 플랫폼을 향상시키는 데 도움이 됩니다. 다중 언어 지원. MT4 버전  |  사용자 가이드 + 데모 트레이드 매니저는 전략 테스터에서 작동하지 않습니다. 데모를 보려면 사용자 가이드로 이동하세요. 위기 관리 % 또는 $를 기준으로 위험 자동 조정 고정 로트 크기 또는 거래량과 핍을 기반으로 한 자동 로트 크기 계산을 사용하는 옵션 RR, Pips 또는 Price를 사용한 손익분기점 손실 설정 추적 중지 손실 설정 목표 달성 시 모든 거래를 자동으로 마감하는 최대 일일 손실률(%)입니다. 과도한 손실로부터 계정을 보호하고 과도한
Grid Manual MT5
Alfiya Fazylova
4.9 (21)
"Grid Manual"은 주문 그리드 작업을 위한 거래 패널입니다. 이 유틸리티는 보편적이며 유연한 설정과 직관적인 인터페이스를 제공합니다. 그것은 손실을 평균화하는 방향뿐만 아니라 이익을 증가시키는 방향으로 주문 그리드와 함께 작동합니다. 거래자는 주문 그리드를 만들고 유지할 필요가 없으며 유틸리티에서 수행합니다. 거래자가 주문을 시작하는 것으로 충분하며 "Grid Manual"는 자동으로 그를 위한 주문 그리드를 생성하고 거래가 마감될 때까지 그와 동행할 것입니다. 전체 설명 및 데모 버전 여기 . 유틸리티의 주요 기능: 모바일 터미널을 포함하여 어떤 방식으로든 열린 주문과 함께 작동합니다. "제한" 및 "중지"의 두 가지 유형의 그리드와 함께 작동합니다. 고정 및 동적(ATR 표시기 기반)의 두 가지 유형의 그리드 간격 계산과 함께 작동합니다. 오픈 오더 그리드의 설정을 변경할 수 있습니다. 차트에서 각 주문 그리드의 손익분기점 수준을 표시합니다. 각 주문 그리드에 대한 이익
Poc Breakout Signal: The Ultimate Institutional Order Flow & Price Action System Elevate your trading with Poc Breakout, a comprehensive technical analysis tool designed to bridge the gap between retail trading and institutional market understanding. This all-in-one system combines powerful Buy/Sell signals, advanced Volume Profile analysis, real-time Order Flow (Depth of Market), and critical macroeconomic data to give you a clear, unambiguous edge in the markets. Poc Breakout Signal decodes c
The Ultimate TradingView to MT5 Bridge Automation 수동 매매와 지연 시간(Latency) 문제에서 벗어나세요. TradingView to MT5 Copier PRO 는 트레이딩뷰(TradingView) 알람을 메타트레이더 5(MT5)에서 직접 실행할 수 있는 가장 빠르고 안정적인 브릿지입니다. 사용자 지정 지표, 전략 테스터 스크립트, 수동 작도 등 무엇을 사용하든, 이 EA는 초고속 웹소켓(WebSocket) 기술 을 사용하여 매매를 즉시 실행합니다. 단순한 복사기와 달리, 이 PRO 버전에는 Arena Statistics 가 포함되어 있습니다. 이는 차트에서 직접 매매 성과, 드로다운(Drawdown), 샤프 지수(Sharpe ratio)를 분석할 수 있는 전문적인 내장 대시보드입니다. 주요 기능 트레이드 복사기 (Trade Copier) 초고속 실행: 표준 WebRequest보다 빠른 WebSocket 연결을 사용하여 슬리피지(Slippa
Equity Protect Pro: 안심 거래를 위한 종합 계좌 보호 전문가 계좌 보호, 자산 보호, 포트폴리오 보호, 다중 전략 보호, 수익 보호, 수익 확보, 거래 보안, 위험 관리 프로그램, 자동 위험 관리, 자동 청산, 조건부 청산, 예약 청산, 동적 청산, 추적 손절매, 원클릭 종료, 원클릭 청산, 원클릭 복원 등의 기능을 찾고 있다면 Equity Protect Pro가 바로 필요한 프로그램입니다. 설정이 간편하고 사전 설정된 조건이 충족되면 모든 차트를 닫을 수 있으며 신호 구독 취소도 지원합니다(이는 모든 거래 프로그램도 중지됨을 의미합니다). 이 시점에서 새로운 주문이 생성되지 않으며 최종적으로 모든 주문이 종료되어 예상치 못한 손실을 효과적으로 방지하고 안심하고 거래할 수 있습니다. Equity Protect Pro (Technical Manual) Equity Protect Pro Demo Version for yo u to test   Equity Protect
Cerberus Equity Watcher
Samuel Bandi Roccatello
5 (3)
Cerberus the Equity Watcher는 귀하의 계정 자산을 지속적으로 모니터링하고 잘못된 EA 또는 재량 트레이더인 경우 감정적 행동으로 인해 발생하는 주요 손실을 방지하는 위험 관리 도구입니다. 버그가 있을 수 있거나 예상치 못한 시장 상황에서 잘 수행되지 않을 수 있는 EA에 의존하는 체계적 거래자에게 매우 유용합니다. Cerberus를 사용하면 최소 자산 가치와 (선택적으로) 최대 가치를 설정할 수 있습니다. 둘 중 하나에 도달하면 모든 위치가 평평해지고 모든 보류 중인 주문이 닫히고 모든 EA가 "죽습니다". 모든 위치를 평평하게 하면 알림이 사용자 휴대폰으로 전송되고 명확한 메시지가 화면에 표시됩니다. "평평화" 이후에 Cerberus는 주식 가치를 계속 주시하고 다시 초기화될 때까지 추가 거래 시도를 중단합니다. Cerberus가 수행하는 모든 작업은 화면에 명확하게 표시되고 Expert Advisor 탭에 보고되며 사용자에게 알림이 전송됩니다. 사용자의 실수
제작자의 제품 더 보기
Auto Fibo DWM
Nikolay Mitrofanov
The indicator takes the last closed bar from three timeframes (daily, weekly, monthly) and draws Fibonacci levels based on the high and low prices of that bar. Depending on the opening and closing prices, the high and low are reversed. That is, if the candle is bullish, the low price is used as the starting price; otherwise, the high price is used. There's a second drawing option. Two opposing Fibonacci levels are drawn, each colored differently. Coincident levels and levels within the 0-100 ra
FREE
The utility draws pivot levels based on a selection from day week month The previous candlestick of the selected timeframe is taken and the values for the levels are calculated using the following formulas: Pivot = (high + close + low) / 3 R1 = ( 2 * Pivot) - low S1 = ( 2 * Pivot) - high R2 = Pivot + (R1 -S1) R3 = high + ( 2 * (Pivot - low)) S2 = Pivot - (R1 - S1) S3 = low - ( 2 * (high - Pivot)); The style and thickness for all lines are adjusted. The colors for the R, Pivot and S lines ar
FREE
RSI Chart Levels
Nikolay Mitrofanov
4.83 (6)
The indicator draws levels based on the overbought and oversold values ​​of the RSI indicator. The maximum values ​​are taken into account, which are equal to or exceeded certain limits. That is, for example, when the price has gone into the overbought zone, the highest price is selected from all prices in this zone for this period of time, and as soon as the indicator value returns to a value below the overbought value, the level is fixed and the calculation of new values ​​begins. The same
FREE
Mahisto Trend Chart
Nikolay Mitrofanov
5 (2)
The indicator makes calculations based on data obtained from one of seven (7) moving averages and colors the chart. Simple moving averages are those that have only one important calculation parameter - the period. The shift in the indicator is not used. There is a shift trick setting, it is used to smooth the result of calculations. You can see the changes if you reduce this parameter to 1 (minimum value). shift trick must always be less than the period value. Available averages: MA Simpl
FREE
Strong movement levels
Nikolay Mitrofanov
5 (2)
Looks for strong price movements and draws levels upon their completion. You determine the strength of the movement yourself by specifying in the settings the number of points and the number of candles of the same color in a row in one direction. There are 2 types of building in the settings: extrenum - high / low close - close price You can also adjust the number of displayed levels and the number of candles for calculations. By default, the settings indicate 5 levels for 360 candles. That
FREE
The indicator draws a normal chart by coloring it in colors based on prices calculated by the Heiken Ashi indicator algorithm. That is, the shape of the candles does not change. In fact, this is the same Heiken Ashi that does not distort the price chart. Then there will be a drawing of a cat, because there is nothing more to write about the indicator. .                                                       
FREE
The indicator highlights in color the places on the chart where the price moves in one direction continuously from the selected number of candles. You can specify the number of points from the beginning of the movement to select only movements from this amount. It can be useful for looking for reversals or sharp impulses. I also recommend purchasing this utility to determine local weekly / monthly trends and support and resistance lines. https://www.mql5.com/en/market/product/61401
FREE
Stop Loss Util
Nikolay Mitrofanov
The utility automatically sets the take-profit and stop-loss levels specified by the user in the parameters and moves the stop-loss line when the specified number of points above the trade price is exceeded. There are 4 trailing stop options: Disabled - Disabled Trail - Simply move the stop-loss level To breakeven - Move the stop-loss to breakeven when the value of points specified in the settings is exceeded and do not move the level any further As steps - Move the stop-loss to breakeven when
FREE
The indicator uses moving average reversal values ​​on all selected timeframes to plot levels where the moving average has reversed, which can be considered support or resistance levels, as well as trend change signals on the timeframe of the newly drawn line. The moving average is passed through the RSI indicator. The line colors are customizable and, by default, indicate the following: 1. Purple - the moving average has changed direction downwards. 2. Gold - the moving average has changed di
FREE
Trendline Equalizer
Nikolay Mitrofanov
1.5 (2)
When creating, modifying and moving a trend line, two anchor points will be selected: high / low, open / close, median or weighted from the candlestick prices. For high / low, open / close, if the anchor point is above the candlestick, the upper price will be taken, below the candlestick - the lower one. If the point is inside the candlestick, then if the first point is higher than the second, then the first one goes up, the second goes down. Conversely, if the second is higher than the first.
FREE
Calculates pivot levels. It paints the histogram depending on the location of prices relative to these levels. Parameter values: style - select the type of display (Histogram, Line, Arrow) price - price, has little effect on the final look, but this can be customized timeframe - select a timeframe for calculating levels. color over pivot line - color of everything above the pivot level color under pivot line - color of everything below the pivot level pivot line intersection color - the color
FREE
Levels of Pivots
Nikolay Mitrofanov
The utility draws reversal levels using the formulas for each of the selected number of candles: Pivot = (high + close + low) / 3 R1 = ( 2 * Pivot) - low S1 = ( 2 * Pivot) - high R2 = Pivot + (R1 -S1) R3 = high + ( 2 * (Pivot - low)) S2 = Pivot - (R1 - S1) S3 = low - ( 2 * (high - Pivot)) H = high L = low U = if the candle is bullish, then close. Otherwise - open D = if the candle is bullish, then open. Otherwise - close On any timeframe. After a new candle closes on the calculated timeframe
FREE
The indicator draws a colored histogram from comparisons of the strengths of bulls and bears. It works like this: The values ​​of two indicators Bears and Bulls are taken, who is stronger on the candlestick is compared, the column is filled in. It's all. .
FREE
The indicator draws levels based on the overbought and oversold values ​​of the RSI indicator. All timeframes are available. Can be enabled or disabled in any combination. The most recently closed overbought levels are selected based on the bar's closing price or the level of the first RSI indicator intersection with the 50% line. For more information, you can enable the display of RSI values ​​for the most recently closed bars (candles) and the current values ​​of all enabled indicators (upda
The indicator averages the price using one of four methods: Simple Exponential Linear Weighted Smoothed Tema Dema None Then filters the result through the RSI values. This results in a line drawn that approximates the trend change in the RSI peak zones. The last three screenshots show two indicators on a single chart with RSI high and low prices and the rest of the default parameters. The up color (red) for the high prices is set to None, while the down color (blue) for the low prices is set to
필터:
Michael-MT5
449
Michael-MT5 2024.08.18 10:11 
 

사용자가 평가에 대한 코멘트를 남기지 않았습니다

[삭제] 2021.10.03 12:17 
 

사용자가 평가에 대한 코멘트를 남기지 않았습니다

Nikolay Mitrofanov
17816
개발자의 답변 Nikolay Mitrofanov 2021.10.03 18:48
Всё показывает на всех таймфреймах. Обновляет и рисует линии только на H1.
Попробуйте на пустой график применить, потому что возможно, что другие утилиты или индикаторы очищают экран от объектов.
리뷰 답변