Abiroid PVSRA Scanner MT5
- Göstergeler
- Sürüm: 1.12
- Güncellendi: 20 Haziran 2026
- Etkinleştirmeler: 20

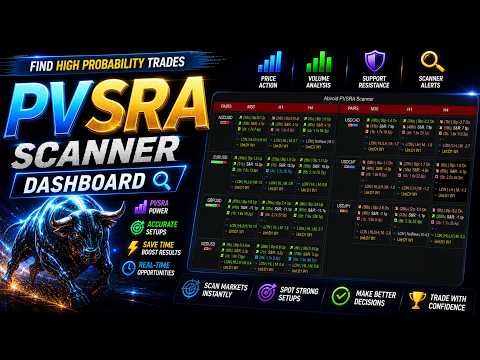
What Is It?
This PVSRA Screener is for real-time market analysis.
so instead of manually checking charts one by one, you get a live command center that tells you the market phase, volume intent, trend state, and nearest price structure all in one glance.
Features at a Glance
- Multi-pair, multi-timeframe scanner dashboard... monitors everything at once
- PVA (Price Volume Analysis)... detects Climax and Rising volume candles in real time
- The Dragon EMA... configurable trend anchor (default 50 EMA of Typical price, HLC/3)
- 200 EMA trend filter... separates bull regime from bear regime for each pair
- 89 EMA Momentum Slope... confirms natural momentum is present before signaling
- Round number proximity (Whole .00, Half .50, Quarter .25/.75 levels)
- Stop Hunt detection... identifies MM traps at key S&R levels
- Squat pattern... spots high-volume absorption bars with narrow range
- Run Exhaustion... warns when price is overextended from the Dragon
- Accumulation and Distribution phase identification
- Wave check (Higher Lows for longs / Lower Highs for shorts)
- Session filter... highlights active trading hours with different colors
- Untested Daily and Weekly price magnets... tracks whether key highs and lows have been visited
- M1 Cross-TF Volume gate... optional confirmation that lower timeframe volume aligns
- Color-coded action priority... from neutral gray to bright lime green for the highest probability setups
- Configurable alerts for every setup type independently
- Two scanner modes: Trend Mode and Retracement Mode
- Fully customizable colors, EMA periods, volume thresholds, and proximity settings