MultiCurrency RSI
- Göstergeler
- Sürüm: 1.1
- Güncellendi: 30 Kasım 2021
- Etkinleştirmeler: 20

The MultiCurrency RSI indicator calculates the values of the standard RSI indicator for each of 8 major currencies: EUR, GBP, AUD, NZD, USD, CAD, CHF, JPY.
Advantage of the indicator:
- The calculation is performed based on 8 virtual currency charts: EUR, GBP, AUD, NZD, USD, CAD, CHF, JPY;
- Shows the strength of currencies, not depending on the currency pair;
- Allows any time to determine the strongest and the weakest currency, also sorts currencies by strength;
- At any time it shows the current strongest/weakest currency pair;
- Has interactive buttons for quick navigation to the chart of the strongest/weakest currency pair;
- Standard line colors are comfortably selected for the black and white chart style;
- Despite heavy calculations, it does not load the terminal.
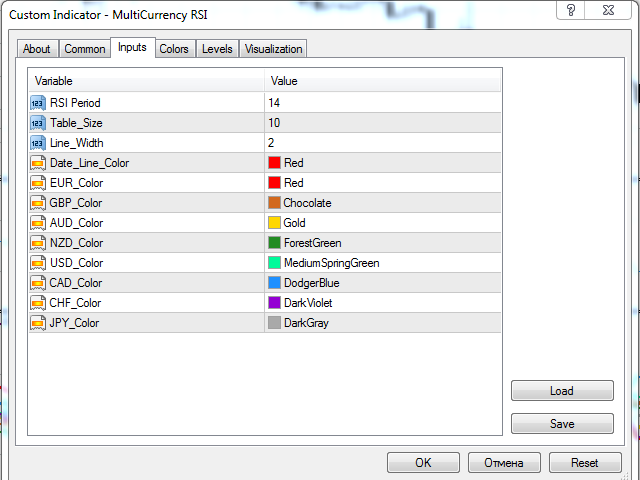
Description of Input Parameters
- InpRSIPeriod - RSI period;
- Table_Size - the size of the table in the indicator window;
- Line_Width - the width of the indicator and the width of the date line;
- Date_Line_Color - the color of the date line;
- EUR_Color - EUR line color;
- GBP_Color - GBP line color;
- AUD_Color - AUD line color;
- NZD_Color - NZD line color;
- USD_Color - USD line color;
- CAD_Color - CAD line color;
- CHF_Color - CHF line color;
- JPY_Color - JPY line color;
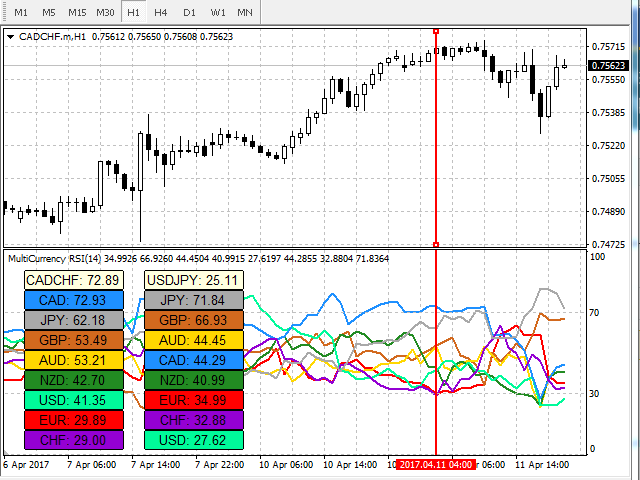
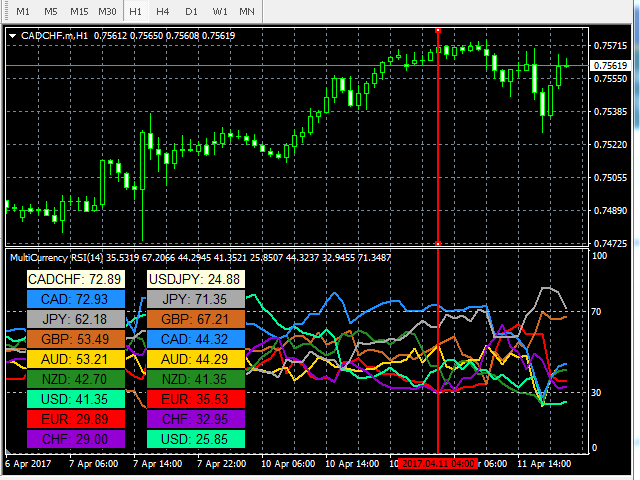
Description
The indicator has 8 RSI lines, 2 columns and the date line.
The lines show the values of the standard RSI indicator calculated on the virtual charts of EUR, GBP, AUD, NZD, USD, CAD, CHF, JPY.
In the columns, the values of RSI are sorted in the descending order from top to bottom, i.e. the order of currencies in columns correspond to the orders of lines on the chart. Also the appropriate RSI value is shown near each currency in the column.
The top of each column features the strongest/weakest pair and the value of the standard RSI indicator for this pair. Clicking on the currency pair changes the current chart to the corresponding currency pair chart. The right column is the current time, the left column is the time of the date line.
The date line allows you to conveniently view RSI values at any time by simply moving the line.
How to Use the Indicator
The indicator is widely used in strategies that apply the standard RSI indicator. It allows you to explore the market more deeply, develop new trading strategies as well as test and effectively apply the existing ones.
It is included in the group of standard multi-currency indicators.
Please contact me for any questions and suggestions.