Trend Power

4.43

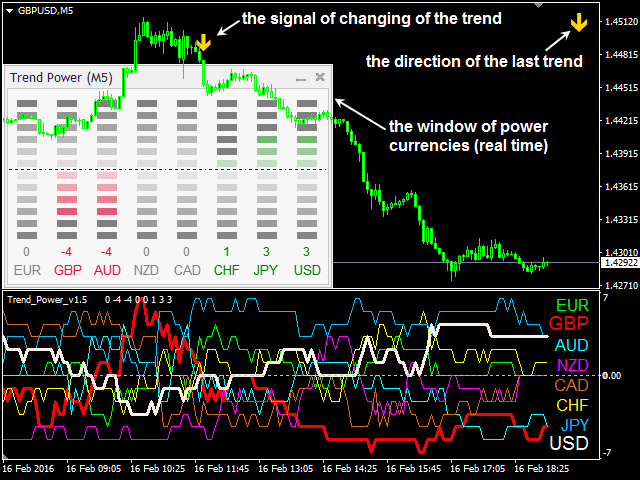
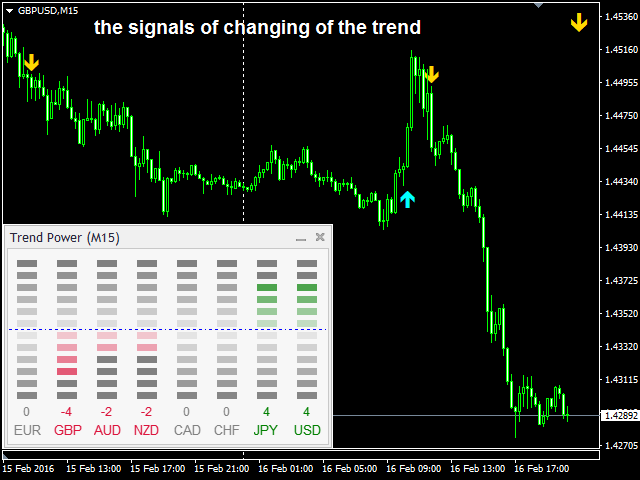
A very powerful tool that analyzes the direction and the strength of the 8 major currencies: EUR, GBP, AUD, NZD, CAD, CHF, JPY, USD – both in real time, and on historical data. The indicator generates a sound signal and a message when a trend changes. Never repaints signal.

The strength of the signal is calculated for all pairs which include these currencies (28 pairs total), can have value from 0 to 6 on a bullish trend, and from 0 to -6 on a bearish trend.

Thus, you will never miss a good movement. By placing the indicator on a chart of one currency pair, you will be monitoring the trend of all 28 instruments.


The Indicator Features:

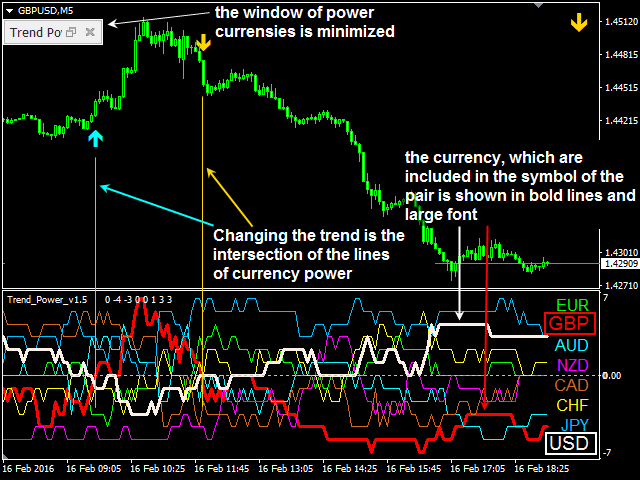
  1. Very convenient window for displaying the current currency strength (real time). This window can be minimized and moved by the mouse to any location on the chart.
  2. The current direction of the currency pair trend can always be seen in the top right corner.
  3. It is possible to disable the signal on the currency pairs that you do not trade.
  4. Recognizes non-standard symbol names (with prefixes of suffixes).
  5. It sends emails and push-notifications to mobile devices.

You can test the functionality of the program by downloading the test version from the Comments tab


How to interpret the currency strength readings:

(here is an example of a currency strength for a bullish trend, for bearish - the value will be negative)

  • 0-2 – currency in a sideways movement (flat)
  • 3-4 – currency in a good trend movement, optimal for trading
  • 5-6 – very strong trend, possible correction

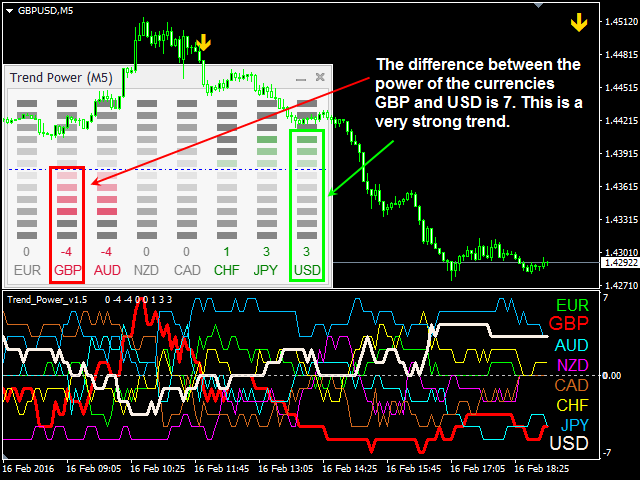
The greater the difference between the two currencies, the stronger the trend of the currency pair that includes these currencies.


Usage example:

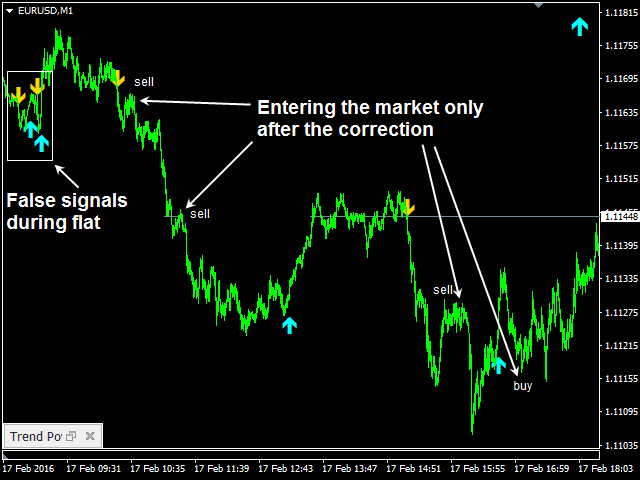
  1. Signal of intersection of the strength lines of two currencies - a signal of trend change. It allows to take a large portion of the trend, but false entries are possible when the market is in a flat or when it has rapid price fluctuations. It is recommended to wait for the rollback for confirmation.
  2. By current readings of the strength, without using a signal (more reliable method). In the current strength window find the strongest currency (the greatest positive value of the trend strength) and the weakest currency (the greatest negative value of the trend strength). As a rule, the instrument including these currencies is in a very strong trend. It is necessary to wait for the correction to enter.

Please note!

The indicator signals should not be directly used for market entries!

As a rule, a strong trend will have already developed by the time a signal appears, therefore it is necessary to wait for the rollback and enter the market at the current or smaller timeframe based on the data from the other indicators, for example, the "Trend Monitor" indicator.
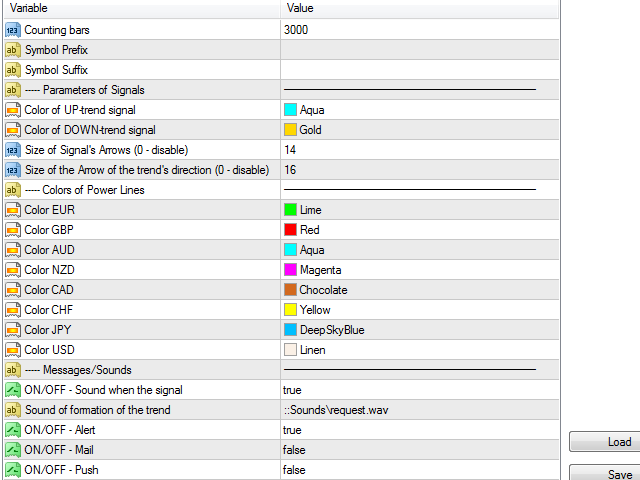

Parameters:

  • Counting bars – number of bars for history calculation
  • Symbol Prefix – the prefix for non-standard symbol name of the currency pair
  • Symbol Suffix – suffix
  • Color of UP-trend signal – arrow color of a bullish trend
  • Color of DOWN-trend signal – arrow color of a bearish trend
  • Size of Signal's Arrows (0 - disable) – size of the arrows, signaling the trend change (if =0 - not displayed)
  • Size of the Arrow of the trend's direction (0 - disable) – size of the trend direction arrow in the top right corner (if =0 - not displayed)
  • Color EUR, Color GBP, Color AUD, Color NZD, Color CAD, Color CHF, Color JPY,Color USD – colors of the strength lines of the 8 currencies in the indicator subwindow
  • ON/OFF – Sound when the signal – enable sound alerts
  • Sound of formation of the trend – trend change signal sound
  • ON/OFF - Alert / Mail / Push – messages in the terminal when a trend changes / E-mail / mobile devices

It is important to have complete historical data on 28 currency pairs, otherwise the indicator readings will be incorrect!

The indicator is able to download the historical data on its own. But it takes considerable time (up to 3 minutes, depending on the download speed). Therefore, to improve the indicator operation speed and to correctly display the data, it is recommended to run the free script «Download Quotes» before the first launch of the indicator, which automatically connects the instruments to the MarketWatch window of the terminal and downloads the historical data on 28 currency pairs for all timeframes.

This procedure needs to be done only once before the first launch of the indicator.

Değerlendirmeler 7
Fxpro Trader Technical
1141
Fxpro Trader Technical 2022.03.16 16:53 
 

I bought this indicator 5-6 years ago, and seller still updating and improved until today, very happy and please, superb and greatly appreciated. Thank you

Jerzy Zagorski
957
Jerzy Zagorski 2017.07.28 10:12 
 

Works well, good price

Aravind Kolanupaka
10229
Aravind Kolanupaka 2016.12.29 04:58 
 

Good indicator with currency cross over alerts.

Önerilen ürünler
Tiger Trend
Leandro Bernardez Camero
Tiger Trend – Dinamik Aralığa Dayalı Trend Tersine Dönüş Göstergesi Güncellemelerden haberdar olmak için kanala katılın: https://www.mql5.com/en/channels/forexnewadvisor Tiger Trend , son fiyat aralıklarından hesaplanan uyarlanabilir destek ve direnç seviyelerine dayalı olarak potansiyel trend dönüşlerini tespit etmek için tasarlanmış dinamik bir trend göstergesidir. Bu gösterge, fiyatların bu dinamik eşiklere göre kapanışlarını analiz ederek momentumun değişip değişmediğini belirlemenize yardı
Ortalama geri dönüş ticareti için profesyonel ve nicel bir yaklaşım uygulayan benzersiz gösterge. Fiyatın tahmin edilebilir ve ölçülebilir bir şekilde ortalamaya döndüğü ve yön değiştirdiği gerçeğinden yararlanır, bu da nicel olmayan ticaret stratejilerinden büyük ölçüde daha iyi performans gösteren net giriş ve çıkış kurallarına izin verir. [ Installation Guide | Update Guide | Troubleshooting | FAQ | All Products ] Ticaret sinyallerini temizle Ticaret yapmak inanılmaz derecede kolay Özelleşt
Sniper Pro MT4
Md Wakiluzzaman Raz
Sniper Pro Sniper Pro   is a sophisticated reversal trading indicator engineered for the MetaTrader platform. It utilizes advanced non-parametric regression and kernel smoothing techniques to filter out market noise and identify high-probability turning points. By calculating a dynamic probability envelope, the indicator provides a clear visualization of where price action is likely to exhaust and reverse back toward its mean. The Trading Philosophy Most traditional indicators rely on moving ave
About
Tatiana Savkevych
About - Forex indicator. This trend indicator is used to determine the current trend in price movement, making it clear in which direction it is better to open a position: buy or sell. The About trend indicator is displayed on the chart and moves in parallel with the price. The Forex About trend indicator allows you to determine in time a change in the direction of price movement, thereby minimizing the likelihood of capital loss. In trading practice, various combinations of About and other ind
This is an original, agile, and excellent trending system. Whether you are a beginner trading novice or a professional trader, this set of indicators can help you quickly and timely track the latest changes in market trends. It has the following characteristics: The method of use is extremely simple, plug and play, and the display of all trend analysis results is clear at a glance; There is no need to configure any functional parameters, the trend tracking indicator will automatically analyze th
CSS " currency strength slope "  is a a multi currency strength indicator that use Forex major currencies, EUR, USD, CAD, AUD, NZD, JPY, CHF, GBP. it use 28 major pairs to calculate the power of every currency using a based moving averages algorithm : you will see volatility clearly between currencies. input: MA Fast & Slow. - MA Mode : simple, exponential, smoothed, linear weighted - Applied Price : close, open, high, low, median price, typical price, weighted price.
Trend Analysis in act
Ihab Mohamed Kamal Fouda
The Trend Analysis Indicator is an innovative tool designed for traders and investors who seek to navigate the complexities of the financial markets with greater precision and insight. This powerful indicator is engineered to adeptly identify whether a market is trending or not, offering users a vital edge in their trading strategy. Key Features: Accurate Trend Detection : The core functionality of the Trend Analysis Indicator lies in its ability to accurately detect market trends. It analyzes p
Moving Pivot Average    The pivot indicator compares the selected period with its counterpart from the previous period. The indicator uses very flexible algorithm for pivot value calculating. It allows you to allocate in days a certain time intervals (custom bars) and calculate the average pivot value based on High, Low and Close prices of these bars. How many custom bars will be taken into account is determined by the "Days" setting. The pivot line can be considered an average trend line and us
The trader uses the Trend for Neuro indicator to determine the market situation. This is a trending algorithm that is convenient to download, install and use. The algorithm with acceptable accuracy generates input signals and output levels. Strategy for trend trading, filtering and all the necessary functions built into one tool! By launching the indicator, the user will see only two types of arrows that can change color to blue during an uptrend, to red during a downtrend there is no uncertaint
Reincarnations
Maryna Shulzhenko
The Reincarnations trend indicator is used to determine the strength and direction of a trend and to find price reversal points. This tool scans the market looking for the correct entry. You can see and evaluate it yourself, perhaps it will suit you for a number of tasks related to forecasting price movements. It uses only price data and analytics to calculate entry points. Does not use auxiliary indicators. It has two parameters for customization. Indicator setting. Interval - price analysis
Market Profile
Artem Titarenko
5 (1)
The "Market Profile" indicator displays the profiles and volumes of periods – weekly, daily, session (8-hour), 4-hour, hour, summary. The VAH/VAL price area is automatically highlighted by a dotted line for each profile (except for the summary). The indicator includes chroma Delta, which colors the profile areas. The areas of prevailing Buys is colored in green, that of Sells - in red. The intensity histogram features blue/red respectively. In the filter mode, the indicator displays the volume a
A digital candlestick chart displays custom-colored candles on a black background. The chart features: • Green candles  representing bullish momentum • Red candles  showing bearish momentum • Orange candles  signalling neutral or conflicting signals  We have attached images of our settings on our charts, in addition to this, make sure the chart is displaying the line chart (alt + 3).
Breakout Potential
Suvashish Halder
5 (1)
Exclusive Arrival: Presenting for the First Time . This is your secret weapon for predicting which way the wind will blow with the next market shift. It assists you in developing your trading strategy by predicting the direction of the next candle. Compatible with forex, stocks, and cryptocurrencies on all timeframes, but higher timeframes are recommended. MT5 Version -  https://www.mql5.com/en/market/product/108937/ How does it work ? It's pretty neat. The algorithm separates green and red can
Global Trend
Vitalii Zakharuk
Global Trend Indicator, shows the signals for entry. Displays both entry points and the trend itself. Shows statistically calculated moments for entering the market with arrows. When using the indicator, the risk factor can be optimally distributed. Settings: Uses all one parameter for settings. Choosing a parameter, it is necessary to visually resemble it so that the appropriate graph has a projection of extremes. Parameters: Length - the number of bars for calculating the indicator. Use
Indicator for binary options arrow is easy to use and does not require configuration works on all currency pairs, cryptocurrencies buy signal blue up arrow sell signal red down arrow tips do not trade during news and 15-30 minutes before their release, as the market is too volatile and there is a lot of noise it is worth entering trades one or two candles from the current period (recommended for 1 candle) timeframe up to m 15 recommended money management fixed lot or fixed percentage of the depo
The Power calculates the strength of the long and short forces by the ratio of the price breakthrough to the average amplitude of the previous market. When the intensity is strong, the signal appears on the chart to estimate the direction of the next wave. There is no future function for the indicator. All signals will not move or disappear after they appear, and have a good real-world reference value. The indicator parameters allow the user to make individual adjustments. More EA and Indicators
Nice Try Super Diddy Trend – an innovative technical analysis tool designed for experienced traders seeking a deep understanding of market dynamics. This indicator utilizes complex algorithms to calculate liquidity flows and momentum, identifying potential reversal points and trend continuations. Uniqueness and Value Nice Try Super Diddy Trend is more than just signal generation—it analyzes the hidden structure of the market, examining the amplitude of price fluctuations and directionality while
KT Forex Line MT4
KEENBASE SOFTWARE SOLUTIONS
KT Forex Line can be described as an improved version of the moving average indicator. The indicator is embedded in the main trading chart and features a line that switches between blue and white depending on the prevailing direction or mood of the market. Utilizing the indicator is simple. You do not need to understand complex graphs and intricate lines. Recognize the indicator line's color and trade accordingly. Key Features The indicator has customizable colors, with the blue and red being
Using multiple timeframes for analysis with Multi Timeframe Average Directional Index  can provide several significant benefits for traders: Comprehensive Market View: By applying Mtf ADX Standard across different timeframes, traders gain a broader perspective on market dynamics. This allows them to identify trends, patterns, and potential reversal points that might be more apparent or consistent across various scales. Enhanced Pattern Recognition: Multiple timeframes help in identifying repeati
FREE
Market Calculator is a powerful tool that allows you to easily and quickly calculate the main parameters of a trade: Lot size, StopLoss and TakeProfit, as well as estimate the amount of funds (required Margin) to open a position. The program has a very convenient and intuitive control, because implemented in OS Windows style. There are many interesting and handy features - just watch the video: youtu.be/FG2qqTJTIhE All program data are sorted into sections in the form of tabs: " Lot Calculator "
Gravity Trend
Svyatoslav Kucher
Determining the current trend is one of the most important tasks of a trader, regardless of the trading style. The Gravity Trend indicator will help you do this with a fairly high probability. Gravity Trend is a trend recognition indicator that uses the author's calculation algorithm. The indicator readings do not change under any conditions. The indicator is suitable for any currency pair, any timeframe. Indicator Parameters Main Settings: HistoryBars - the number of bars to display. FirstPe
SilentLevels
Barakah Muslih B Alharbi
One of the key elements in trading is identifying zones or levels that allow traders to make buy or sell decisions during trading. أحد العناصر الأساسية في التداول هو تحديد المناطق أو المستويات التي تسمح للمتداولين باتخاذ قرارات الشراء أو البيع أثناء التداول. The indicator displays Fibonacci levels يعرض المؤشر مستويات فيبوناتشي  drawing levels based on historical daily or weekly data. مستويات الرسم بناءً على البيانات التاريخية اليومية أو الأسبوعية. Daily levels update with each new day’s opening
The Omega Trend Oscillator is a trend indicator based on Moving averages and Bollinger bands. I made it simple for you to have easy and soft market analysis approach. The indicator can be used for the following purpose. 1. For trend analysis 2. For determining the overbought and oversold market condition 3. For discovering market selling and buying opportunities.  Meaning of colors on the indicator FOR BULLISH MARKET (Buy) 1. Lime color is for bullish market/trend 2. Blue color is for very st
ROC acceleration-deceleration is the manual system for medium-term scalping. Indicator based on custom ROC system which defines bullish/bearish market and especially  acceleration-deceleration of tendention in the market's main direction. Buy arrow is plotted during bearish market when current trend decelerates and sell  arrow is plotted during bullish market when current trend decelerates. Main Indicator's Features Signals are not repaint,non-late or disappear(exept cases when system recalculat
The intelligent algorithm of the Trend Detects indicator shows the points of potential market reversal. Strategy for trend trading, filtering market noise and all the necessary functions built into one tool! The system itself shows in the form of arrows when to buy and when to sell. Uses only one parameter for settings. Simple, visual and effective trend detection. Most often, a good trend is visible on the price chart visually. But an experienced trader must clearly understand the current bal
FiboZag
Andriy Sydoruk
Indicator FiboZag - transfer the indicator to the chart and the Fibonacci levels will be built automatically on the last ZigZag turn. The main advantage lies in the correct construction of Fibonacci levels and markup of price levels. Simple, visual and effective use. The indicator is not redrawn and does not lag. Works on all currency pairs and on all timeframes.
SMC Venom Model BPR göstergesi, Akıllı Para (SMC) konseptinde çalışan yatırımcılar için profesyonel bir araçtır. Fiyat grafiğinde iki temel modeli otomatik olarak belirler: FVG   (Adil Değer Açığı), ilk ve üçüncü mum arasında boşluk bulunan üç mumun birleşimidir. Hacim desteğinin olmadığı seviyeler arasında bir bölge oluşturur ve bu da sıklıkla fiyat düzeltmesine yol açar. BPR   (Dengeli Fiyat Aralığı), bir "köprü" oluşturan iki FVG modelinin birleşimidir - bir kırılma bölgesi ve fiyatın düşük
Overview Happy Tigris is a technical analysis tool designed for medium-to-long-term trend following. Its core logic utilizes a dual-custom baseline system to filter market noise. The Fast Line reflects immediate price fluctuations and short-term reversals, while the Slow Line defines the overall trend direction. Depending on the price position relative to these baselines, candlesticks automatically change color and saturation based on market risk and trend strength, allowing traders to identify
Your Good Friends — this is not just an indicator, but your reliable trading assistant, designed for traders who value simplicity, clarity, and stability. It combines the best classic methods of technical analysis — support and resistance levels, reversal signals, visual cues — and presents them in the clearest, most user-friendly format possible. Suitable for both beginners and experienced traders — especially those who want to eliminate chaos, reduce stress, and trade based on clear signals.
PrecisionCore Arrows
Cosmas Akamadu Nwachukwu
This indicator gives fewer signals but precise when it does. Its a little scaled down version of ControlEdge Fx indicator , that gives less number of signal with less precise. If you want one the gives more signals and more accurate in catching larger trends you might want to check out ControlEdge Fx in this link  https://www.mql5.com/en/market/product/175731 Enter Buy when the Blue Arrow appears  Exit Buy when the Red X sign appears Enter Sell when the Red Arrow Appears    Exit Sell when the
FREE
Bu ürünün alıcıları ayrıca şunları da satın alıyor
Neuro Poseidon MT4
Daria Rezueva
4.94 (32)
Neuro Poseidon is a new indicator by Daria Rezueva. It combines precise trading signals with adaptive TP/SL levels - creating best possible trades as a result! Message me and get  Neuro Poseidon Assistant  as a gift to automize your trading process! What makes it stand out? 1. Proven profitability on all assets and timeframes 2. Only confirmed BUY and SELL signals present on the chart 3. Adaptive TP & SL levels generated by the software for each trade 4. Easy to understand - suitable for all
Gann Made Easy
Oleg Rodin
4.84 (165)
Gann Made Easy , bay teorisini kullanarak ticaretin en iyi ilkelerine dayanan, profesyonel ve kullanımı kolay bir Forex ticaret sistemidir. WD Gann. Gösterge, Zararı Durdur ve Kâr Al Seviyeleri dahil olmak üzere doğru SATIN AL ve SAT sinyalleri sağlar. PUSH bildirimlerini kullanarak hareket halindeyken bile işlem yapabilirsiniz. Satın alma işleminden sonra, alım satım talimatlarını ve harika ek göstergeleri ücretsiz olarak almak için lütfen benimle iletişime geçin! Muhtemelen Gann ticaret yöntem
M1 Sniper
Oleg Rodin
5 (24)
M1 SNIPER kullanımı kolay bir işlem göstergesi sistemidir. M1 zaman dilimi için tasarlanmış bir ok göstergesidir. Gösterge, M1 zaman diliminde scalping için bağımsız bir sistem olarak kullanılabilir ve mevcut işlem sisteminizin bir parçası olarak kullanılabilir. Bu işlem sistemi özellikle M1'de işlem yapmak için tasarlanmış olsa da, diğer zaman dilimleriyle de kullanılabilir. Başlangıçta bu yöntemi XAUUSD ve BTCUSD ticareti için tasarladım. Ancak bu yöntemi diğer piyasalarda işlem yaparken de ya
Dynamic Forex28 Navigator
Bernhard Schweigert
4.43 (7)
Dynamic Forex28 Navigator - Yeni Nesil Forex Ticaret Aracı. ŞU ANDA %49 İNDİRİM. Dynamic Forex28 Navigator, uzun zamandır popüler olan göstergelerimizin evrimidir ve üçünün gücünü tek bir göstergede birleştirir: Gelişmiş Döviz Gücü28 Göstergesi (695 inceleme) + Gelişmiş Döviz İMPULS ve UYARI (520 inceleme) + CS28 Kombo Sinyalleri (Bonus). Gösterge hakkında ayrıntılar https://www.mql5.com/en/blogs/post/758844 Yeni Nesil Güç Göstergesi Ne Sunuyor?  Orijinallerde sevdiğiniz her şey, şimdi yeni
Enigmera
Ivan Stefanov
5 (8)
ENIGMERA: Pazarın Kalbi Önemli: MQL5.com demosu Strategy Tester'da çalışır ve Enigmera'nın tüm işlevlerini tam olarak yansıtmayabilir. Daha fazla bilgi için açıklamayı, ekran görüntülerini ve videoyu kontrol edin. Herhangi bir sorunuz varsa, bana mesaj göndermekten çekinmeyin! Göstergenin kodu tamamen yeniden yazılmıştır. 3.0 sürümü, yeni işlevler ekler ve göstergenin başlangıcından bu yana biriken hataları giderir. Giriş Bu gösterge ve ticaret sistemi, finansal piyasalara dikkat çekici bir ya
Trend Catcher ind
Ramil Minniakhmetov
5 (2)
TREND YAKALAYICI GÖSTERGE Trend Yakalayıcı Gösterge, yazarın tescilli ve özelleştirilmiş uyarlanabilir trend analiz göstergelerinin bir kombinasyonunu kullanarak piyasa fiyat hareketlerini analiz eder. Kısa vadeli gürültüyü filtreleyerek ve temel momentum gücüne, volatilite genişlemesine ve fiyat yapısı davranışına odaklanarak gerçek piyasa yönünü belirler. Ayrıca, hareketli ortalamalar, RSI ve volatilite filtreleri gibi yumuşatma ve trend filtreleme özelleştirilmiş göstergelerinin bir kombina
Bu gösterge, pratik ticaret için mükemmel olan otomatik dalga analizine yönelik bir göstergedir! Dava... Not:   Dalga sınıflandırması için Batılı isimleri kullanmaya alışkın değilim. Tang Lun'un (Tang Zhong Shuo Zen) adlandırma kuralının etkisiyle, temel dalgayı   kalem   , ikincil dalga bandını ise   segment   olarak adlandırdım. aynı zamanda segmentin trend yönü vardır. Adlandırma   esas olarak trend segmentidir   (bu adlandırma yöntemi gelecekteki notlarda kullanılacaktır, öncelikle söyleyey
KT Alpha Hunter Arrows MT4
KEENBASE SOFTWARE SOLUTIONS
Çoğu ok göstergesi size yalnızca bir sinyal verir ve geri kalan her şeyi sizin çözmenizi bekler. KT Alpha Hunter Arrows ise size eksiksiz bir işlem planı sunar. Her sinyal oku, grafikte hazır bir planla birlikte görünür: giriş çizgisi, stop loss, dört take profit seviyesi ve bu sembol ile zaman diliminin o anda işlem yapmaya değer olup olmadığını gösteren canlı edge kararı. Pakete dahil olan Trade Manager EA, siz işleme girdikten sonra yönetimi üstlenir. Böylece piyasa hareketli ve duygusal açıd
Scalper Inside PRO
Alexey Minkov
4.74 (68)
Scalper Inside PRO Scalper Inside PRO is an intraday trend and scalping indicator for MetaTrader 4 that uses an exclusive algorithm to quickly detect market direction and key target levels. It automatically calculates entry, exit and multiple profit targets, and shows detailed performance statistics so you can see how different instruments and strategies performed. This helps you choose the most suitable trading instruments for the current market conditions. Additionally, you can easily integrat
Neo Wave PRO
Nikolay Raykov
5 (1)
Price & Time Market Structure Indicator A professional market structure tool that analyzes waves through both price and time — not price alone. Main Description NeoWave PRO is a professional market structure indicator for MetaTrader 4 designed for traders who want to move beyond traditional one-dimensional wave tools such as ZigZag, swing indicators, and basic high/low systems. Most wave indicators analyze only one thing: Price. But a real market wave is not only a price movement. A true wave de
PRO Renko Sistemi, RENKO grafikleri ticareti için özel olarak tasarlanmış son derece hassas bir ticaret sistemidir. Bu, çeşitli ticaret araçlarına uygulanabilen evrensel bir sistemdir. Sistemi etkin piyasa sana doğru ters sinyallerine erişim hakkı denilen ses nötralize eder. Göstergenin kullanımı çok kolaydır ve sinyal üretiminden sorumlu tek bir parametreye sahiptir. Aracı, seçtiğiniz herhangi bir ticaret aracına ve renko çubuğunun boyutuna kolayca uyarlayabilirsiniz. Yazılımımla karlı bir
Genesis Matrix Pro is a professional multi-timeframe trend detection indicator designed to help traders identify high-quality market alignment with clarity and structure. It combines 12 different technical indicators into one visual alignment matrix, allowing traders to quickly see when market conditions are bullish, bearish, or neutral. A signal is generated only when the selected strategies are aligned, helping reduce noise and improve decision-making. PLEASE CONTACT ME AFTER PURCHASE TO GET
Current event:  https://c.mql5.com/1/326/A2SR2025_NoMusic.gif A. A2SR nedir ?   * Önde gelen bir teknik göstergedir (yeniden boyama yok, gecikme yok). -- Rehberlik : -- https://www.mql5.com/en/blogs/post/734748/page4#comment_16532516 adresinde -- ve https://www.mql5.com/en/users/yohana/blog A2SR, Destek (talep) ve Direnç (arz) seviyelerini belirlemede özel bir tekniğe sahiptir. İnternette gördüğümüz sıradan yoldan farklı olarak A2SR, gerçek SR seviyelerini belirlemede özgün bir konsepte sahi
PZ Trend Trading
PZ TRADING SLU
4.8 (5)
Capture every opportunity: your go-to indicator for profitable trend trading Trend Trading is an indicator designed to profit as much as possible from trends taking place in the market, by timing pullbacks and breakouts. It finds trading opportunities by analyzing what the price is doing during established trends. [ Installation Guide | Update Guide | Troubleshooting | FAQ | All Products ] Trade financial markets with confidence and efficiency Profit from established trends without getting whips
Advanced Supply Demand
Bernhard Schweigert
4.91 (300)
Özel Ticaret –%40 İndirim Yeni Başlayanlar veya Uzman Yatırımcılar İçin En İyi Çözüm! Bu gösterge, bir dizi özel özellik ve yeni bir formül içerdiği için benzersiz, yüksek kaliteli ve uygun fiyatlı bir işlem aracıdır. Bu güncelleme ile çift zaman dilimi bölgeleri gösterebileceksiniz. Sadece daha yüksek bir zaman dilimini değil, hem grafik zaman dilimini hem de daha yüksek zaman dilimini gösterebileceksiniz: İÇ İÇE GEÇMİŞ BÖLGELER GÖSTERİYOR. Tüm Arz Talep yatırımcıları buna bayılacak. :) Önem
IQ FX Gann Levels a precision trading indicator based on W.D. Gann’s square root methods . It plots real-time, non-repainting support and resistance levels to help traders confidently spot intraday and scalping opportunities with high accuracy. William Delbert Gann (W.D. Gann) was an exceptional market analyst, whose trading technique was based on a complex blend of mathematics, geometry, astrology, and ancient mathematics which proved to be extremely accurate. Setup & Guide:  Download  MT5 Ver
Scalper Vault
Oleg Rodin
5 (37)
Scalper Vault , başarılı bir scalping için ihtiyacınız olan her şeyi size sağlayan profesyonel bir scalping sistemidir. Bu gösterge, forex ve ikili opsiyon tüccarları tarafından kullanılabilecek eksiksiz bir ticaret sistemidir. Önerilen zaman çerçevesi M5'tir. Sistem size trend yönünde doğru ok sinyalleri sağlar. Ayrıca size üst ve alt sinyaller ve Gann piyasa seviyeleri sağlar. Göstergeler, PUSH bildirimleri dahil her türlü uyarıyı sağlar. Göstergeyi satın aldıktan sonra lütfen benimle iletişim
PZ Swing Trading
PZ TRADING SLU
5 (3)
Protect against whipsaws: revolutionize your swing trading approach Swing Trading is the first indicator designed to detect swings in the direction of the trend and possible reversal swings. It uses the baseline swing trading approach, widely described in trading literature. The indicator studies several price and time vectors to track the aggregate trend direction and detects situations in which the market is oversold or overbought and ready to correct. [ Installation Guide | Update Guide | Tro
" Dynamic Scalper System " göstergesi, trend dalgaları içinde işlem yapmak için scalping yöntemi için tasarlanmıştır. Başlıca döviz çiftleri ve altın üzerinde test edilmiştir, diğer işlem araçlarıyla uyumluluğu mümkündür. Ek fiyat hareketi desteğiyle trend boyunca pozisyonların kısa vadeli açılması için sinyaller sağlar. Göstergenin prensibi. Büyük oklar trend yönünü belirler. Küçük oklar şeklinde scalping için sinyaller üreten bir algoritma trend dalgaları içinde çalışır. Kırmızı oklar yüksel
M30/H1/H4 Swing versiyonu mevcut Büyük hareketleri yakalamak mı istiyorsunuz? Gold Signal Swing Pro (M30/H1/H4). Hedef: işlem başına $20-$80+. https://www.mql5.com/en/market/product/177643 KURAMA GOLD SIGNAL PRO (MT4) — 7 Katmanlı Filtre, Otomatik TP/SL ve Kalite Puanı ile Komple XAUUSD Trading Sistemi REPAINT YOK. YENİDEN ÇİZİM YOK. GECİKME YOK. Her sinyal kalıcıdır. Gördüğün, aldığındır. BONUS: Ömür boyu lisansı al ve AI Zone Radar ($59 değerinde)
PZ 123 Pattern
PZ TRADING SLU
1 (1)
Unlock powerful breakout opportunities The 123 Pattern is one of the most popular, powerful and flexible chart patterns. The pattern is made up of three price points: a bottom, a peak or valley, and a Fibonacci retracement between 38.2% and 71.8%. A pattern is considered valid when the price breaks beyond the last peak or valley, moment at which the indicator plots an arrow, rises an alert, and the trade can be placed. [ Installation Guide | Update Guide | Troubleshooting | FAQ | All Products  ]
MonsterDash Harmonic Indicator is a harmonic pattern dashboard. It recognizes all major patterns. MonsterDash is a dashboard that displays all detected patterns for all symbols and (almost) all timeframes in sortable and scrollable format. Users can add their own user defined patterns . MonsterDash can open and update charts with the pattern found. Settings MonsterDash's default settings are good enough most of the time. Feel free to fine tune them to your needs. The color settings are for thos
Apollo SR Master , Destek/Direnç bölgelerinde alım satımı daha kolay ve güvenilir hale getiren özelliklere sahip bir Destek/Direnç göstergesidir. Gösterge, yerel fiyat zirvelerini ve diplerini tespit ederek Destek/Direnç bölgelerini herhangi bir gecikme olmadan gerçek zamanlı olarak hesaplar. Ardından, yeni oluşan Destek/Direnç bölgesini doğrulamak için, Destek/Direnç bölgesinin dikkate alınabileceğini ve gerçek bir SAT veya AL sinyali olarak kullanılabileceğini gösteren özel bir sinyal gösterir
Sismograf Marketquake Dedektörü. Description in English : https://www.mql5.com/en/market/product/113869?source=Site+Market+Product+Page#description How to use the Seismograph : https://www.mql5.com/en/market/product/113869#!tab=comments&page=2&comment=52806941 Create an EA : https://www.mql5.com/en/market/product/113869#!tab=comments&page=3&comment=52816509 Hangi şekilde işlem yaparsanız yapın, düşük likidite piyasasına girmekten kesinlikle kaçınmak istersiniz.- Sismograf, piyasa rallisin
ŞU ANDA %40INDIRIMLI Yeni Başlayanlar veya Uzman Tüccarlar için En İyi Çözüm! Bu Gösterge benzersiz, yüksek kaliteli ve uygun fiyatlı bir ticaret aracıdır çünkü bir dizi tescilli özellik ve yeni bir formül ekledik. Sadece BİR grafik ile 28 Forex çifti için Döviz Gücünü okuyabilirsiniz! Yeni bir trendin veya scalping fırsatının tam tetik noktasını belirleyebildiğiniz için ticaretinizin nasıl gelişeceğini hayal edin? Kullanım kılavuzu: buraya tıklayın Bu ilk olan, orijinal! Değersiz bir özent
Introduction to Fractal Pattern Scanner Fractal Indicator refers to the technical indicator that makes use of the fractal geometry found in the financial market. Fractal Pattern Scanner is the advanced Fractal Indicator that brings the latest trading technology after the extensive research and development work in the fractal geometry in the financial market. The most important feature in Fractal Pattern Scanner is the ability to measure the turning point probability as well as the trend probabi
Auto Optimized Parabolic RSI: Gelişmiş 3D Momentum Motoru Çoğu perakende indikatörü, piyasa volatilitesi değiştiği an çöken statik girdilere dayandığı için başarısız olur. Auto Optimized Parabolic RSI, kendi matematiksel avantajını sürekli olarak yeniden hesaplayarak "indikatör körelmesi" (indicator decay) sorununu çözer ve kurumsal düzeyde kantitatif adaptasyonu doğrudan MT5 terminalinize getirir. Temel Avantaj: Özel Bellek İçi (In-Memory) 3D Optimizasyon   Standart otomatik optimize ediciler,
Trend Lines PRO
Roman Podpora
5 (1)
TREND ÇİZGİLERİ PRO     Piyasanın gerçek yön değişimini anlamaya yardımcı olur. Gösterge, gerçek trend dönüşlerini ve büyük oyuncuların piyasaya yeniden girdiği noktaları gösterir. Anlıyorsun     BOS hatları  Daha yüksek zaman dilimlerindeki trend değişiklikleri ve önemli seviyeler, karmaşık ayarlar veya gereksiz gürültü olmadan gösterilir. Sinyaller yeniden çizilmez ve çubuk kapandıktan sonra grafikte kalır. VERSION MT 5     -    RFI LEVELS PRO  göstergesiyle birlikte kullanıldığında maksimum p
The Propfolio Master Suite is the ultimate all-in-one analytical workstation for professional traders. Combining the power of the Beat The Market Maker (BTMM) methodology, Smart Money Concepts (SND/Liquidity), and Advanced Volume Profile, this suite replaces multiple different indicators with one optimized engine. Monitor up to 14 pairs simultaneously from a single chart, instantly identify market cycles, and seamlessly map institutional footprints with the click of a button. The Command Center
RFI levels PRO
Roman Podpora
5 (1)
Bu gösterge, fiyat dönüş noktalarını ve fiyat geri dönüş bölgelerini doğru bir şekilde gösterir.       Başlıca oyuncular   . Yeni trendlerin nerede oluştuğunu görüyorsunuz ve her işlem üzerinde kontrolü elinizde tutarak, azami hassasiyetle kararlar alıyorsunuz. TREND LINES PRO   göstergesiyle birlikte kullanıldığında maksimum potansiyelini ortaya koyar.  VERSION MT5 Göstergenin gösterdiği şey: Yeni bir trendin başlangıcında aktivasyonla birlikte tersine dönüş yapıları ve tersine dönüş seviyeler
Yazarın diğer ürünleri
Legacy of Gann
Pavel Zamoshnikov
4.83 (12)
The indicator very accurately determines the levels of the possible end of the trend and profit fixing. The method of determining levels is based on the ideas of W.D.Gann, using an algorithm developed by his follower Kirill Borovsky. Extremely high reliability of reaching levels (according to K. Borovsky  - 80-90%) Indispensable for any trading strategy – every trader needs to determine the exit point from the market! Precisely determines targets on any timeframes and any instruments (forex, met
HMA Color with Alerts MT5
Pavel Zamoshnikov
4.76 (58)
Hull Moving Average (HMA) is well-deservedly popular among traders because of the effective averaging of market noise and a relatively small delay. The current MetaTrader 5 version changes its color when the movement direction changes. Sound and text signals are available. It also supports sending email and push messages. It is possible to trigger a signal on the current incomplete bar, although such a signal may be canceled before completion if conditions are no longer appropriate. One of the p
FREE
HMA Trend
Pavel Zamoshnikov
4.55 (71)
A trend indicator based on the Hull Moving Average (HMA) with two periods. The Hull Moving Average is an improved variant of the moving average, which shows the moment of trend reversal quite accurately. It is often used as a signal filter. Combination of two types of Hull Moving Averages makes a better use of these advantages: HMA with a slow period identifies the trend, while HMA with a fast period determines the short-term movements and signals in the trend direction. Features The movement d
FREE
HMA Trend Professional MT5
Pavel Zamoshnikov
4.25 (4)
Improved version of the free HMA Trend indicator (for MetaTrader 4) with statistical analysis. HMA Trend is a trend indicator based on the Hull Moving Average (HMA) with two periods. HMA with a slow period identifies the trend, while HMA with a fast period determines the short-term movements and signals in the trend direction. The main differences from the free version: Ability to predict the probability of a trend reversal using analysis of history data. Plotting statistical charts for analyzi
The indicator automatically builds Support/Resistance levels (Zones) from different timeframes on one chart. Support-resistance levels are horizontal lines. As a rule, the market does not respond to a specific price level, but to a price range around the level, because demand and supply of market participants are not formed clearly on the line, but are “spread out” at a certain distance from the level. This indicator determines and draws precisely such a price range within which strong positi
Double HMA MTF for MT5
Pavel Zamoshnikov
4 (4)
This is an advanced multi-timeframe version of the popular Hull Moving Average (HMA) Features Two lines of the Hull indicator of different timeframes on the same chart. The HMA line of the higher timeframe defines the trend, and the HMA line of the current timeframe defines the short-term price movements. A graphical panel with HMA indicator data from all timeframes at the same time . If the HMA switched its direction on any timeframe, the panel displays a question or exclamation mark with a tex
Double HMA lines MTF
Pavel Zamoshnikov
5 (2)
This is a multi-timeframe version of the popular Hull Moving Average (HMA). The Double HMA MTF Light indicator combines two timeframes on a single chart. The HMA of the higher timeframe defines the trend, and the HMA of the current timeframe defines short-term price movements. The indicator is freely distributed and hasn't audio signals or messages. Its main function is the visualization of price movements. If you need advanced functionality of the HMA multi-timeframe indicator (information ab
FREE
Legacy of Gann for MT5
Pavel Zamoshnikov
5 (5)
The indicator very accurately determines the levels of the possible end of the trend and profit fixing. The method of determining levels is based on the ideas of W.D.Gann, using an algorithm developed by his follower Kirill Borovsky. Extremely high reliability of reaching levels (according to K. Borovsky  - 80-90%) Indispensable for any trading strategy – every trader needs to determine the exit point from the market! Precisely determines targets on any timeframes and any instruments (forex, met
Pattern 1 2 3 MT5
Pavel Zamoshnikov
4.38 (8)
The indicator automatically identifies the 1-2-3 pattern on the chart. The indicator is able to monitor the formation of pattern in real time. It informs the trader when the pattern is completely formed (when the price breaks the line in point 2) and displays the completed patterns in history. The patterns are never redrawn. The indicator can identify patterns on any instruments (currency pairs, stock market, gold, etc.) without the need to adjust to each instrument. Simple and clear visualizati
Double HMA MTF for MT4
Pavel Zamoshnikov
4.2 (5)
This is an advanced multi-timeframe version of the popular Hull Moving Average (HMA). Features Graphical panel with HMA indicator data from all timeframes at the same time . If the HMA has switched its direction on any timeframe, a question mark or exclamation mark is displayed on the panel, accompanied by a text and audio message. The messages can be configured separately for each timeframe using the corresponding checkboxes. The indicator is located in a separate window, so as not to overload
Pattern 1 2 3
Pavel Zamoshnikov
4.5 (24)
The indicator automatically identifies the 1-2-3 pattern on the chart. The indicator is able to monitor the formation of pattern in real time. It informs the trader when the pattern is completely formed (when the price breaks the line in point 2) and displays the completed patterns in history. The patterns are never redrawn. The indicator can identify patterns on any instruments (currency pairs, stock market, gold, etc.) without the need to adjust to each instrument. Simple and clear visualizati
Candle Pattern Finder MT5
Pavel Zamoshnikov
4.2 (5)
This indicator searches for candlestick patterns. Its operation principle is based on Candlestick Charting Explained: Timeless Techniques for Trading Stocks and Futures by Gregory L. Morris. If a pattern is detected, the indicator displays a message at a bar closure. If you trade using the MetaTrader 4 terminal, then you can download the full analogue of the " Candle Pattern Finder for MT4 " indicator It recognizes the following patterns: Bullish/Bearish (possible settings in brackets) : Hammer
This is advanced Multi-Symbol and Multi-Timeframe version of the "Candle Pattern Finder" indicator (search for candlestick patterns based on the book by Gregory L. Morris "Candlesticks charting explained. Timeless techniques for trading stocks and futures" ). The indicator searches for candlestick patterns for ALL symbols of the "Market Watch" window and for ALL standard timeframes from M1 to MN1. When patterns appear on any symbol / timeframe, the indicator gives a signal (text, sound, sending
Three Stochastics
Pavel Zamoshnikov
3.7 (10)
This indicator signals about crossing of the main and the signal lines of stochastic (lower stochastic) in the trend direction which is determined by two stochastics of higher time frames (higher stochastics). It is not a secret that stochastic generates accurate signals in a flat market and a lot of false signals in a protracted trend. A combination of two stochastics of higher time frames performs a good filtration of false signals and shows the main tendency. The indicator is recommended for
FREE
Trend Monitor MT5
Pavel Zamoshnikov
4.5 (2)
The indicator generates early signals basing on ADX reading data combined with elements of price patterns. Works on all symbols and timeframes. The indicator does not redraw its signals. You see the same things on history and in real time. For better visual perception signals are displayed as arrows (in order not to overload the chart). Features The best results are obtained when the indicator works on two timeframes. For example: M30 – the indicator shows the main trend; M5 – the indicator gen
CSV2Chart
Pavel Zamoshnikov
5 (3)
The script visually displays deals from CSV format reports on MT4 terminal charts. It automatically recognizes popular formats: MQL5.com Trading Signals for MT4 / MT5 platforms MyFXBook service Copy the report file to the <Data Folder>\MQL4\Files folder and run the script on any chart. The script analyzes the CSV file, automatically creates new charts for all instruments that are found in the report, and draws the deals of each instrument on a separate chart. The script additionally calculates a
FREE
The information panel displays important trading information on the chart. Visual display of the information will help you to make a prompt and precise trading decision. Screenshots depict information which I use in my trading system. But you can add any other desired information.  To do this contact me via MQL5 web-site. Displayed information: Time till the end of the current candle and formation of a new one. Time set format: hh:mm, if there is at least one full hour, or mm:ss, if you have les
FREE
The script automatically downloads historical data for all instruments from the "Market Watch" window, on all timeframes from M1 to MN1. It is recommended to use the script before launching multi-symbol and multi-timeframe indicators that work simultaneously with many instruments. Features: To download quotes, the script uses the MQL API only. This is a necessary requirement for publishing programs on the MQL-Market. This method is fast enough, but effective in not all cases. A more reliable (bu
FREE
Alarm Clock MT4
Pavel Zamoshnikov
3.67 (3)
Alarm Clock generates sound signal at the prescribed time. Time is set by a vertical line on the chart. Just shift this line on the chart to the future. After you set the line at the desired time, you can do whatever you want with the chart, like change a timeframe and a symbol - the alarm clock will generate a signal at the prescribed time anyway. If you accidentally remove the line, the indicator will restore it at the prescribed time. You can attach the indicator to different charts and set d
FREE
Trend Monitor
Pavel Zamoshnikov
4 (4)
The indicator generates early signals basing on ADX reading data combined with elements of price patterns. Works on all symbols and timeframes. The indicator does not redraw its signals. You see the same things on history and in real time. For better visual perception signals are displayed as arrows (in order not to overload the chart). Features Easy to use. Filter configuration only requires selection of sensitivity in the " Sensitivity of the indicator " input. Signals can be filtered using
Candle Pattern Finder
Pavel Zamoshnikov
5 (10)
The indicator finds candlestick patterns based on Gregory L.' Morris "Candlestick Charting Explained: Timeless Techniques for Trading Stocks and Futures". If a pattern is detected, the indicator displays a message at a bar closure. If you trade using the MetaTrader 5 terminal, then you can download the full analogue of the " Candle Pattern Finder for MT5 " indicator It recognizes the following patterns: Bullish/Bearish (possible settings in brackets) : Hammer / Shooting Star (with or without con
Stochastic Ichimoku
Pavel Zamoshnikov
4.43 (7)
This indicator signals about Stochastic crossing in the trend direction which is determined by the position of the price relative to the Ichimoku cloud. Features: Flexible settings: filtering signals by bullish/bearish bars ( parameter "BUY - the bullish bar only; SELL - the bear bar only" ); setting levels of Stochastic crossing ( parameters "BUY-signal if Stochastic below this level" and "BUY-signal if Stochastic below this level" ) ability to use the Ichimoku cloud of higher timeframes ( par
MACDivergence MTF
Pavel Zamoshnikov
4.29 (7)
Advanced ideas of the popular MACD indicator: It detects and displays classic and reverse divergences (three methods of detecting divergences). It uses different color to highlight an uptrend and a downtrend. Two methods of determining a trend: а) MACD crosses the 0 level (classic signal); б) MACD crosses its own average (early signal). This is a multi-timeframe indicator: it can display MACD data from other timeframes. Two methods of drawing: classic histogram and line. It generates sound and v
Parabolic SAR is one of the most popular indicators allowing you to determine in a timely manner the trend reversal, get an early entry point and accurately define the place of profit taking. Parabolic SAR is very efficient in case of a trendy market but often gives false signals during a flat. In order to sort such signals out, it is possible to use the same indicator on higher timeframes. This eliminates the main drawback of the indicator during a flat, while retaining its advantage of early e
HMA Trend Professional MT4
Pavel Zamoshnikov
4.57 (7)
Improved version of the free HMA Trend indicator (for MetaTrader 4) with statistical analysis. HMA Trend is a trend indicator based on the Hull Moving Average (HMA) with two periods. HMA with a slow period identifies the trend, while HMA with a fast period determines the short-term movements and signals in the trend direction. The main differences from the free version: Ability to predict the probability of a trend reversal using analysis of history data. Plotting statistical charts for analyzi
The indicator automatically builds Support/Resistance levels (Zones) from different timeframes on one chart. Support-resistance levels are horizontal lines. As a rule, the market does not respond to a specific price level, but to a price range around the level, because demand and supply of market participants are not formed clearly on the line, but are “spread out” at a certain distance from the level. This indicator determines and draws precisely such a price range within which strong positi
Market Calculator is a powerful tool that allows you to easily and quickly calculate the main parameters of a trade: Lot size, StopLoss and TakeProfit, as well as estimate the amount of funds (required Margin) to open a position. The program has a very convenient and intuitive control, because implemented in OS Windows style. There are many interesting and handy features - just watch the video: youtu.be/FG2qqTJTIhE All program data are sorted into sections in the form of tabs: " Lot Calculator "
This is advanced Multi-Symbol and Multi-Timeframe version of the " Candle Pattern Finder " program (search for candlestick patterns based on the book by Gregory L. Morris "Candlesticks charting explained. Timeless techniques for trading stocks and futures" ). This version is implemented as an Expert Advisor-assistant to reduce the load on the terminal. The EA does not trade on its own. The program searches for candlestick patterns for ALL symbols of the "Market Watch" window and for ALL standard
The "Spread Monitor" indicator allows you to analyze the spread change during the day, control the expansion of the spread by your broker and has a number of interesting additional features Choosing a broker with a minimum spread value is very important for the work of night advisors, scalping and intraday trading. However, the MT4 terminal does not store spread data, so the multifunctional "Spread Monitor" indicator will be useful for any intraday trader. Features: The indicator shows the curr
The indicator determines the state of the market (trend or flat) using the upgraded Bollinger Bands of higher timeframes and colors the bars in trend/flat colors. The indicator also gives signals (arrow on the chart + Sound and notification to Mail, Push): signal at the beginning of every new trend; signal inside the trend (entry at the end of the correction) Signals are never redrawn! How to use the indicator? The indicator works very well intraday. When using the indicator for intraday (TF M
Filtrele:
271811
199
271811 2023.03.21 04:37 
 

I change my position on this indicator...its actually quite good when you learn how to use it properly

Fxpro Trader Technical
1141
Fxpro Trader Technical 2022.03.16 16:53 
 

I bought this indicator 5-6 years ago, and seller still updating and improved until today, very happy and please, superb and greatly appreciated. Thank you

Pavel Zamoshnikov
154971
Geliştiriciden yanıt Pavel Zamoshnikov 2022.03.16 20:51
Thank you!
Tim Eubanks
5763
Tim Eubanks 2018.02.23 08:40 
 

This indicator uses too much cpu, and the signals are not so good.

Shumin Huang
219
Shumin Huang 2018.01.14 10:37 
 

Kullanıcı değerlendirmeye herhangi bir yorum bırakmadı

Ilya Krasheninnikov
373
Ilya Krasheninnikov 2017.10.11 14:27 
 

Kullanıcı değerlendirmeye herhangi bir yorum bırakmadı

Jerzy Zagorski
957
Jerzy Zagorski 2017.07.28 10:12 
 

Works well, good price

Aravind Kolanupaka
10229
Aravind Kolanupaka 2016.12.29 04:58 
 

Good indicator with currency cross over alerts.

Değerlendirmeye yanıt