Initial Balance Target Strategy

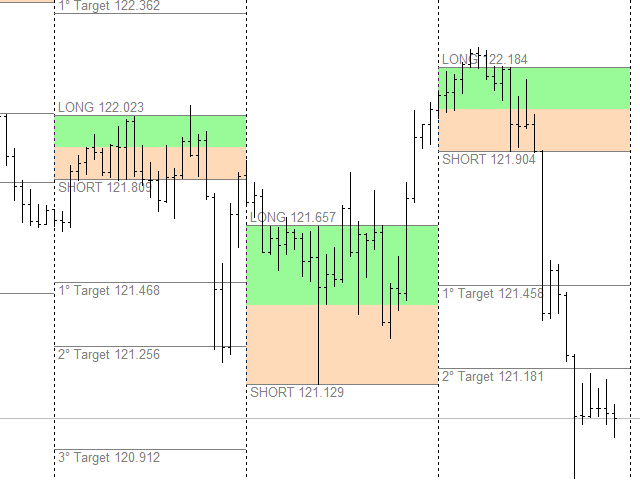
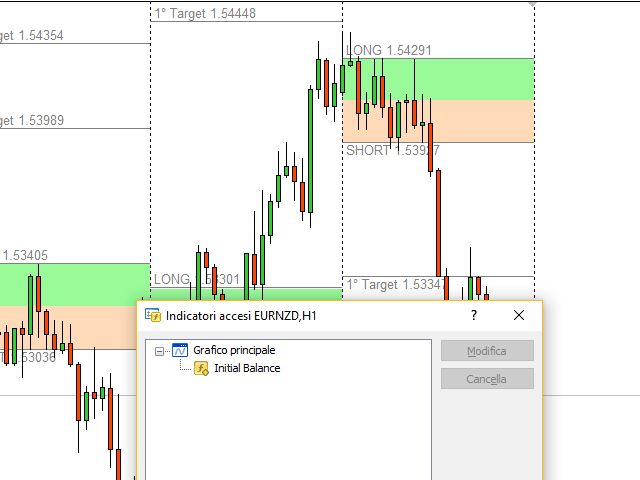
Initial Balance Target Strategy is an indicator based on Fibonacci Levels.

Its graphics flexibility allows you to adapt very well to your strategies or Trading System setting it with levels in input.

The analysis of the time range allows replication of strategies as London Breakout and Kiss.

The indicator is fully customizable, you can change colors, texts and percentages of Target.

The simplicity and manageability of this indicator makes it an useful tool for all Intraday Trader.
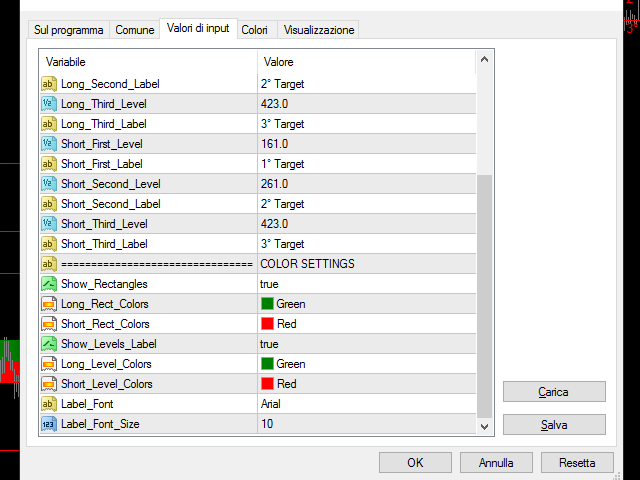

Input Values

  • Numbers of analisys (number of days to show levels)
  • TIME SETTINGS
    • Range_From
    • Range_End
  • LEVEL PRICE SETTINGS
    • 3 levels Long (percentage and text to show)
    • 3 levels Short (percentage and text to show)
    • Colors to set
  • COLOR SETTINGS
    • Show_Rectangles (true/false) to show/not show rectangles
    • Long_Rect_Colors
    • Short_Rect_Colors
    • Show_Levels_Label (true/false) to show/not show text levels
    • Long_Level_Colors
    • Short_Level_Colors
    • Label_Font
    • Label_Font_Size
Önerilen ürünler
Indicator Description GOLD TITAN KING SIGNAL INDICATOR High-Precision Gold Scalping Buy/Sell Signals – Manual Trading Assistant Overview The Gold Titan King Signal Indicator is a manual trading assistant tool designed for high-frequency scalping on Gold (XAUUSD) and other major pairs. It generates clear BUY/SELL signals with precise entry levels, along with adjustable Stop Loss and Take Profit levels displayed directly on the chart. ️ This tool is NOT an EA. It does not execute trades
SMC Venom Model BPR göstergesi, Akıllı Para (SMC) konseptinde çalışan yatırımcılar için profesyonel bir araçtır. Fiyat grafiğinde iki temel modeli otomatik olarak belirler: FVG   (Adil Değer Açığı), ilk ve üçüncü mum arasında boşluk bulunan üç mumun birleşimidir. Hacim desteğinin olmadığı seviyeler arasında bir bölge oluşturur ve bu da sıklıkla fiyat düzeltmesine yol açar. BPR   (Dengeli Fiyat Aralığı), bir "köprü" oluşturan iki FVG modelinin birleşimidir - bir kırılma bölgesi ve fiyatın düşük
VR Cub
Vladimir Pastushak
VR Cub , yüksek kaliteli giriş noktaları elde etmenin bir göstergesidir. Gösterge, matematiksel hesaplamaları kolaylaştırmak ve bir pozisyona giriş noktalarının aranmasını basitleştirmek için geliştirildi. Göstergenin yazıldığı ticaret stratejisi uzun yıllardan beri etkinliğini kanıtlamaktadır. Ticaret stratejisinin basitliği, acemi yatırımcıların bile başarılı bir şekilde ticaret yapmasına olanak tanıyan büyük avantajıdır. VR Cub, pozisyon açılış noktalarını ve Kâr Al ve Zararı Durdur hedef sev
Profesyonel trader’lar ve değerlendirme hesapları (Prop) için Risk Yönetimi ve Limit İzleme Göstergesi Bu araç, risk yönetimi ve limitlere ilişkin bilgileri grafikte yalnızca görüntüler ve karar verme sürecinde odaklanmanıza yardımcı olur. Gösterge hiçbir işlemi açmaz/kapatmaz/değiştirmez ve Uzman Danışmanlar (EA) ile çakışmaz. Özellikler Günlük ve toplam drawdown izleme Günlük ve toplam drawdown’ı Bakiye (Balance) veya Özsermaye (Equity) bazında hesaplar ve gösterir (ayar yapılabilir). Tanımla
Bu, bir mumun kapanış fiyatını tahmin eden bir göstergedir. Gösterge öncelikle D1 çizelgelerinde kullanılmak üzere tasarlanmıştır. Bu gösterge hem geleneksel forex ticareti hem de ikili opsiyon ticareti için uygundur. Gösterge, bağımsız bir ticaret sistemi olarak kullanılabilir veya mevcut ticaret sisteminize ek olarak hareket edebilir. Bu gösterge, mevcut mumu analiz ederek mumun gövdesi içindeki belirli güç faktörlerini ve önceki mumun parametrelerini hesaplar. Böylece gösterge, piyasa hareket
Blahtech Market Profile
Blahtech Limited
4.53 (15)
Was: $249  Now: $99   Market Profile defines a number of day types that can help the trader to determine market behaviour. A key feature is the Value Area, representing the range of price action where 70% of trading took place. Understanding the Value Area can give traders valuable insight into market direction and establish the higher odds trade. It is an excellent addition to any system you may be using. Blahtech Limited presents their Market Profile indicator for the MetaTrader community. Ins
Noize Absorption Index MT4
Ekaterina Saltykova
5 (1)
Noize Absorption Index - is the manual trading system that measures the difference of pressure between bears forces and bulls forces. Green line - is a noize free index that showing curent situation. Zero value of index shows totally choppy/flat market.Values above zero level shows how powerfull bullish wave is and values below zero measures bearish forces.Up arrow appears on bearish market when it's ready to reverse, dn arrow appears on weak bullish market, as a result of reverse expectation. S
Cosmic Diviner X Planet
Olena Kondratenko
4 (2)
This unique multi-currency strategy simultaneously determines the strength of trends and market entry points, visualizing this using histograms on the chart. The indicator is optimally adapted for trading on the timeframes М5, М15, М30, Н1. For the convenience of users, the indicator renders the entry point (in the form of an arrow), recommended take profit levels (TP1, TP2 with text labels) and the recommended Stop Loss level. The take profit levels (TP1, TP2) are automatically calculated for
VPPD:Ваш «Рентген» для графика. Простыми словами о сложном Представьте, что рынок — это большое здание. Обычные графики показывают вам только его фасад (цену). **VPPD** — это инструмент, который показывает вам чертежи несущих конструкций и подсчитывает, сколько людей зашли через парадный вход, а сколько вышли через черный. Это индикатор для MetaTrader 4, который показывает, где на самом деле находятся деньги крупных игроков и кто сейчас рулит рынком: покупатели или продавцы.   В чем суть
Fibonacci retracement and extension line drawing tool Fibonacci retracement and extended line drawing tool for MT4 platform is suitable for traders who use  golden section trading Advantages: There is no extra line, no too long line, and it is easy to observe and find trading opportunities Trial version: https://www.mql5.com/zh/market/product/35884 Main functions: 1. Multiple groups of Fibonacci turns can be drawn directly, and the relationship between important turning points can be seen
TWO PAIRS SQUARE HEDGE METER INDICATOR Try this brilliant 2 pairs square indicator It draws a square wave of the relation between your two inputs symbols when square wave indicates -1 then it is very great opportunity to SELL pair1 and BUY Pair2 when square wave indicates +1 then it is very great opportunity to BUY pair1 and SELL Pair2 the inputs are : 2 pairs of symbols         then index value : i use 20 for M30 charts ( you can try other values : 40/50 for M15 , : 30 for M30 , : 10 for H1 ,
PZ Harmonacci Patterns
PZ TRADING SLU
3.17 (6)
Trade smarter, not harder: Empower your trading with Harmonacci Patterns This is arguably the most complete harmonic price formation auto-recognition indicator you can find for the MetaTrader Platform. It detects 19 different patterns, takes fibonacci projections as seriously as you do, displays the Potential Reversal Zone (PRZ) and finds suitable stop-loss and take-profit levels. [ Installation Guide | Update Guide | Troubleshooting | FAQ | All Products ] It detects 19 different harmonic pric
Basic Support and Resistance Göstergimiz, teknik analizinizi artırmak için ihtiyacınız olan çözümdür.Bu gösterge, destek ve direnç seviyelerini grafikte yansıtmanıza olanak tanır/ MT5 sürümü Özellikler Fibonacci seviyelerinin entegrasyonu: Fibonacci seviyelerini destek ve direnç seviyelerinin yanı sıra görüntüleme seçeneğiyle, göstergemiz size piyasa davranışı ve olası tersine dönme alanları hakkında daha derin bir fikir verir. Performans Optimizasyonu: Genişletilmiş satırları yalnızca her ç
This is the FXTraderariel-TakeProfit - Stop Loss Indicator . It provides you 3 potential Take Profits and 1 Stop Loss. These potential targets are computed based on several methods . The indicator can be used on every time frame, but we advise to use it on H1, H4 and D1. Especially if you are a novice trader. Pro Traders can also you use it for scalping in smaller time frames (M1, M5 and M15). This indicator is not a complete trading system. It doesn't provide you a Signal nor can predict the m
Laguerre SuperTrend Clouds adds an Adaptive Laguerre averaging algorithm and alerts to the widely popular SuperTrend indicator. As the name suggests, Laguerre SuperTrend Clouds (LSC) is a trending indicator which works best in trendy (not choppy) markets. The SuperTrend is an extremely popular indicator for intraday and daily trading, and can be used on any timeframe. Incorporating Laguerre's equation to this can facilitate more robust trend detection and smoother filters. The LSC uses the impro
RSI Speed mp
DMITRII GRIDASOV
Crypto_Forex Göstergesi "RSI SPEED" MT4 için - harika bir tahmin aracı, Yeniden Boyama Yok. - Bu göstergenin hesaplanması fizik denklemlerine dayanmaktadır. RSI SPEED, RSI'nin kendisinin 1. türevidir. - RSI SPEED, ana trend yönündeki girişleri scalping için iyidir. - Uygun trend göstergesiyle birlikte kullanın, örneğin HTF MA (resimlerdeki gibi). - RSI SPEED göstergesi, RSI'nin yönünü ne kadar hızlı değiştirdiğini gösterir - çok hassastır. - Momentum ticaret stratejileri için RSI SPEED gösterg
The Th3Eng PipFinite indicator is based on a very excellent analysis of the right trend direction with perfect custom algorithms. It show the true direction and the best point to start trading. With StopLoss point and Three Take Profit points. Also it show the right pivot of the price and small points to order to replace the dynamic support and resistance channel, Which surrounds the price. And Finally it draws a very helpful Box on the left side on the chart includes (take profits and Stop loss
URGENCY “Limited launch pricing” “Price increases after version 2.0” Currencies Gold Momentum Flow Dashboard  — See Market Strength Instantly A powerful all-in-one dashboard that shows real-time momentum across multiple timeframes (M5–D1) for forex and gold. Multi-timeframe ROC analysis Built-in trade signals (alignment & momentum shifts) Currency strength meter Heatmap for instant trend recognition Alerts + one-click pair switching Stop switching charts — see the entire market in
EZT Trade History This is a great tool to analyze past trades or follow current ongoing trades, especially when you using an EA to manage your transactions. You will see the exact candle where the trade was opened and closed. Collapsible floating panel on the chart, free to move anywhere with your mouse. When you using multiple EA’s with different magic numbers, you have 5 options to separate those trades, so you will know which EA opened specific transactions. You can set the day limits how fa
Support and Resistance Zones MultiTimeframe
Mohamed Gamal Abdelnasser Yous Hashesh
A powerful indicator that highlights key market zones and helps traders identify potential opportunities across multiple timeframes. Designed for clarity and efficiency, it provides real-time alerts to keep you informed of important price levels. Key Features: Works on multiple timeframes: M1, M5, M15, M30, H1, H4, D1, W1, MN1. Customizable zone colors for each timeframe. Real-time alerts and notifications when price reaches significant zones. Automatically manages chart objects to keep your wo
For sure, this indicator has become very popular amongst traders. Through coding this indicator will give you the most accurate levels possible for your trading analysis. We have also added in the ability for you to receive alerts when the price breaks above or below a Support or Resistance lines! HOW TO USE The red rectangles represent your resistance/supply zone. The green rectangles represent your support/demand zone.  BONUS FEATURES We coded this indicator with the ability to switch between
The Best One Scalping Trade Panel functional manual trade panel with risk reward, auto SL by candle ( original solution), lot size calculation, one-click trading, scale in and out of trades (partial close),  Works with all symbols not just currency pairs, perfect works on DAX, NASDAQ, GOLD, ...... I earn every day during live stream on ZakopiecFX - join Me Risk by lot Risk by percent SL by points SL by Candle, Renko, RangeBar ( original solution) TP by point TP by Risk/Reward Auto Trailing by P
Super Reversal Pattern
Parfait Mujinga Ndalika
Super Reversal Pattern Indicator Unlock the power of advanced pattern recognition with our Super Reversal Pattern Indicator. Designed for traders seeking precision and reliability, this indicator identifies one of the most effective reversal patterns in technical analysis, offering a significant edge in your trading strategy. Key Features: Non-Repainting Accuracy: Enjoy the confidence of non-repainting technology. Once a Super Reversal Pattern is detected, it remains static, providing consiste
Price Magnet — Price Density and Attraction Levels Indicator Price Magnet is a professional analytical tool designed to identify key support and resistance levels based on statistical Price Density. The indicator analyzes a specified historical period and detects price levels where the market spent the most time. These zones act as “magnets,” attracting price action or forming a structural base for potential reversals. Unlike traditional Volume Profile tools, Price Magnet focuses on price-time d
This indicator is the mql4 version of the   SSLHybrid   indicator. MT5 Version Find out more here:  https://www.mql5.com/en/users/rashedsamir/seller Description of TradingView version: This script is designed for the NNFX Method, so it is recommended for Daily charts only. Tried to implement a few VP NNFX Rules This script has a SSL / Baseline (you can choose between the SSL or MA), a secondary SSL for continiuation trades and a third SSL for exit trades. Alerts added for Baseline entries, SSL2
Phase Analytics Pro: Advanced Cyclic Market Analyzer Phase Analytics Pro is a sophisticated technical tool designed for traders who prioritize mathematical precision over lag-heavy traditional indicators. Based on the principles of digital signal processing, this indicator decomposes price action into phase and quadrature components to identify the dominant market cycle. How it works: The algorithm calculates the instantaneous phase of the market, allowing it to distinguish between trending and
Point61 Indicator
Evgeniy Machok
5 (1)
The Point61 indicator is the result of many years of monitoring of price behavior of currency pairs and metals. It is not a secret, that in times of uncertainty, traders are looking for possible levels of support and resistance - the point, where price should stop its movement. There are 2 possible scenarios at these points: 1. Reverse (correction) to the opposite direction; 2. Breakthrough to continue movement. Very often these points are used to set stop orders - TakeProfit or StopLoss
PipFinite Exit EDGE
Karlo Wilson Vendiola
4.83 (115)
Did You Have A Profitable Trade But Suddenly Reversed? In a solid strategy, exiting a trade is equally important as entering. Exit EDGE helps maximize your current trade profit and avoid turning winning trades to losers. Never Miss An Exit Signal Again Monitor all pairs and timeframes in just 1 chart www.mql5.com/en/blogs/post/726558 How To Trade You can close your open trades as soon as you receive a signal Close your Buy orders if you receive an Exit Buy Signal. Close your Sell orders if
Belirtilen zaman dilimindeki Yüksek ve Düşük fiyatlara dayanarak otomatik olarak Fibo seviyelerini çizer Çoklu çubuklar   birleştirilebilir: örneğin, 10 günlük Yüksek ve Düşük fiyatlara dayalı bir Fibo elde edebilirsiniz Benim   #1   Aracım : 66+ özellik, bu gösterge dahil  |   Sorularınız için  iletişime geçin  |    MT5 sürümü Potansiyel dönüş seviyelerini görmeye yardımcı olur; Fibo seviyelerinde oluşan formasyonlar genellikle daha güçlüdür; Manuel   çizim   için   harcanan   zamanı   önemli  
Crypto_Forex Göstergesi MT4 için "Sabah Yıldızı deseni". - "Sabah Yıldızı deseni" göstergesi Fiyat Hareketi ticareti için çok güçlü bir göstergedir: Yeniden boyama yok, gecikme yok. - Gösterge grafikte boğa Sabah Yıldızı desenlerini algılar: Grafikte mavi ok sinyali (resimlere bakın). - PC, Mobil ve E-posta uyarılarıyla. - Ayrıca kardeşi - ayı "Akşam Yıldızı deseni" göstergesi mevcuttur (aşağıdaki bağlantıyı takip edin). - "Sabah Yıldızı deseni" göstergesi Destek/Direnç Seviyeleriyle birleştir
Bu ürünün alıcıları ayrıca şunları da satın alıyor
Scalper Inside PRO
Alexey Minkov
4.74 (69)
An exclusive indicator that utilizes an innovative algorithm to swiftly and accurately determine the market trend. The indicator automatically calculates opening, closing, and profit levels, providing detailed trading statistics. With these features, you can choose the most appropriate trading instrument for the current market conditions. Additionally, you can easily integrate your own arrow indicators into Scalper Inside Pro to quickly evaluate their statistics and profitability. Scalper Inside
Linear Trend Predictor - Giriş noktalarını ve yön destek çizgilerini birleştiren bir trend göstergesi. Yüksek/Düşük fiyat kanalını kırma prensibiyle çalışır. Gösterge algoritması piyasa gürültüsünü filtreler, oynaklığı ve piyasa dinamiklerini dikkate alır. Gösterge yetenekleri  Düzeltme yöntemleri kullanılarak piyasa trendi ve ALIM veya SATIŞ emirlerinin açılabileceği giriş noktaları gösterilir.  Herhangi bir zaman dilimindeki grafikleri analiz ederek kısa ve uzun vadeli piyasa hareketlerini
" Dynamic Scalper System " göstergesi, trend dalgaları içinde işlem yapmak için scalping yöntemi için tasarlanmıştır. Başlıca döviz çiftleri ve altın üzerinde test edilmiştir, diğer işlem araçlarıyla uyumluluğu mümkündür. Ek fiyat hareketi desteğiyle trend boyunca pozisyonların kısa vadeli açılması için sinyaller sağlar. Göstergenin prensibi. Büyük oklar trend yönünü belirler. Küçük oklar şeklinde scalping için sinyaller üreten bir algoritma trend dalgaları içinde çalışır. Kırmızı oklar yüksel
Trend Lines PRO
Roman Podpora
5 (1)
TREND ÇİZGİLERİ PRO     Piyasanın gerçek yön değişimini anlamaya yardımcı olur. Gösterge, gerçek trend dönüşlerini ve büyük oyuncuların piyasaya yeniden girdiği noktaları gösterir. Anlıyorsun     BOS hatları  Daha yüksek zaman dilimlerindeki trend değişiklikleri ve önemli seviyeler, karmaşık ayarlar veya gereksiz gürültü olmadan gösterilir. Sinyaller yeniden çizilmez ve çubuk kapandıktan sonra grafikte kalır. VERSION MT 5     -    RFI LEVELS PRO  göstergesiyle birlikte kullanıldığında maksimum p
NAM Order Blocks
NAM TECH GROUP, CORP.
3.67 (3)
MT4 Multi-timeframe Order Blocks detection indicator. Features - Fully customizable on chart control panel, provides complete interaction. - Hide and show control panel wherever you want. - Detect OBs on multiple timeframes. - Select OBs quantity to display. - Different OBs user interface. - Different filters on OBs. - OB proximity alert. - ADR High and Low lines. - Notification service (Screen alerts | Push notifications). Summary Order block is a market behavior that indicates order collection
GOLD Impulse with Alert
Bernhard Schweigert
4.67 (12)
Bu gösterge, 2 ürünümüz Advanced Currency IMPULSE with ALERT  +   Currency Strength Exotics  'in süper bir kombinasyonudur. Tüm zaman dilimleri için çalışır ve 8 ana para birimi artı bir Sembol için grafiksel olarak güç veya zayıflık dürtüsünü gösterir! Bu Gösterge, Altın, Egzotik Çiftler, Emtialar, Endeksler veya Vadeli İşlemler gibi herhangi bir sembol için para birimi gücü ivmesini göstermek için uzmanlaşmıştır. Türünün ilk örneğidir, Altın, Gümüş, Petrol, DAX, US30, MXN, TRY, CNH vb. içi
MTF Supply Demand Zones
Georgios Kalomoiropoulos
4.82 (22)
Yeni Nesil Otomatik Arz ve Talep Bölgeleri. Her Grafikte Çalışan Yeni ve Yenilikçi Algoritma. Tüm Bölgeler Piyasanın Fiyat Hareketine Göre Dinamik Olarak Oluşturulmaktadır. İKİ TÜR UYARI --> 1) FİYAT BİR BÖLGEYE ÇIKTIĞINDA 2) YENİ BİR BÖLGE OLUŞTURDUĞUNDA Bir tane daha işe yaramaz gösterge almazsın. Kanıtlanmış Sonuçlarla eksiksiz bir Ticaret Stratejisi elde edersiniz.     Yeni özellikler:     Fiyat Arz/Talep Bölgesine ulaştığında uyarılar     Yeni bir Arz/Talep Bölgesi oluşturulduğunda
Currency Strength Exotics
Bernhard Schweigert
4.88 (33)
ŞU ANDA %20 INDIRIMLI! Herhangi bir Acemi veya Uzman Tüccar için En İyi Çözüm! Bu Gösterge, Egzotik Çiftler Emtialar, Endeksler veya Vadeli İşlemler gibi herhangi bir sembol için para birimi gücünü göstermek için uzmanlaşmıştır. Türünün ilk örneğidir, Altın, Gümüş, Petrol, DAX, US30, MXN, TRY, CNH vb. gerçek para birimi gücünü göstermek için 9. satıra herhangi bir sembol eklenebilir. Bu benzersiz, yüksek kaliteli ve uygun fiyatlı bir ticaret aracıdır çünkü bir dizi tescilli özelliği ve yeni b
MetaForecast M4
Vahidreza Heidar Gholami
5 (2)
MetaForecast, fiyat verilerindeki harmonileri kullanarak herhangi bir piyasanın geleceğini tahmin eder ve görselleştirir. Piyasa her zaman tahmin edilemezken, fiyatlarda bir desen varsa, MetaForecast geleceği mümkün olduğunca doğru bir şekilde tahmin edebilir. Benzer ürünlere göre, MetaForecast piyasa eğilimlerini analiz ederek daha kesin sonuçlar üretebilir. Giriş Parametreleri Past size (Geçmiş boyut) MetaForecast'ın gelecekteki tahminler oluşturmak için kullandığı çubuk sayısını belirtir. Mo
Introducing the Delta Volume Profile Indicator - Unleash the Power of Institutional Precision!  Technical Indicator: Are you ready to trade like the pros? The Delta Volume Profile Indicator is no ordinary tool. It’s a high-precision, cutting-edge indicator that puts the power of institutional-grade trading in your hands. This unique indicator analyses delta volume distribution in real-time, revealing the market's hidden buy/sell imbalances that the biggest financial institutions rely on to antic
Dynamic Forex28 Navigator
Bernhard Schweigert
4.43 (7)
Dynamic Forex28 Navigator - Yeni Nesil Forex Ticaret Aracı. ŞU ANDA %49 İNDİRİM. Dynamic Forex28 Navigator, uzun zamandır popüler olan göstergelerimizin evrimidir ve üçünün gücünü tek bir göstergede birleştirir: Gelişmiş Döviz Gücü28 Göstergesi (695 inceleme) + Gelişmiş Döviz İMPULS ve UYARI (520 inceleme) + CS28 Kombo Sinyalleri (Bonus). Gösterge hakkında ayrıntılar https://www.mql5.com/en/blogs/post/758844 Yeni Nesil Güç Göstergesi Ne Sunuyor?  Orijinallerde sevdiğiniz her şey, şimdi yeni
RFI levels PRO
Roman Podpora
5 (1)
Bu gösterge, fiyat dönüş noktalarını ve fiyat geri dönüş bölgelerini doğru bir şekilde gösterir.       Başlıca oyuncular   . Yeni trendlerin nerede oluştuğunu görüyorsunuz ve her işlem üzerinde kontrolü elinizde tutarak, azami hassasiyetle kararlar alıyorsunuz. TREND LINES PRO   göstergesiyle birlikte kullanıldığında maksimum potansiyelini ortaya koyar.  VERSION MT5 Göstergenin gösterdiği şey: Yeni bir trendin başlangıcında aktivasyonla birlikte tersine dönüş yapıları ve tersine dönüş seviyeler
Adaptive Volatility Range [AVR] is a powerful tool for identifying key trend reversal points. AVR accurately reflects the Average True Range (ATR) of volatility, taking into account the Volume-Weighted Average Price (VWAP). The indicator adapts to any market volatility by calculating the average volatility over a specific period, ensuring a stable rate of profitable trades. You receive not just an indicator but a professional automated trading system , AVR-EA . Advantages: Automated Trading Sys
TPSpro RFI Levels
Roman Podpora
4.86 (28)
TALİMATLAR RUS  /  TALİMATLAR   ENG  /  Sürüm MT5 Ana fonksiyonları: Satıcı ve alıcıların aktif bölgelerini görüntüler! Gösterge, satın alma ve satışlar için tüm doğru ilk dürtü seviyelerini/bölgelerini görüntüler. Giriş noktaları arayışının başladığı bu seviyeler/bölgeler etkinleştirildiğinde, seviyeler renk değiştirir ve belirli renklerle doldurulur. Ayrıca, durumun daha sezgisel bir şekilde algılanması için oklar görünür. LOGIC AI - Bir şablonu etkinleştirirken giriş noktalarını aramak için
BTMM State Engine Pro is a MetaTrader 4 indicator for traders who use the Beat The Market Maker approach: Asian session context, kill zone timing, level progression, peak formation detection, and a multi-pair scanner from a single chart. It combines cycle state logic with a built-in scanner dashboard so you do not need the same tool on many charts at once. What it does Draws the Asian session range; session times can follow broker server offset or be set in inputs. Tracks level progression (L
Volatility Trend System - girişler için sinyaller veren bir ticaret sistemi. Oynaklık sistemi, trend yönünde doğrusal ve noktasal sinyaller ve ayrıca yeniden çizme ve gecikme olmaksızın trendden çıkmak için sinyaller verir. Trend göstergesi, orta vadeli trendin yönünü izler, yönünü ve değişimini gösterir. Sinyal göstergesi volatilitedeki değişikliklere dayalıdır ve piyasa girişlerini gösterir. Gösterge, çeşitli uyarı türleri ile donatılmıştır. Çeşitli alım satım araçlarına ve zaman dilimlerine
Looking for a powerful yet lightweight swing detector that accurately identifies market structure turning points? Want clear, reliable buy and sell signals that work across any timeframe and any instrument? Buy Sell Arrow MT Swing is built exactly for that — precision swing detection made simple and effective. This indicator identifies Higher Highs (HH) , Higher Lows (HL) , Lower Highs (LH) , and Lower Lows (LL) with remarkable clarity. It is designed to help traders easily visualize market stru
Şu anda %40 İNDİRİMLİ! Herhangi bir Acemi veya Uzman Tüccar için En İyi Çözüm! Bu gösterge paneli yazılımı 28 döviz çifti üzerinde çalışıyor. Ana göstergelerimizden 2'sine (Gelişmiş Para Birimi Gücü 28 ve Gelişmiş Para Birimi Dürtüsü) dayanmaktadır. Tüm Forex piyasasına harika bir genel bakış sağlar. Gelişmiş Para Birimi Gücü değerlerini, para birimi hareket hızını ve tüm (9) zaman dilimlerinde 28 Forex çifti için sinyalleri gösterir. Trendleri ve / veya scalping fırsatlarını belirlemek için
Trend Screener
STE S.S.COMPANY
4.79 (95)
Trend Göstergesi, Trend Alım Satım ve Filtreleme için Çığır Açan Benzersiz Çözüm, Tüm Önemli Trend Özellikleriyle Tek Bir Araç İçinde Yerleştirildi! Forex, emtialar, kripto para birimleri, endeksler ve hisse senetleri gibi tüm sembollerde/araçlarda kullanılabilen %100 yeniden boyamayan çoklu zaman çerçevesi ve Çoklu para birimi göstergesidir. SINIRLI SÜRELİ TEKLİF: Destek ve Direnç Tarama Göstergesi sadece 50$ ve ömür boyu mevcuttur. (Orijinal fiyat 250$) (teklif uzatıldı) Trend Screener, grafik
GEM Signal Pro GEM Signal Pro, MetaTrader 4 için geliştirilmiş bir trend takip göstergesidir ve daha net sinyaller, daha düzenli işlem kurulumları ve daha pratik risk yönetimini doğrudan grafik üzerinde görmek isteyen yatırımcılar için tasarlanmıştır. Sadece basit bir ok göstermek yerine, GEM Signal Pro işlem fikrinin tamamını daha temiz ve daha okunabilir bir şekilde sunmaya yardımcı olur. Koşullar onaylandığında, gösterge giriş fiyatını, stop loss seviyesini ve take profit hedeflerini grafik ü
Miraculous Göstergesi – Gann Dokuz Kareye Dayalı %100 Tekrarlamayan Forex ve İkili Araç Bu video, Forex ve İkili Opsiyon traderları için özel olarak geliştirilmiş son derece doğru ve güçlü bir ticaret aracı olan Miraculous Göstergesi 'ni tanıtıyor. Bu göstergeyi benzersiz kılan, efsanevi Gann Dokuz Karesi ve Gann Titreşim Yasası 'na dayanmasıdır; bu da onu modern ticarette mevcut en hassas tahmin araçlarından biri yapmaktadır. Miraculous Göstergesi tamamen tekrarlamaz ; yani mum kapandıktan son
Grafikleri yapılandıran ve döngüsel fiyat hareketlerini belirleyen teknik bir gösterge. Herhangi bir grafik üzerinde çalışabilirim. Birkaç çeşit bildirim var. Grafiğin kendisinde ek oklar var. Tarihe yeniden bakmadan, mumun kapanışına dair çalışmalar. M5 ve üzeri TF önerilir. Kullanımı ve yapılandırması kolay parametreler. Farklı parametrelere sahip 2 indikatörü kullanırken, bunları diğer indikatörler olmadan da kullanabilirsiniz. 2 giriş parametresi vardır Döngüsellik ve Sinyal Süresi Bu 2 pa
System Trend Pro
Aleksandr Makarov
5 (2)
System Trend Pro - This is the best trend trading indicator!!! The indicator no repaint!!!  The indicator has   MTF   mode, which adds confidence to trading on the trend (   no repaint   ). How to trade? Everything is very simple, we wait for the first signal (big arrow), then wait for the second signal (small arrow) and enter the market in the direction of the arrow. (See screens 1 and 2.) Exit on the opposite signal or take 20-30 pips, close half of it, and keep the rest until the opposite
Bu gösterge, pratik ticaret için mükemmel olan otomatik dalga analizine yönelik bir göstergedir! Dava... Not:   Dalga sınıflandırması için Batılı isimleri kullanmaya alışkın değilim. Tang Lun'un (Tang Zhong Shuo Zen) adlandırma kuralının etkisiyle, temel dalgayı   kalem   , ikincil dalga bandını ise   segment   olarak adlandırdım. aynı zamanda segmentin trend yönü vardır. Adlandırma   esas olarak trend segmentidir   (bu adlandırma yöntemi gelecekteki notlarda kullanılacaktır, öncelikle söyleyey
Öncelikle, bu Ticaret Aracının Non-Repainting, Non-Redrawing ve Non-Lagging Gösterge olduğunu vurgulamakta fayda var, bu da onu profesyonel ticaret için ideal hale getiriyor. Çevrimiçi kurs, kullanıcı kılavuzu ve demo. Akıllı Fiyat Hareketi Kavramları Göstergesi, hem yeni hem de deneyimli tüccarlar için çok güçlü bir araçtır. İleri ticaret fikirlerini, Inner Circle Trader Analizi ve Smart Money Concepts Ticaret Stratejileri gibi 20'den fazla kullanışlı göstergeyi bir araya getirerek bir araya g
Supply and Demand Dashboard PRO
Bernhard Schweigert
4.8 (20)
Şu anda %40 İNDİRİMLİ! Bu gösterge paneli, birden fazla sembol ve 9 zaman dilimine kadar çalışan çok güçlü bir yazılım parçasıdır. Ana göstergemize dayanmaktadır (En iyi yorumlar: Advanced Supply Demand ).     Gösterge paneli harika bir genel bakış sağlar. Gösterir:    Bölge mukavemet derecesi dahil filtrelenmiş Arz ve Talep değerleri, Bölgelere/ve bölgeler içindeki pip mesafeleri, İç içe geçmiş bölgeleri vurgular, Tüm (9) zaman dilimlerinde seçilen semboller için 4 çeşit uyarı verir. Kişisel
TPSproTREND PrO
Roman Podpora
4.67 (27)
TPSproTrend PRO       - Bu, piyasayı otomatik olarak analiz eden ve trend ile değişimleri hakkında bilgi veren, ayrıca alım satım için giriş noktalarını gösteren bir trend göstergesidir.       Yeniden çizmeden! ИНСТРУКЦИЯ RUS   -   TALİMATLAR   ENG   -   VERSİYON MT5 Başlıca işlevler: Doğru giriş sinyalleri       BOYAMAYA GEREK YOK! Bir sinyal göründüğünde, geçerliliğini korur! Bu, sinyal verip daha sonra değiştirebilen ve potansiyel olarak yatırım kayıplarına yol açabilen yeniden boyama göster
The Nihilist 5.0 Indicator includes Forexalien and Nihilist Easy Trend trading strategies and systems. It is composed of an MTF Dashboard where you can analyze the different input possibilities of each strategy at a glance. It has an alert system with different types of configurable filters. You can also configure which TF you want to be notified on your Metatrader 4 platform and Mobile application The indicator has the option to view how could be a TP and SL by using ATR or fixed points, even w
No Repaint Bext
Andrey Kozak
1 (1)
No Repaint Bext is a ready-made trading system. Shows when to open and when to close trades, as well as in which direction. Every time a green arrow appears, you need to open a buy trade. Close all buy trades when a red arrow appears. The same goes for the opposite direction, every time a red arrow appears, open sell trades and close them all when a green arrow appears. We use the M5 timeframe for trading. You can trade on any cozy pair. This indicator does not repaint and practically does not
GoldRush Trend Ok Sinyali GoldRush Trend Ok Sinyali göstergesi, XAU/USD'de yüksek hızlı, kısa vadeli scalperlar için özel olarak tasarlanmış hassas, gerçek zamanlı trend analizi sağlar. 1 dakikalık zaman dilimi için özel olarak tasarlanan bu araç, net giriş noktaları için yön okları gösterir ve scalper'ların değişken piyasa koşullarında güvenle hareket etmelerini sağlar. Gösterge, PRIMARY ve SECONDARY uyarı oklarından oluşur. PRIMARY sinyalleri, trend yönündeki değişikliği gösteren Beyaz ve
Yazarın diğer ürünleri
Time Range Separator  is a useful tool to display a separator period on your platform. You could go in the properties of the indicator, select the desired range and that's ALL. We believe it is a useful and necessary that we wish to share with you for free all our followers. Input Values: TimeFrame = Period Separator Separator_Color = Vertical Color Line Separator_Style = Vertical Color Style Separator_Width = Vertical Line Width Good trading to all and see you soon. Same indicator for MT4 here
FREE
Delta Single Volume is a very powerful indicator that reads the supply on the Market. It calculates the Delta from movement of the price and the difference of BUY and SELL volumes. Its special structure allows you to get all timeframe values available on the MT5 platform. It works on Tick Volumes and Real Volumes (if avalaibles on your Broker). A good observation of this instrument can suggest great entry points and possible reversal. We are confident that this tool will help you to improve you
Time Range Separator
Chantal Sala
4.83 (6)
Time Range Separator is a useful tool to display a separator period on your platform. You could go in the properties of the indicator, select the desired range and that's ALL. We believe it is a useful and necessary that we wish to share with you for free all our followers. Input Values: TimeFrame Period Separator GMT_Hour (ex. +1 or -1) to move the lines at Period Time +/- tot hours in input Hide_dates to show or hide the datetime on vertical lines VLine_Color = Vertical Color Line VLine_Style
FREE
Target Geometry
Chantal Sala
4 (4)
Target Geometry is a next-generation indicator that uses the geometric nature of the markets to give high statistical probability levels ( Fibonacci ). This indicator creates a very important map that optimizes the entry points and it optimally defines your own money management. The indicator can be used both in static mode or in dynamic mode, you can use it on any financial instrument. The use in multi timeframe mode is a very good ally to have. The target levels are high statistical probabilit
This is a utility to copy in Expert Advisor folder. The EA will force the download of your History Center MetaTrader. It will not download new data from your broker but it will aid your MT4 to charge every chart correctly. You can choose the symbols to download. After the launch, the EA will be removed automatically from the chart. After the launch, you can see results under Experts panel on MT4. The log will show you the data charged or not charged. Symbol TF = Number of candles charged. Ex: Su
FREE
Volume Spyke
Chantal Sala
4 (1)
The Volume Spike indicator is a useful tool to identify the directional market's intention. How Does It Work: The Volume Spike indicator identifies the volume peaks and creates a sensitive rectangle equipped with Alert and Warning Pop Up that it suggests the market's direction. This tool has the ability to select the time frame on which to do the analysis of volume and it gives a great visual signal colored into rectangle. The indicator can identify valid market signals but it can also suggest
HLOC
Chantal Sala
5 (3)
High Low Open Close Levels The indicator HLOC is a good ally to correctly identify the appropriate trend of price. The indicator is designed to be minimally invasive and it shows a visual and sound aid in order to take decision on the market. The indicator is equipped with sound alert and window alert in order to have a reminder of the price movements. We suggest you watch the video below to evaluate its operational benefits. Input values: Show Level (true/false) TimeFramePeriod (refer to lines
InfoPanelMarket
Chantal Sala
3.5 (4)
Informational indicator which shows: Swap Price under/upper Open for every Time Frame Spread Time to close the current candle Broker Time Net Change: delta in percentage from Open (MN-W1-D1) Tick Value Volumes Info for every trades open: Lots Breakeven Profit Buy-Profit Sell Equity Symbol Positive values are green and negative values are red (modifiable in input). Inputs: View BE line (enable/disable) View all Symbol (shows the list of symbol) Color (for every text) Line Color (for BE line)
This panel is very simple to use and it is a very ally to manage your positions and orders. Also you can modify your risk, writing in fields directly on Panel. One click on buttons and the operation on market is done! Operations possible: BUY/SELL Break Even Split (close 50% all orders) Close All positions Hedging (opens reverse positions to cover) Close only BUY positions Close only SELL positions Close All pending orders Reverse all positions Please watch the video to verify the very simple u
BreakEven Line is a very useful and easy to use indicator. In case of multiple positions opened on the same instrument, the indicator shows the breakeven point where it is possible to close the positions. Its graphic simplicity makes it an unobtrusive and customizable tool. You can enable/disable a line on a chart, so you can make the indicator invisible. Inputs Show cumulative BE (line on/off) Breakeven line color (to change the line color) Breakeven line style Breakeven line width Show short B
Volume POC
Chantal Sala
5 (1)
Volume POC The Volume POC indicator displays important levels. You can use it as an independent trading system. Warning functions at a candle closing allow you to have some information on the market direction. The graphical display is simple and effective. The levels reported are the result of the study of historical market volumes. These levels give excellent entry points and excellent levels of support and resistance. You can use the indicator also on very low timeframes. It is suitable for t
The Open All indicator uses a simple market information that is "Open Candle". This tool is able to show all the openings of all time frames in order to extract information of strength and trendy. You can display 28 instruments with relative time frame interior for a total of 252 informations. The display is fully customizable, you can choose either the symbol and enable/disable Time Frames. Using it correctly you could get valuable aid to intercept correlations and turning points in the market.
The indicator Net Change is a very useful tool able to extrapolate a percentage in order to have a real reference on the performance of the instrument. This indicator is designed to show the main values: you could monitor the Daily, Weekly, Monthly, Quarterly, Semi-annual and Annual percentages. A necessary tool for those who want to really explore the quantitative logic of the market. Input values SYMBOLS SETTINGS Use_Only_Current_Symbol (true/false): Permits to manage only current symbol on p
Best And Worst
Chantal Sala
5 (1)
The Best and Worst indicator (similar to Net Change Indicator) has the peculiarity of being a dynamic indicator. It seems a very Stock Exchange Indicator. This means that it is able to draw up a list and put in order the best and worst instruments in descending order. You can choose to show the percentage of any Time Frame: 1M, 5M, 15M, 30M, H1, H4 etc ... This instrument could really give great suggestions on your trading in order to center the right time and to have a total view of the markets
Delta Single Volume
Chantal Sala
3.67 (3)
Volume Delta is a very powerful indicator that reads the supply on the Market. It calculates the Delta from movement of the price and the difference of BUY and SELL Tick volumes. Its special structure allows you to get all timeframe values available on the MT4 platform. A good observation of this instrument can suggest great entry points and possible reversal. We are confident that this tool will help you to improve your trading timing. See also for MT5:  https://www.mql5.com/en/market/product/5
Volume Delta Panel
Chantal Sala
4.8 (10)
Volume DeltaPanel is a very powerful indicator that read the supply on Market. It calculates the Delta from movement of the price and the difference of BUY volumes and SELL volumes. The Volumes are added to price and normalized to symbol points. Its special structure allows you to get all Time Frames values available on the platform MT4. Panel can show 28 instruments simultaneously all customizable according to the offer of the Broker. A good observation of this instrument can suggest great ent
Price Trend Light indicator is a beautiful indicator that shows purchasing areas and sales areas. This indicator is designed to follow the movement of the price which rounds on the opening price. It also provides information of trend follow on the break of the minimum and maximum. The indicator has a very simple graphic but effective, above the opening price you will have a light green color and under the opening price there is a red light. On every Break Out of the minimum or maximum sets in in
The indicator Power Strength creates a virtual display that takes data from all Symbols. It extrapolates all the informations in order to get the strength and / or weakness to take a decision on market. This tool works only on the Forex Market and not processing data on indices, metals ... It is graphically very attractive and its simplified information could give excellent input signals. You can use this indicator to find inputs on daily or short-term operations or scalping. Input Values PANEL
Zoom Price It is a very useful tool that is designed to ZOOM the price positioning on one of the 4 corners of the graph. In addition to display function of the price indicator, Zoom Price is equipped with a check on Bullish or Bearish Breakout Signal that change the label color. Zoom Price is a simple tool that can provide useful informations to improve your operational performance. Input Values: myPeriod - TF to consider for Break Out O Signal LABEL SETTINGS Bullish BreakOut Color Bearish Break
The Price Action Dashboard is an innovative tool to help the trader to control a large number of financial instruments. This tool is designed to automatically suggest signals and price conditions. The Dashboard analyzes all major Time Frame suggesting price action conditions with graphic elements. The Dashboard can suggest you the strength of the trend identifying directional movement, it is an indispensable tool for those who want to open position themselves using market trends identifiers. The
Master Trend Dashboard is a new generation indicator, compact, light and efficient. Each element of this Dashboard is designed to return specific signals as: Price Action, Breakout, Net Change (performance of the instrument), algorithmic studies, correlations and statistical calculations. This tool will change your way of trading allowing you to receive important information. See the Graphic Signals to understand every single signal below: Graphic Signals Symbol name and arrow color Green = Cur
Box Chart
Chantal Sala
4.5 (2)
The indicator Box Chart is a very useful analysis tool that allows you to know the value of the range in points. The range is written in a label and also it is draw in a rectangle. This indicator works on multi timeframe and you can upload more indicators on same chart to analyze more time frames ranges. The analysis of the range is done following W. G. Gann school. The observation of the range on little time frame returns some good information of trend or reversal. Box Chart is a simple indicat
The Navigator is a next-generation panel very easy to use. Apply this indicator on the chart to navigate very quickly through all the symbol and timeframes listed in input. The arrows manage the zoom and time frames. You can customize both the graphic colors and the list of symbols to display. A quick and easy tool that it will help to analyse the charts. Input Values Show_TF_Panel (true/false) it permits to show/hide panel with TF and Arrows 32 symbols COLORS AND SIZE SETTINGS BUTTON_WIDTH But
Market Pressure is a next-generation display. Its simple and intuitive graphics system allows you to receive directions very easy and fast. This indicator can give three different methods of signals: Scalping, Intraday and Multiday. The logic is based on the price action which combined on multiple time frame. It can give very high quality signals. An indispensable tool for those who want to understand the market pressure and the operating trend. The indicator is customizable for both colors for
OCO News Order Manager in an Expert Advisor to Trading News . The usability makes this tool an excellent ally for FAST operations on NEWS Time. We recommend that you try it on demo account to understand what kind of decimals using your broker to set your input values. The EA is usable on every Markets. On news time the spread could be manage from Broker, please make attention. Main functionalities Open STOP PENDINGS ORDER a number of seconds (in input) before News Time Floating of pending order
Dax Scalping Bracket is a new generation Expert Advisor Panel. This a very professional tool for SCALPING. The usability makes this tool an excellent ally for FAST operations of SCALPING on Index instruments and Forex market. The main feature of this EA is the ability to open multiple operations with a single click. Each position is autonomous and you can set different take profit and stop loss for each position. Special functionalities: STOP MOVE to manage your stop chasing the price BREAK EVEN
Bid Ask Level is a very simple indicator but, at the same time, very powerful . Using the logic of the minimum and maximum of the previous periods is able to intercept the important levels of demand and supply. The indicator permits setting the numbers of history candles to read very important levels in the past and show them in the current chart. You can see these power levels with horizontal lines designed on the chart. The indicator also permits uploading many different levels (of different t
Market Pressure Dashboard is a new generation utility. Its main function is to assist you and give you operational ideas optimizing your analytical work. Using this utility you could monitor a lots of financial instruments (max 28 symbols FOREX) in a very simple way. The Market Pressure indicator allows you to customize the internal list of the symbols to be monitored. The opening function and position management with this panel will be much more comfortable and navigation charts very powerful.
Risk Reward indicator is a very useful tool that allows you to observe in real time the performance risk of a trade. Its use is very simple, just drag it into the chart and see the Risk Reward percentage (for ex: 1:2). We have also included the possibility of extending/reducing the lines in order to observe the important price levels. You can change your levels clicking directly on lines and dragging the level to a new position. The levels will be set very fast with only a click. The indicator k
Open Line
Chantal Sala
3 (1)
The Open Line indicator is a simple indicator that tracks the opening levels of more time sessions. This version allows the user to check the opening levels using different time time frames. It is possible to add on the same chart different Open Lines to have more important horizontal levels. The colors and lines are fully customizable also for the label text. A simple indicator but very powerful to give you a proper orientation for your trading. Input Values TimeFrame (to show the open price t
Filtrele:
Değerlendirme yok
Değerlendirmeye yanıt