WaveMarkers MT4

Wave Markers: Çoklu zaman dilimli panele sahip uyarlanabilir dalga haritası

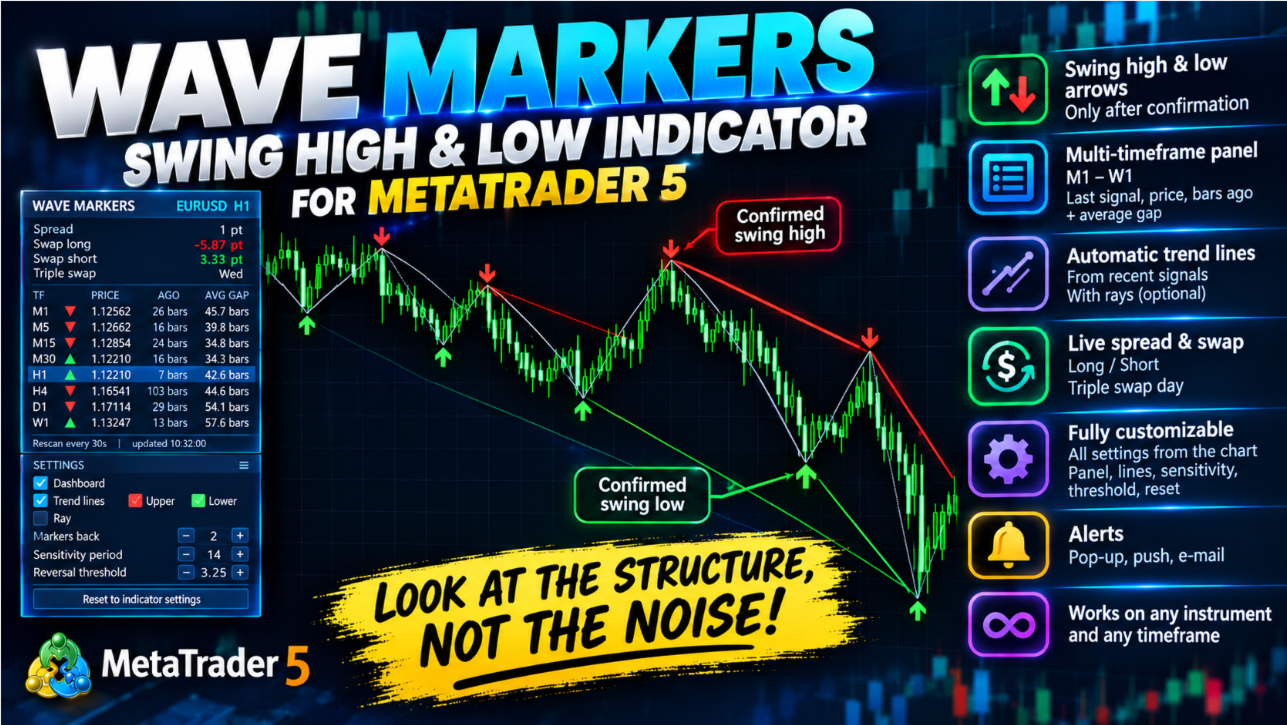
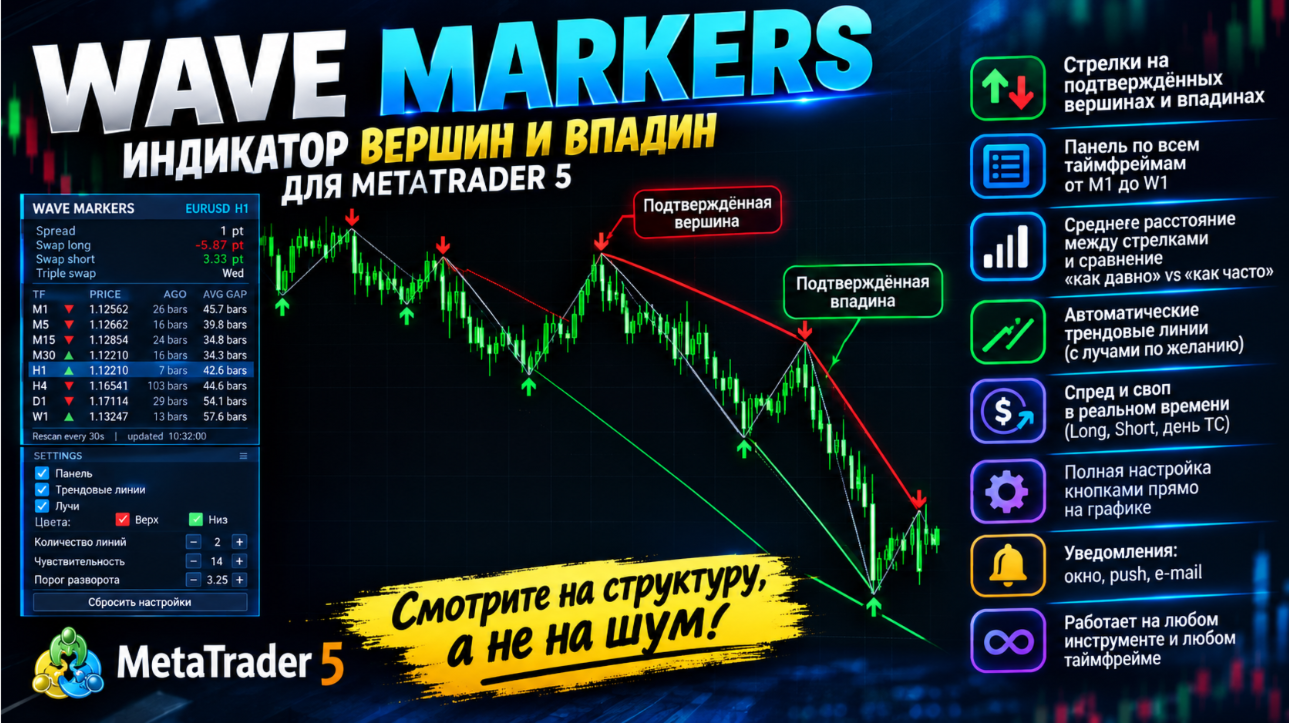
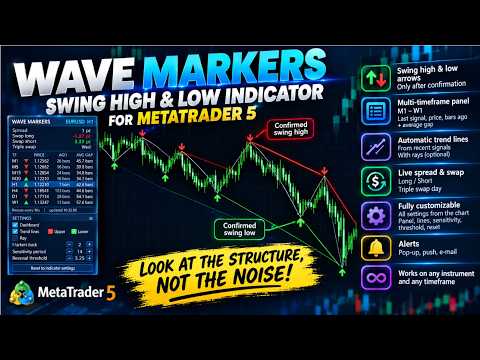
Gürültüyü değil, piyasanın gerçek yapısını görün: onaylanmış salınım tepeleri ve dipleri, bunlardan geçen trend çizgileri ve M1'den W1'e kadar tüm zaman dilimlerinin durumu, tek bir panelde.

Nedir?

Wave Markers, MetaTrader 5 için bir grafik yapısı göstergesidir. Fiyatın dönüş noktalarını (salınım tepeleri ve salınım dipleri) bulur, bunları net oklarla işaretler ve çevresinde çalışma araçları kurar: trend çizgileri, tüm zaman dilimlerini gösteren bir tablo, ayrıca anlık spread ve swap bilgisi.

"Al" veya "sat" komutu vermez ve herhangi bir sonuç vaat etmez. Tek bir işi yapar ve onu titizlikle yapar: piyasanın gerçekte nerede döndüğünü göstererek yapıyı daha hızlı ve daha tutarlı okumanıza yardımcı olur.

Neden sıradan bir ZigZag değil?

Klasik bir ZigZag, neyin dönüş sayılacağına sabit bir mesafeyle (puan veya yüzde) karar verir. Bu tek sayı çoğu zaman yanlıştır: sakin piyasada çok büyüktür (gerçek dalgaları kaçırırsınız), hızlı piyasada çok küçüktür (gürültü toplarsınız).

Wave Markers farklı çalışır:

  • Dönüş eşiği, güncel volatiliteye göre kendini ayarlar. Eşik, piyasanın kendi tipik hareketinin katları cinsinden ölçülür: piyasa hareketlendiğinde genişler, sakinleştiğinde daralır. Aynı ayar; majör paritelerde, altında, endekslerde ve kripto paralarda, ayrıca farklı zaman dilimlerinde mantıklı davranır.
  • İşaretçi, ancak dönüş onaylandıktan sonra görünür. Fiyatın uç noktadan eşik kadar gerçekten uzaklaşması gerekir. Geleceğe bakma yoktur ve mum hâlâ oluşurken tepe tahmin edilmez.
  • Onay gecikmesi açık ve öngörülebilirdir. Gecikmeyi seçtiğiniz eşik belirler: daha yüksek eşik, daha az ama daha önemli dalgalar ve daha geç onay demektir; daha düşük eşik, daha sık ve daha hızlı işaretçiler demektir.
  • Mantık her zaman diliminde aynıdır, böylece panel birbiriyle karşılaştırılabilir şeyleri karşılaştırır.

Başlıca avantajlar

  • Temiz, okunaklı işaretçiler: her onaylanmış salınım tepesinde aşağı ok, her salınım dibinde yukarı ok
  • Sabit bir sayı yerine volatiliteye uyum sağlayan eşik
  • Son işaretçilerden geçen otomatik trend çizgileri, isteğe bağlı ışınlarla
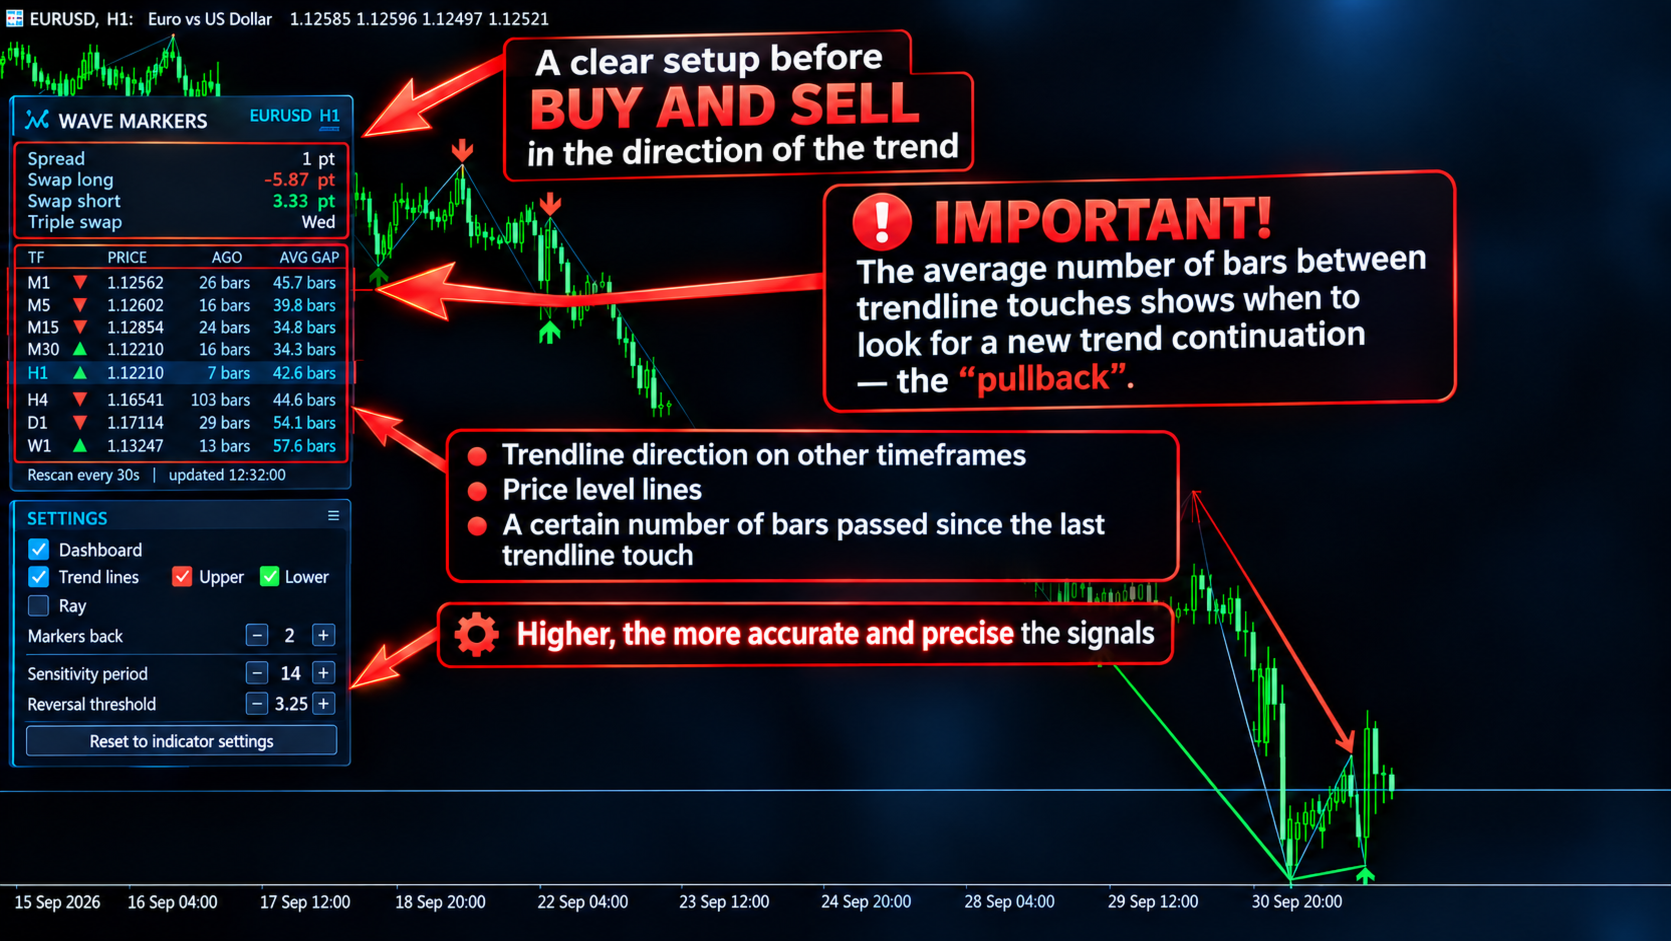
  • M1'den W1'e tüm zaman dilimleri için panel: son işaretçinin yönü, fiyatı, kaç mum önce göründüğü ve aynı yöndeki işaretçiler arasındaki ortalama aralık
  • Aynı panelde anlık spread ve swap (long, short ve üçlü swap günü)
  • Diğer zaman dilimlerinde eksik geçmiş otomatik olarak istenir ve yüklenir
  • Terminale hafif: grafikteki işaretçiler her yeni mumda bir kez yeniden hesaplanır, diğer zaman dilimleri her tikte değil zamanlayıcıyla kontrol edilir
  • Ayarlar penceresini açmadan her şeyi doğrudan grafikten kontrol edebilirsiniz
  • Her yeni işaretçide açılır pencere, push ve e-posta bildirimleri
  • Her enstrümanda ve her zaman diliminde çalışır

Grafikte neler görürsünüz?

İşaretçiler ve dalga çizgisi. Onaylanmış salınım tepelerinde ve diplerinde oklar görünür. İsterseniz ince bir çizgiyle birleştirilerek dalgalar tek bakışta okunur.

Trend çizgileri. Gösterge, son salınım tepelerinden ve ayrı olarak son salınım diplerinden geçen çizgiler çizer. Kaç parça çizileceğini siz seçersiniz: 1 ise o türün son iki işaretçisinden geçen tek çizgi; 2 ise son üç işaretçinin iki çizgiyle birleştirilmesi, ve böyle devam eder. Çizgiler sağa doğru ışın olarak uzatılabilir ya da mumun en yüksek veya en düşük noktasında tam olarak başlayıp biten parçalar olarak bırakılabilir.

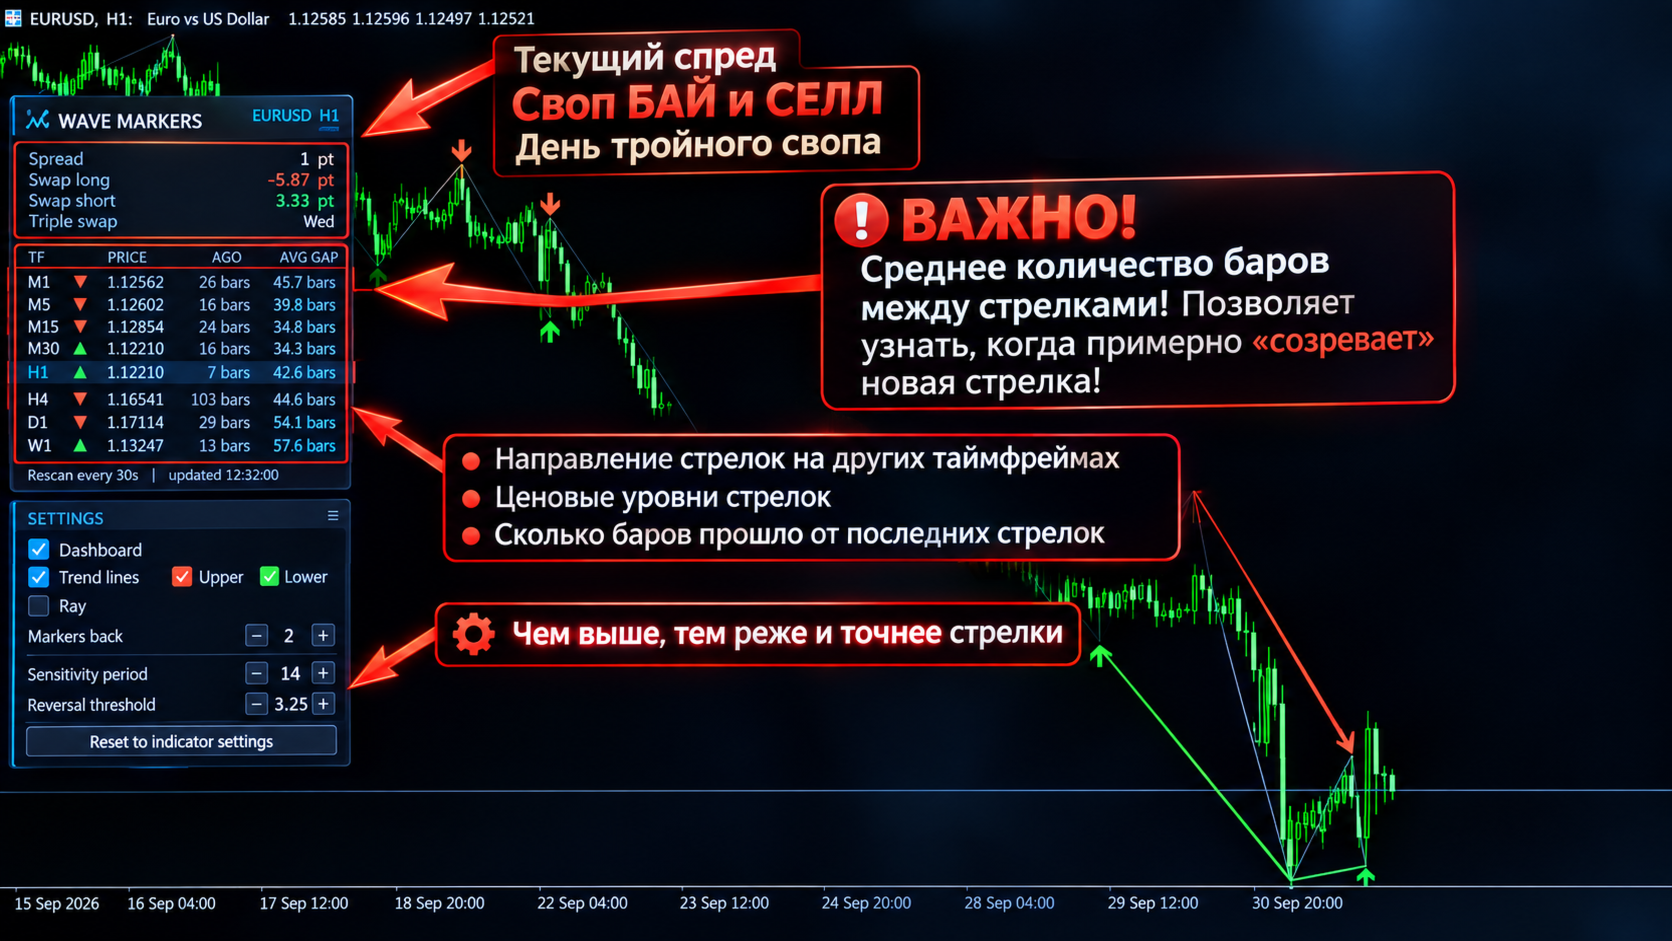
Çoklu zaman dilimi paneli. M1'den W1'e her zaman dilimi için bir satır:

  • son işaretçinin yönü (▼ tepe, ▲ dip)
  • fiyatı
  • kaç mum önce göründüğü
  • analiz edilen tüm geçmişte bu yöndeki işaretçiler arasındaki ortalama mum sayısı

"Ne kadar önce" ile "genelde ne sıklıkla" değerlerini karşılaştırmak, bir zaman diliminin ritminin hangi aşamasında olduğunu hızla sezmenizi sağlar.

Spread ve swap. Güncel spread her tikte güncellenir ve belirlediğiniz seviyeyi aştığında vurgulanabilir. Long swap, short swap ve üçlü swap günü, enstrümana uygun birimlerle gösterilir.

Grafik üzerindeki kontrol paneli

Ana panelin altında kompakt bir ayar kartı bulunur. Bununla şunları yapabilirsiniz:

  • ana paneli gizleyip göstererek onun kapattığı grafik bölümünü görmek
  • trend çizgilerini açıp kapatmak; üstteki ve alttaki çizgileri ayrı ayrı yönetmek
  • ışınları açıp kapatmak
  • "−" ve "+" düğmeleriyle çizgi sayısını değiştirmek
  • "−" ve "+" düğmeleriyle duyarlılık periyodunu ve dönüş eşiğini değiştirip sonucu anında görmek
  • tek tıkla her şeyi gösterge ayarlarındaki değerlere döndürmek
  • tüm paneli başlık çubuğundan tutup grafikte istediğiniz yere sürüklemek

Ayarlar penceresindeki değerler başlangıç noktasıdır. Bundan sonra grafikte yaptığınız seçimler geçerli olur. Zaman dilimini değiştirmek seçimlerinizi korur, sıfırlama düğmesi ise özgün değerleri geri getirir.

Trader'lar nasıl kullanabilir?

  • Piyasa yapısını okumak: yükselen ve alçalan tepeler ve dipler, yapının bozulduğu yerler
  • Önemli salınım seviyelerini ve trend çizgilerini elle çizmek yerine otomatik elde etmek
  • Karar vermeden önce birkaç zaman dilimine tek bakışta göz atmak
  • İşaretçilerin ritmini zaman dilimleri arasında karşılaştırmak
  • Grafikten ayrılmadan spread ve swap maliyetini takip etmek

Wave Markers bir analiz aracıdır. Hiçbir işlem sonucunu garanti etmez ve her karar size aittir. Herhangi bir ayarı önce demo hesapta test edin.

Bilmeniz gerekenler

  • İşaretçi, ancak fiyat dönüş yaptıktan sonra onaylandığı için her zaman gecikmeyle görünür. Bu tasarım gereğidir ve gecikmenin büyüklüğünü dönüş eşiği belirler.
  • Diğer zaman dilimleri brokerınızın geçmişinden yüklenir. Bir zaman dilimi "loading..." gösteriyorsa terminal o dilimin mumlarını hâlâ oluşturuyor demektir.
  • E-posta bildirimleri için terminalde e-postanın kurulmuş olması gerekir (Araçlar → Seçenekler → E-posta).

Ayarlar

Wave Markers

  • Wave markers: sensitivity period: Piyasanın tipik hareketinin kaç mumla ölçüleceği. Kısa değerler volatilite değişimlerine daha hızlı tepki verir, uzun değerler daha kararlıdır. 14, iyi bir başlangıç noktasıdır.
  • Wave markers: reversal threshold, x sensitivity: Bir işaretçinin onaylanması için fiyatın bir uç noktadan, tipik hareketin kaç katı kadar uzaklaşması gerektiği. Yüksek değer, daha az ama daha önemli dalgalar ve daha geç onay demektir; düşük değer, daha fazla ve daha erken işaretçi, ama daha fazla gürültü demektir.
  • Analysis depth, bars (per timeframe): Göstergenin her zaman diliminde kaç mum geriye gidip analiz yapacağı. Derinlik arttıkça grafikte ve panel istatistiklerinde daha fazla geçmiş olur.

Chart Display

  • Show wave markers on chart: Okları açar veya kapatır.
  • Connect wave markers with a line: Ardışık işaretçileri ince bir çizgiyle birleştirir, böylece dalgaları izlemek kolaylaşır.
  • Swing high marker color: Salınım tepelerindeki okların rengi.
  • Swing low marker color: Salınım diplerindeki okların rengi.
  • Connecting line color: İşaretçileri birleştiren çizginin rengi.
  • Marker size (1-5): Okların boyutu.
  • Connecting line width (1-5): İşaretçileri birleştiren çizginin kalınlığı.

Dashboard

  • Show info panel on chart: Paneli ve grafikteki kontrol kartını gösterir. Kapatılırsa gösterge yalnızca bu ayarlar penceresindeki değerlerle çalışır.
  • Panel offset X, px: Panelin yatay başlangıç konumu. Sonrasında fareyle sürükleyebilirsiniz.
  • Panel offset Y, px: Panelin dikey başlangıç konumu.
  • Other timeframes re-check interval, sec: Diğer zaman dilimlerinin ne sıklıkla yeniden kontrol edileceği. Güncel grafik her yeni mumda güncellenir; bu parametre yalnızca tabloyu etkiler (en az 5 saniye).
  • Spread highlight level, points (0 = off): Spread değeri bu seviyeyi aştığında turuncuya döner. 0 vurgulamayı kapatır.

Alerts (current timeframe)

  • Popup alert on new wave marker: Yeni bir işaretçi onaylandığında terminalde uyarı penceresi gösterir.
  • Push notification on new wave marker: Telefonunuza bildirim gönderir (terminal ayarlarında MetaQuotes ID gerektirir).
  • E-mail notification on new wave marker: E-posta gönderir (terminalde e-posta kurulumu gerektirir).

Trend Lines (through wave markers)

  • Draw trend lines through wave markers: Tüm trend çizgileri için ana anahtar.
  • Lines through upper markers (highs): Salınım tepelerinden geçen çizgiler çizer.
  • Lines through lower markers (lows): Salınım diplerinden geçen çizgiler çizer.
  • Number of lines per side (markers back, 1-50): Her yön için kaç parça çizileceği. 1 ise son iki işaretçiden geçen tek çizgi; 2 ise son üç işaretçinin iki çizgiyle birleştirilmesi, ve böyle devam eder.
  • Extend all lines to the right (ray): Her çizgiyi sağa, grafiğin kenarına kadar uzatır. Kapalıysa her çizgi kendi işaretçilerinde başlar ve biter.
  • Upper line color: Salınım tepelerinden geçen çizgilerin rengi.
  • Lower line color: Salınım diplerinden geçen çizgilerin rengi.
  • Line style: Düz, kesikli, noktalı vb.
  • Line width (1-5, solid style only): Çizgilerin kalınlığı. MetaTrader, 1'den büyük kalınlıkları yalnızca düz çizgilere uygular.
  • Draw lines behind the chart: Çizgileri mumların üstüne değil, altına çizer.
Yazarın diğer ürünleri
Gösterge, en olası trend durdurma/geri dönüş alanlarını, kendinden emin trend hareket alanlarını hesaplar. Hesaplama şunları dikkate alır: fiyat değişim oranı; grafiğin göreli sapma açısı; fiyat hareketlerinin ortalama genliği; "konfor bölgesini" terk eden fiyat; ATR göstergesinin değerleri. Gösterge, fiyat bir durdurma/geri dönüş alanına girdiğinde bir Uyarı oluşturabilir. Ayarlar Tüm uzunluğu çiz? - grafiğin sonuna kadar alanları çizin; YUKARI trendi durdur - bir yükseliş trendinin durma/ge
Indicator for determining flat and trend. If the price is below any of the two histograms and two lines (red and blue), this is a sell zone. When purchasing this version of the indicator, MT5 version for one real and one demo account - as a gift (to receive, write me a private message)! If the price is above any of the two histograms and two lines (red and blue), this is a buy zone. MT5 version:  https://www.mql5.com/en/market/product/70409 If the price is between two lines or in the zone of
SuperTrend
Evgeniy Zhdan
2.5 (2)
The Supertrend Expert Advisor The Supertrend Expert Advisor with averaging elements. It has been developed during three months until I finally got good results. It is not a scalper. The minimum balance to start trading - 100 $. Is automatically adjusted to the 4 and 5-digit prices. Has an efficient risk management system. The lot and limit on the maximum lot is automatically calculated based on the settings specified in the EA. As a result, you have a complete automated trading system. Download
Stardust
Evgeniy Zhdan
StarDust searches for divergences in the values of several indicators considering them as signs of flat and enters the market if a relatively steady trend is detected. The Expert Advisor trades "basic" symbols with a low spread. The best results are achieved on М15. The EA automatically adjusts to 4 and 5-digit quote flows. Settings Comment_to_orders – comment to a placed order. The field can be left blank if no comment is required. MM – enable money management with automatic setting of a worki
Top Floor
Evgeniy Zhdan
The EA catches the price when it moves against the trend in an effort to open an order in an opposite direction (direction of the main trend). Screenshots illustrate examples of entries and the strategy gist. The EA uses stop losses depending on values of ATR. Settings: Lot_ - if Risk_ = 0, the EA will trade this lot; Risk_ - risk per one trade. Stop loss is taken into account; koeff_ATR - coefficient multiplied by the ATR value to calculate stop loss (the bigger the value, the bigger stop loss
FastBoom
Evgeniy Zhdan
The FastBoom EA finds the most probable points of price pullback/reverse and places an order. It places averaging orders if the price moves further against take profit. Settings of the EA: Lots - initial lot; LotExponent - multiplier for following orders (Martingale). 1 - no multiplier. TakeProfit - take profit in points; Stochastic Settings InpKPeriod - K Period of Stochastic InpDPeriod - D Period of Stochastic InpSlowing - Stochastic Slowing LevHigh - level for sell positions of Stochastic L
The Expert Advisor calculates the double/triple divergence of volumes, and starts trading. It uses a unique formula of lot calculation, which greatly improves stability of trading. Recommended TF - 1h. Currency pair - EURUSD , but the EA can be used on any trading instruments which are not subject to high volatility. Settings mode - trading direction can be set manually; close - order close level (details on the screenshot); Step between orders - step between orders in points; Maximum orders -
OrderOnLine
Evgeniy Zhdan
The Expert Advisor opens orders from the horizontal line, the a trader can set on any level by dragging using the mouse or by changing the line properties. For example, when a horizontal line is above the current price, the EA will open a Buy order once the horizontal line is reached. And vice versa: If the line is below the current price, the EA will open a sell order once the line is crossed. A buy crossover of the line is: opening of the current candlestick below the horizontal line; the curr
SellerATR
Evgeniy Zhdan
5 (1)
The Expert Advisor only sells. Recommended currency pairs : EURUSD; GBPUSD; USDCHF; USDJPY; USDCAD; AUDUSD; EURGBP; EURAUD; EURCHF; EURJPY; GBPCHF; CADJPY; GBPJPY; AUDNZD; AUDCAD; AUDCHF; AUDJPY; CHFJPY; EURNZD; EURCAD; CADCHF; NZDJPY; NZDUSD. Timeframe: H1. Percent% manages closing both loss-making and profitable deals based on the account overall status. Using the EA on 23 symbols mentioned above allows the robot to cope with the drawdown in case of a long trend. While positions on some pairs
Illusion
Evgeniy Zhdan
3 (2)
The Illusion EA uses the probability theory - after a series of consecutive virtual losses - i.e. right during a flat the EA already starts trading in the trend. In addition, the EA considers the ratio of bullish/bearish candles on the higher timeframes to determine the greatest probability of the price movement direction. Only 1 order can be opened at a time. In case of a loss the following order will be placed with an increased lot (the multiplication coefficient is set in the parameters). The
The indicator plots a trend line and determines the levels for opening trades, in case the price goes "too far" away from the trend level. More detailed information is available in the screenshots. Settings Away from the trend line - distance from the trend line to the trades level; Arrow Signal for deals - enable displaying an arrow when the price reaches the trades level; Size of Arrow - size of the arrow; Alert Signal for deals - enable generating alerts when the price reaches the trades lev
Turbina
Evgeniy Zhdan
5 (4)
The axiom of the Forex market is that any trend will be broken. The Expert Advisor determines trend direction (the pink line), and calculates levels for opening opposite orders depending on the settings. The value of Away from the trend line for Deal will be different for each pair and timeframe, depending on the volatility of the trading instrument. Next orders can be opened with an increased lot (a static lot is used by default). See the screenshots to understand the idea of the Expert Advisor
Odysseus
Evgeniy Zhdan
The Expert Advisor determines the moments of strong movements and opens a position in the direction of the most probable price movement. The strategy always uses stop loss and take profit. Several independent orders can be in the market (the maximum number is set in parameters). The goal of the EA's underlying trading system is the quantitative excess of the number of profitable deals over the number of losing ones. Recommended: EURUSD 5m; GBPUSD 5m; USDJPY 5m. The Expert Advisor is able to work
Vise
Evgeniy Zhdan
Vise is a trend indicator. The upper and lower lines follow the price showing the prevailing price direction. Frequent breakthroughs of the upper line indicate a bullish trend, while frequent breakthroughs of the lower line indicate a bearish one. Parameters Points for UpLine - initial number of points for the upper line; Points for DownLine - initial number of points for the lower line. During the breakthrough of the upper level (line), this level shifts upwards by Points for UpLine. If the up
Twinkle
Evgeniy Zhdan
Twinkle is a trend-based scalper using stop loss and take profit invisible to the broker. The EA does not look for trend reversals. The EA catches strong market movements and opens orders in the direction of the trend. Your broker will not see the order closing levels. The EA closes orders independently when reaching the take profit or stop loss levels specified in the settings. Recommended trading symbols: EURUSD M5, GBPUSD M5. ECN accounts with 5 digits quotes are recommended. Expert Advisor
Shine
Evgeniy Zhdan
4.75 (4)
This Expert Advisor implements elements of the Martingale system. Orders are opened at a specified distance from the moving average. The Parabolic SAR indicator and certain technical details are used to ensure the most accurate entries. The EA is highly customizable. It is recommended for simultaneous use on 4 currency pairs: EURUSD M15; GBPUSD M15; USDJPY M15; USDCAD M15. Despite good stability, it is advisable to disable the EA operation during the days rich in news releases. Configurations P
LuckyCase
Evgeniy Zhdan
LuckyCase is an Expert Advisor with martingale elements. The EA strategy is based on a significant "deviation" of the price from SAR inadicator and the Bands levels breakthrough point. The money management system is an essential part of the EA. It starts working after a trade is opened. Trades are closed after accumulating specified points of market orders, by deposit % or after an opposite side of the channel is broken through. The default EA settings are meant for: EURUSD M15; USDJPY M15. The
Elize
Evgeniy Zhdan
The Elize Expert Advisor has been designed to work with the EURCHF currency pair. It considers the peculiarities of this trading instrument, its behavior and dependence on the behavior of other currencies. In particular, when the currencies of the European countries (EURUSD, GBPUSD, EURNOK, EURCHF) move in the same direction, the EA starts its operation and opens a deal in the trend direction of the European currencies. In the event of price rollbacks, the EA uses a unique method for making the
AllTrendLines
Evgeniy Zhdan
4 (1)
Brief Description of the All Trend Lines Indicator The indicator analyzes the wave structure of the market. What it displays on the chart: First. Wave pivots (semaphores) • Red markers – wave highs • Yellow markers – wave lows • Yellow-green markers – additional local extremes Second. Trend lines • Purple/blue lines – trends based on highs (resistance/support) • Beige/green lines – trends based on lows • Lines are built automatically by connecting wave pivots of the same type Third. Main trend
FastTraffic
Evgeniy Zhdan
The Expert Advisor has been specifically developed for trading gold (Spot Gold). The strategy is based on Fibo levels calculated from the previous (first) candle High/Low and the width of the current and lower timeframes channel. If important Fibo levels of different orders are located in a single price channel (within a spread), the EA defines this channel as the target for price movement and starts operation. Martingale and averaging are not used. Each order is independent and is accompanied b
Jazz
Evgeniy Zhdan
The algorithm of this Expert Advisor determines the significant price levels, where the trend often turns into a flat or reverses. Stochastic Oscillator serves as an additional filter of overbought/oversold zones. The EA sets stop loss and take profit after opening an order. The underlying trailing strategy applies a trailing stop. The EA is recommended for simultaneously use on three trading instruments: EURUSD M5, GBPUSD M5, EURCHF M5. Settings: Comment to order - comment to orders. MaxRisk -
Panther
Evgeniy Zhdan
The Expert Advisor looks for technical analysis patterns formed on the higher (hourly) timeframe to start working on the 5-minute chart. Technical analysis patterns used: double top/double bottom, head/shoulders, flag, expanding/narrowing triangles. The Relative Vigor Index technical indicator is used as the filter for opening deals. It is based on the idea that on the bull market the closing price is, as a rule, higher, than the opening price. It is the other way round on the bear market. This
Spook
Evgeniy Zhdan
The Expert Advisor calculates the divergence on the current and higher timeframes. In case the divergences coincide, the EA starts its operation. Deals have strict take profit and stop loss levels. Each deal is managed by trailing stop. The strategy involves the use of a tight stop-loss. Therefore, losing deals and/or series of losing deals are not uncommon. This EA is not suitable for those who have difficulties coping with losing deals. The EA is recommended for simultaneous use on the followi
Grand
Evgeniy Zhdan
The Expert Advisor has been developed specifically for the features of the CHFJPY currency pair. The EA's algorithm determines the direction of the current trend and starts operation. In case of a price reversal within the current trend, the EA adds additional orders. If trend changes, the EA starts to work in the direction contrary to the initial grid of orders. If there were no conditions for closing orders and the trend direction changed again, the EA continues to work with the "first" grid o
Intensive
Evgeniy Zhdan
The Expert Advisor algorithm determines on daily charts those candlestick patterns, which set the intraday trading direction. The trading EA determines how long the price is moving in overbought/oversold zones and starts working in the direction of the expected trend movement. Each position is accompanied with a tight stop loss and take profit. Only one active position can be open in the market. The EA was developed and tested using 99% quality quotes. The Expert Advisor has a built-in news filt
Slender
Evgeniy Zhdan
The strategy of this Expert Advisor is based on a hedging system, which implies placing opposite orders. The EA algorithm determines trend beginning and opens a position in the trend direction. In case of a wrong entry, the EA tries to neutralize the drawdown through opposite (hedging) orders at a preset interval (Coefficient of counter orders). Orders are closed when one of the two values ​​is reached - profit in percent or profit in points. The EA does not use lot increase. The EA wast tested
Dreamer
Evgeniy Zhdan
Советник работает по принципу хеджирования с периодическими "перекосами" в сторону трендовых направлений. Направления тренда советник определяет на основании стандартного индикатора Parabolic Stop and Reverse system (SAR). Уникальная стратегия установки балансирующих позиций позволяет избегать больших просадок даже при самых не благоприятных рыночных условиях. Параметры по умолчанию рекомендуется использовать на торговом инструменте: GBPJPY 15m. Разработка и оптимизация параметров производились
Snoot
Evgeniy Zhdan
5 (1)
This Expert Advisor works using a grid in the direction of a trend movement with the step between opened positions defined in the settings. The positions are closed by the total take profit. The Parabolic SAR standard indicator is used to filter order opening, which comes in the MetaTrader 4 package. The EA has been developed and tested using 99,9% quality of quotes. Operation of the EA in real time can be viewed in the signals . The best trading results have been achieved on CHFJPY M15. Settin
Solipsism
Evgeniy Zhdan
The Expert Advisor builds channels based on the data obtained using ATR and MA indicators according to the equations: Upper channel border = MA + ATR * (FIBO); Lower channel border = MA - ATR * (FIBO), where FIBO has the following values: Style of Trade - Aggressive = 1.61852; Style of Trade - Average = 3.26704; Style of Trade - Calm = 4.85556. Trades are opened inside the channel with the intervals defined in the settings. Long and short positions are opened independently. Positions are closed
The trading statistics indicator notifies the trader of the aggregate income of the trading account for different time intervals. The indicator has wide display settings on the graph. There is a choice of one of the two display languages on the chart- English and Russian. Settings Indicator language (ENG, RUS) - Select the language to display on the chart; To control the magic (-1: any magic) - Entering the Magic for control (-1: any Magic); Angle of indicator tie - Selecting the angle of the c
Filtrele:
Değerlendirme yok
Değerlendirmeye yanıt