WaveMarkers MT4

Wave Markers : carte des vagues adaptative avec tableau de bord multi-unités de temps

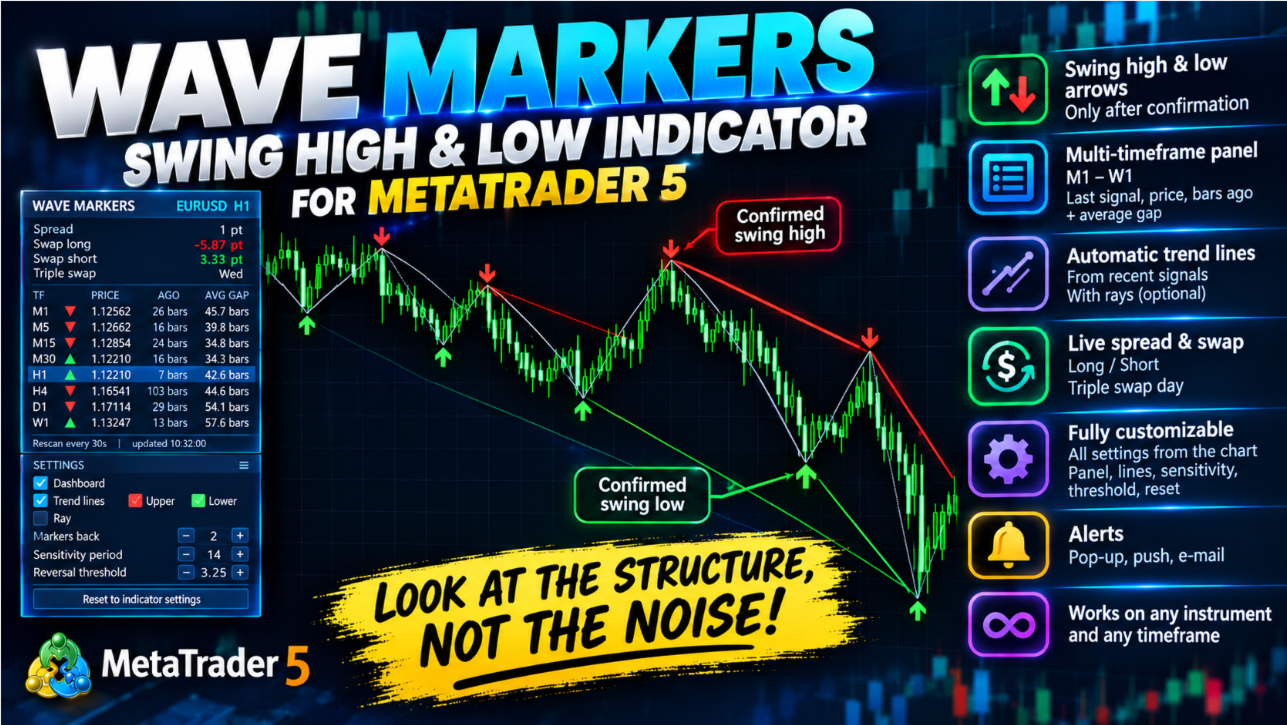
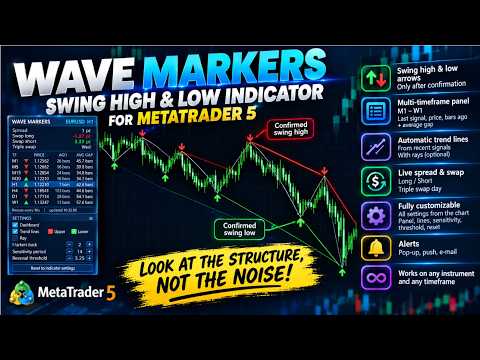
Voyez la vraie structure du marché, et non le bruit : plus hauts et plus bas de swing confirmés, lignes de tendance qui passent par eux, et la situation de toutes les unités de temps, de M1 à W1, dans un seul panneau.

De quoi s'agit-il ?

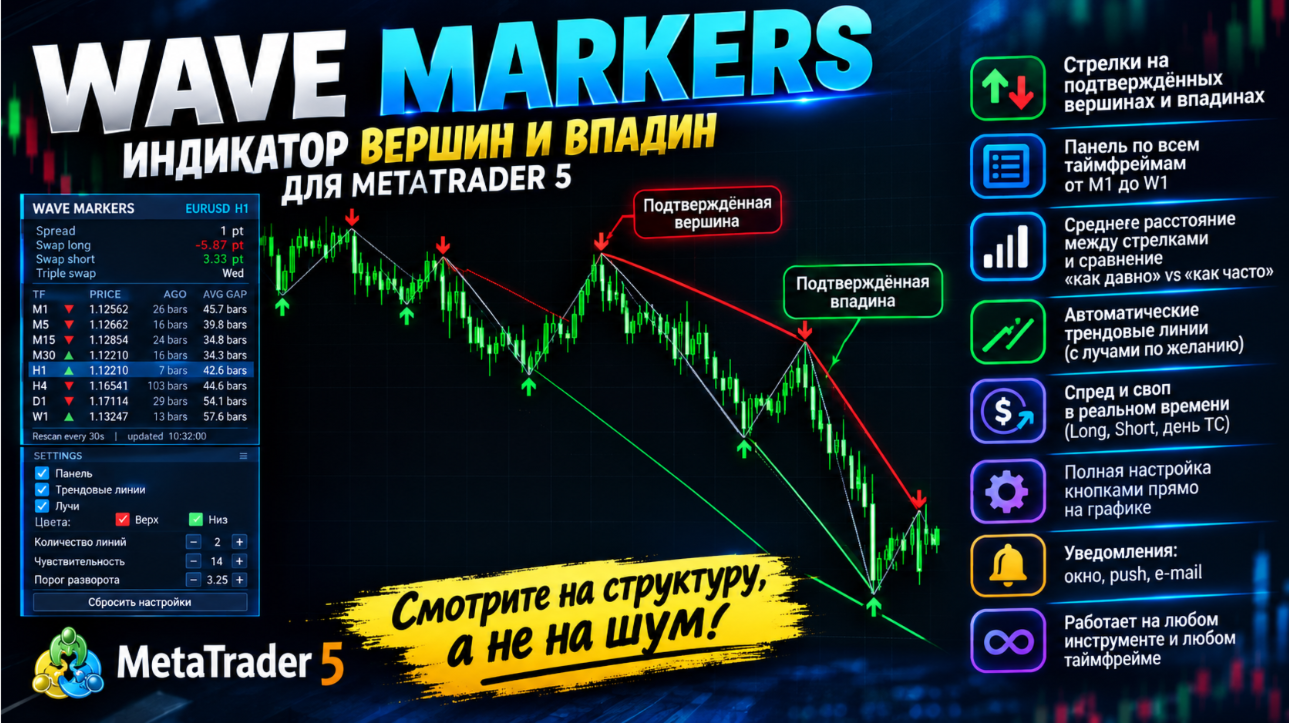
Wave Markers est un indicateur de structure graphique pour MetaTrader 5. Il repère les points de retournement du prix (plus hauts et plus bas de swing), les marque par des flèches nettes et construit autour d'eux des outils de travail : lignes de tendance, tableau de toutes les unités de temps, ainsi que le spread et le swap en temps réel.

Il ne donne aucun ordre d'« achat » ou de « vente » et ne promet aucun résultat. Il fait une seule chose, et il la fait avec soin : vous montrer où le marché s'est réellement retourné, afin que vous lisiez la structure plus vite et de façon plus cohérente.

Pourquoi ce n'est pas un ZigZag de plus

Un ZigZag classique utilise une distance fixe (points ou pourcentage) pour décider de ce qui compte comme un retournement. Ce chiffre unique est presque toujours inadapté : trop grand sur un marché calme (on manque de vraies vagues), trop petit sur un marché rapide (on récolte du bruit).

Wave Markers fonctionne autrement :

  • Le seuil de retournement s'adapte à la volatilité actuelle. Il se mesure en multiples du mouvement typique du marché lui-même : il s'élargit quand le marché s'emballe et se resserre quand il se calme. Un même réglage se comporte de façon sensée sur les paires majeures, l'or, les indices et les cryptomonnaies, ainsi que sur différentes unités de temps.
  • Un marqueur n'apparaît qu'une fois le retournement confirmé. Le prix doit réellement s'éloigner de l'extrême de la valeur du seuil. Il n'y a ni anticipation du futur, ni devinette d'un sommet pendant que la bougie est encore en cours.
  • Le délai de confirmation est honnête et prévisible. Il est défini par le seuil que vous choisissez : un seuil plus élevé donne moins de vagues, plus importantes et confirmées plus tard ; un seuil plus bas donne des marqueurs plus fréquents et plus rapides.
  • La logique est identique sur chaque unité de temps, de sorte que le tableau de bord compare des choses comparables.

Principaux atouts

  • Des marqueurs nets et lisibles : une flèche vers le bas sur chaque plus haut de swing confirmé, une flèche vers le haut sur chaque plus bas
  • Un seuil adaptatif à la volatilité plutôt qu'un chiffre fixe
  • Des lignes de tendance automatiques par les derniers marqueurs, avec demi-droites en option
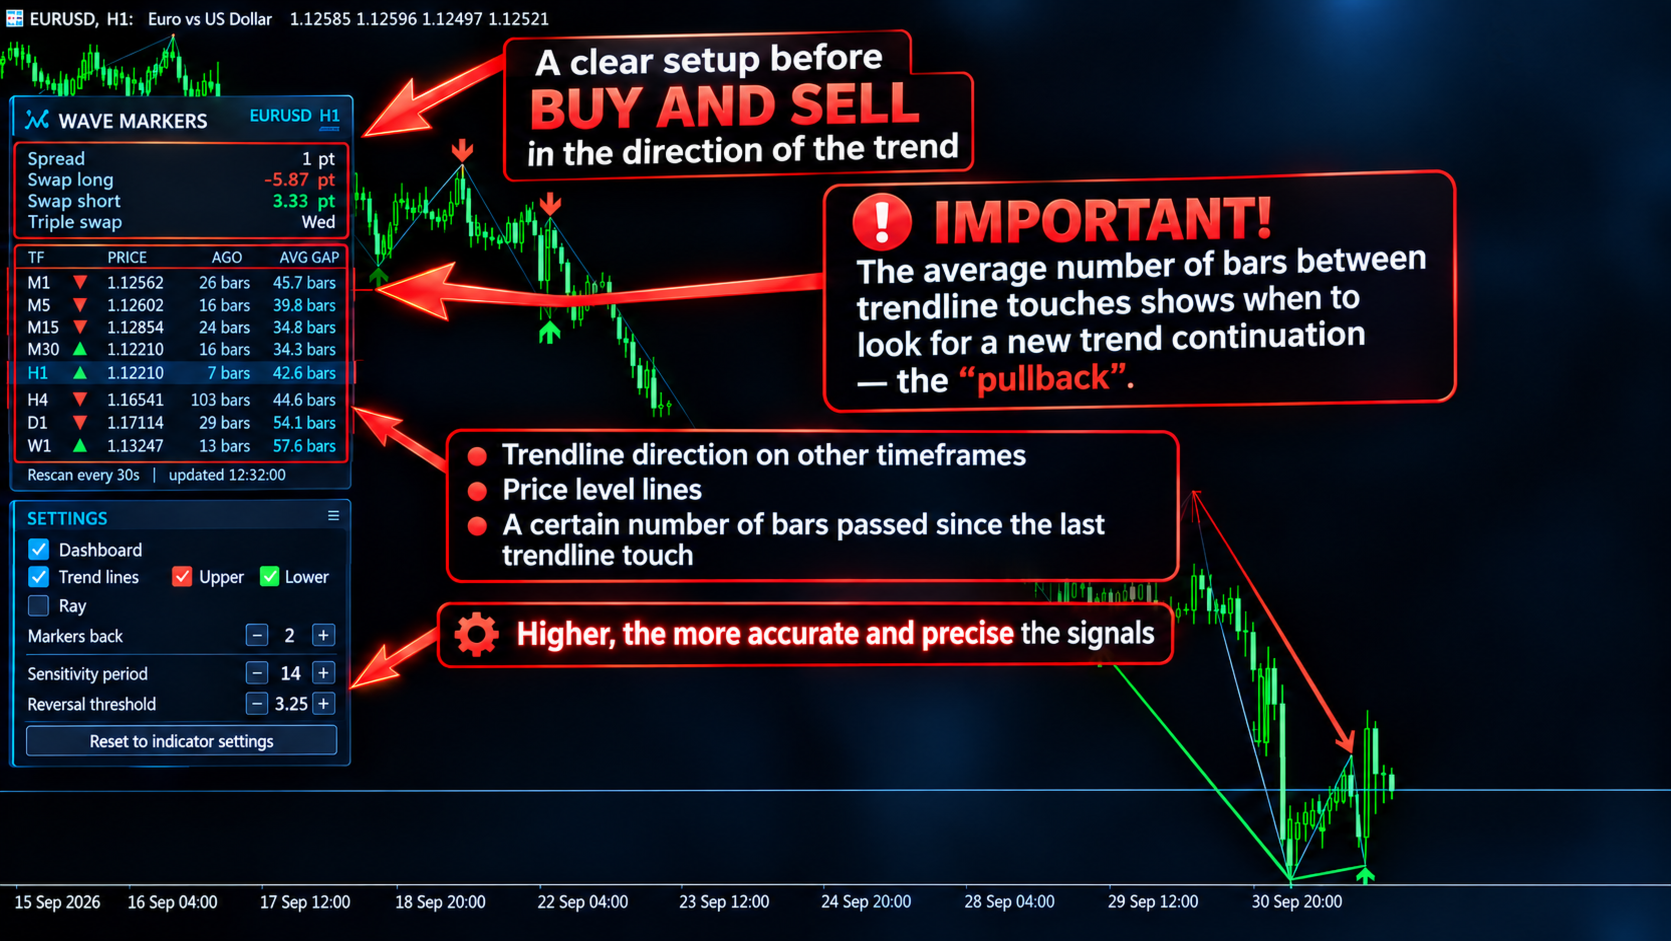
  • Un tableau de bord pour toutes les unités de temps de M1 à W1 : direction du dernier marqueur, son prix, il y a combien de bougies il est apparu, et l'écart moyen entre les marqueurs de même direction
  • Le spread et le swap (long, court et jour du triple swap) en temps réel dans le même panneau
  • L'historique manquant sur les autres unités de temps est demandé et chargé automatiquement
  • Léger pour le terminal : les marqueurs du graphique sont recalculés une fois par nouvelle bougie, et les autres unités de temps par minuterie, et non à chaque tick
  • Tout se pilote directement sur le graphique, sans ouvrir la fenêtre des paramètres
  • Alertes par fenêtre contextuelle, notifications push et e-mail à chaque nouveau marqueur
  • Fonctionne sur tout instrument et sur toute unité de temps

Ce que vous voyez sur le graphique

Marqueurs et ligne de vagues. Des flèches sur les plus hauts et plus bas de swing confirmés, éventuellement reliées par un trait fin pour que les vagues se lisent d'un coup d'œil.

Lignes de tendance. L'indicateur trace des lignes par les derniers plus hauts de swing et, séparément, par les derniers plus bas. Vous choisissez le nombre de segments à dessiner : avec 1, une ligne par les deux derniers marqueurs de ce type ; avec 2, les trois derniers marqueurs reliés par deux lignes, et ainsi de suite. Les lignes peuvent être prolongées vers la droite sous forme de demi-droites, ou rester des segments qui commencent et se terminent exactement sur le plus haut ou le plus bas de la bougie.

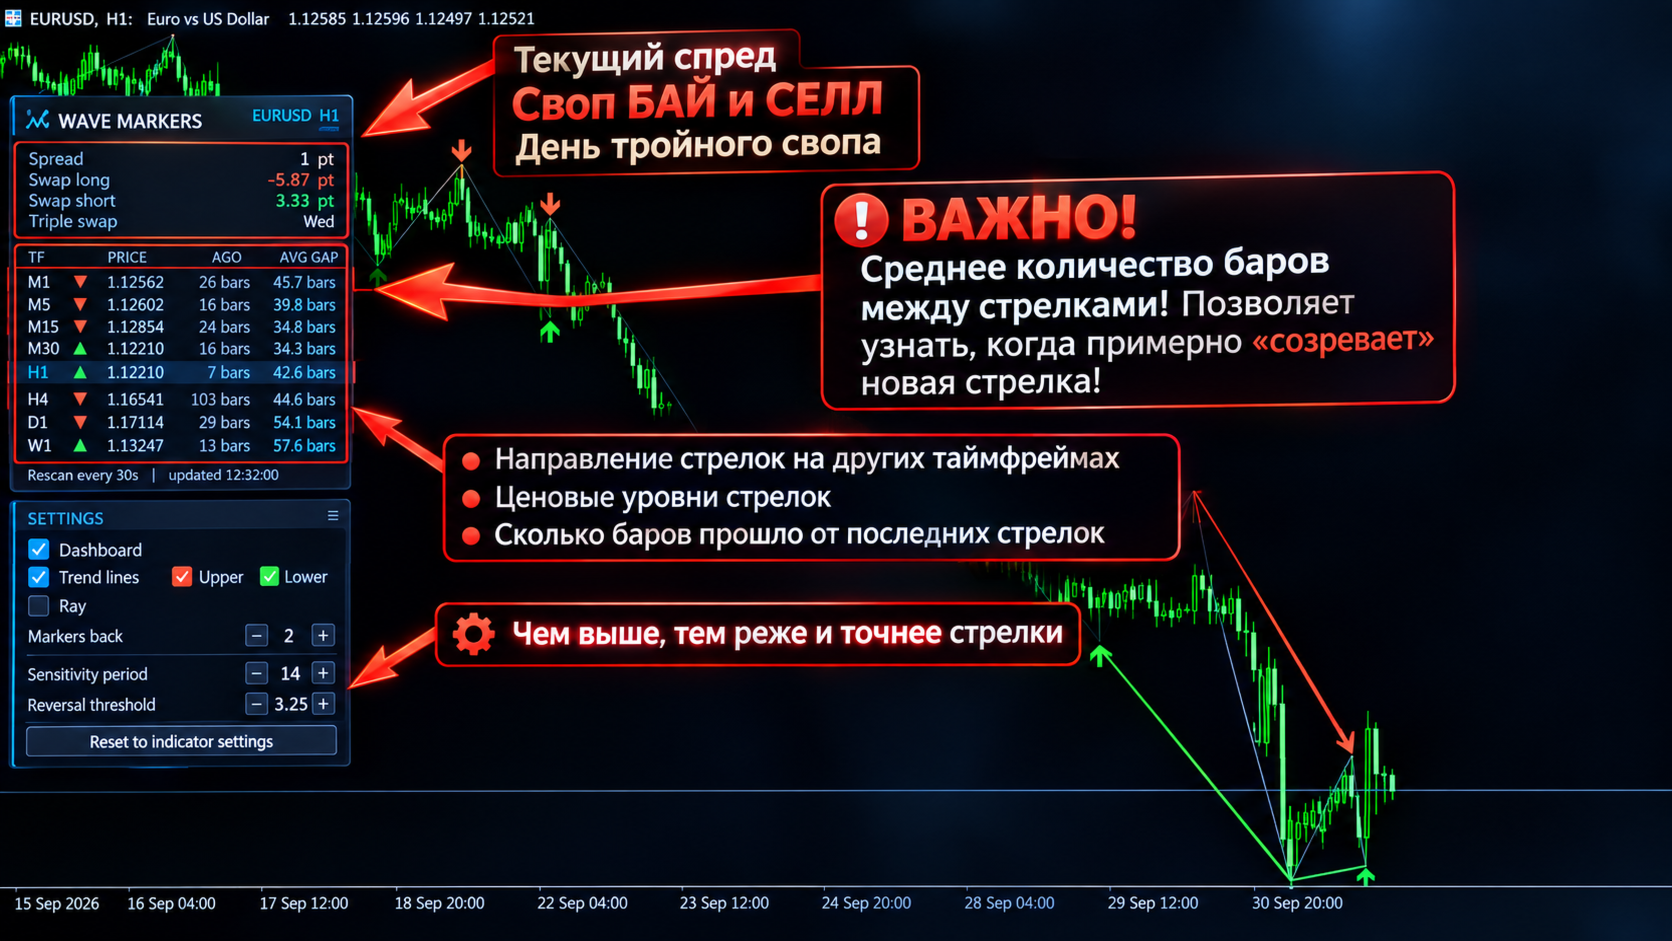
Tableau de bord multi-unités de temps. Une ligne par unité de temps, de M1 à W1 :

  • la direction du dernier marqueur (▼ plus haut, ▲ plus bas)
  • son prix
  • il y a combien de bougies il est apparu
  • le nombre moyen de bougies entre les marqueurs de cette direction sur tout l'historique analysé

Comparer « il y a combien de temps » avec « à quelle fréquence cela arrive d'habitude » permet de sentir rapidement à quel stade de son rythme se trouve une unité de temps.

Spread et swap. Le spread actuel se met à jour à chaque tick et peut être mis en évidence lorsqu'il dépasse le niveau que vous avez défini. Le swap long, le swap court et le jour du triple swap s'affichent avec les unités adaptées à l'instrument.

Panneau de commande sur le graphique

Sous le panneau principal se trouve une carte de réglages compacte. Elle vous permet de :

  • masquer ou afficher le panneau principal pour voir la partie du graphique qu'il recouvre
  • activer ou désactiver les lignes de tendance, séparément pour les supérieures et les inférieures
  • activer ou désactiver les demi-droites
  • modifier le nombre de lignes avec les boutons « − » et « + »
  • modifier la période de sensibilité et le seuil de retournement avec « − » et « + » et voir le résultat immédiatement
  • tout remettre aux valeurs de l'indicateur en un clic
  • faire glisser tout le panneau n'importe où sur le graphique par sa barre de titre

Les valeurs de la fenêtre des paramètres sont le point de départ. Ensuite, ce que vous choisissez sur le graphique prend le relais. Un changement d'unité de temps conserve vos choix, et le bouton de réinitialisation rétablit les valeurs d'origine.

Comment les traders peuvent l'utiliser

  • Lire la structure du marché : plus hauts et plus bas croissants ou décroissants, et les endroits où la structure se rompt
  • Obtenir automatiquement des niveaux de swing et des lignes de tendance pertinents au lieu de les tracer à la main
  • Évaluer plusieurs unités de temps d'un coup d'œil avant de prendre une décision
  • Comparer le rythme des marqueurs d'une unité de temps à l'autre
  • Surveiller le coût du spread et du swap sans quitter le graphique

Wave Markers est un outil d'analyse. Il ne garantit aucun résultat de trading, et chaque décision reste la vôtre. Testez toujours un réglage d'abord sur un compte démo.

Bon à savoir

  • Comme un marqueur n'est confirmé qu'après le retournement du prix, il apparaît toujours avec un délai. C'est voulu, et l'ampleur du délai se règle avec le seuil de retournement.
  • Les autres unités de temps sont chargées depuis l'historique de votre courtier. Si une unité de temps affiche « loading... », le terminal est encore en train de construire ses bougies.
  • Pour les alertes par e-mail, la messagerie doit être configurée dans le terminal (Outils → Options → E-mail).

Paramètres

Wave Markers

  • Wave markers: sensitivity period : sur combien de bougies on mesure le mouvement typique du marché. Les valeurs courtes réagissent plus vite aux variations de volatilité, les valeurs longues sont plus stables. 14 est un bon point de départ.
  • Wave markers: reversal threshold, x sensitivity : de combien le prix doit s'éloigner d'un extrême, en multiples du mouvement typique, pour qu'un marqueur soit confirmé. Plus élevé : moins de vagues, plus importantes et confirmées plus tard. Plus bas : plus de marqueurs, plus tôt, mais avec davantage de bruit.
  • Analysis depth, bars (per timeframe) : combien de bougies en arrière l'indicateur analyse sur chaque unité de temps. Plus la profondeur est grande, plus il y a d'historique sur le graphique et dans les statistiques du panneau.

Chart Display

  • Show wave markers on chart : active ou désactive les flèches.
  • Connect wave markers with a line : relie les marqueurs consécutifs par un trait fin pour que les vagues soient faciles à suivre.
  • Swing high marker color : couleur des flèches sur les plus hauts de swing.
  • Swing low marker color : couleur des flèches sur les plus bas de swing.
  • Connecting line color : couleur de la ligne qui relie les marqueurs.
  • Marker size (1-5) : taille des flèches.
  • Connecting line width (1-5) : épaisseur de la ligne qui relie les marqueurs.

Dashboard

  • Show info panel on chart : affiche le tableau de bord et la carte de commande sur le graphique. Si l'option est désactivée, l'indicateur ne fonctionne qu'avec les valeurs de cette fenêtre de paramètres.
  • Panel offset X, px : position horizontale initiale du panneau. Vous pourrez ensuite le déplacer à la souris.
  • Panel offset Y, px : position verticale initiale du panneau.
  • Other timeframes re-check interval, sec : à quelle fréquence les autres unités de temps sont revérifiées. Le graphique actuel se met à jour à chaque nouvelle bougie ; ce paramètre ne concerne que le tableau (minimum 5 secondes).
  • Spread highlight level, points (0 = off) : la valeur du spread devient orange lorsqu'elle dépasse ce niveau. 0 désactive la mise en évidence.

Alerts (current timeframe)

  • Popup alert on new wave marker : affiche une fenêtre d'alerte du terminal lorsqu'un nouveau marqueur est confirmé.
  • Push notification on new wave marker : envoie une notification sur votre téléphone (nécessite le MetaQuotes ID dans les paramètres du terminal).
  • E-mail notification on new wave marker : envoie un e-mail (nécessite la configuration de la messagerie dans le terminal).

Trend Lines (through wave markers)

  • Draw trend lines through wave markers : interrupteur général de toutes les lignes de tendance.
  • Lines through upper markers (highs) : trace des lignes par les plus hauts de swing.
  • Lines through lower markers (lows) : trace des lignes par les plus bas de swing.
  • Number of lines per side (markers back, 1-50) : combien de segments tracer de chaque côté. Avec 1, une ligne par les deux derniers marqueurs ; avec 2, les trois derniers marqueurs reliés par deux lignes, et ainsi de suite.
  • Extend all lines to the right (ray) : prolonge chaque ligne vers la droite jusqu'au bord du graphique. Si l'option est désactivée, chaque ligne commence et se termine sur ses marqueurs.
  • Upper line color : couleur des lignes passant par les plus hauts de swing.
  • Lower line color : couleur des lignes passant par les plus bas de swing.
  • Line style : continu, tirets, pointillés, etc.
  • Line width (1-5, solid style only) : épaisseur des lignes. MetaTrader n'applique les épaisseurs supérieures à 1 qu'aux lignes continues.
  • Draw lines behind the chart : dessine les lignes sous les bougies plutôt qu'au-dessus.
Plus de l'auteur
L'indicateur calcule les zones d'arrêt / d'inversion de tendance les plus probables, les zones de mouvement de tendance confiantes. Le calcul considère : le taux de variation des prix ; l'angle de déviation relative de la carte ; l'amplitude moyenne des mouvements de prix ; le prix sortant de sa « zone de confort » ; les valeurs de l'indicateur ATR. L'indicateur peut générer une alerte lorsque le prix entre dans une zone d'arrêt/d'inversion. Paramètres Dessiner toute la longueur ? - tracer l
Buy and sell zones
Evgeniy Zhdan
5 (2)
Indicator for determining flat and trend. If the price is below any of the two histograms and two lines (red and blue), this is a sell zone. When purchasing this version of the indicator, MT5 version for one real and one demo account - as a gift (to receive, write me a private message)! If the price is above any of the two histograms and two lines (red and blue), this is a buy zone. MT5 version:  https://www.mql5.com/en/market/product/70409 If the price is between two lines or in the zone of
SuperTrend
Evgeniy Zhdan
2.5 (2)
The Supertrend Expert Advisor The Supertrend Expert Advisor with averaging elements. It has been developed during three months until I finally got good results. It is not a scalper. The minimum balance to start trading - 100 $. Is automatically adjusted to the 4 and 5-digit prices. Has an efficient risk management system. The lot and limit on the maximum lot is automatically calculated based on the settings specified in the EA. As a result, you have a complete automated trading system. Download
Stardust
Evgeniy Zhdan
StarDust searches for divergences in the values of several indicators considering them as signs of flat and enters the market if a relatively steady trend is detected. The Expert Advisor trades "basic" symbols with a low spread. The best results are achieved on М15. The EA automatically adjusts to 4 and 5-digit quote flows. Settings Comment_to_orders – comment to a placed order. The field can be left blank if no comment is required. MM – enable money management with automatic setting of a worki
Top Floor
Evgeniy Zhdan
The EA catches the price when it moves against the trend in an effort to open an order in an opposite direction (direction of the main trend). Screenshots illustrate examples of entries and the strategy gist. The EA uses stop losses depending on values of ATR. Settings: Lot_ - if Risk_ = 0, the EA will trade this lot; Risk_ - risk per one trade. Stop loss is taken into account; koeff_ATR - coefficient multiplied by the ATR value to calculate stop loss (the bigger the value, the bigger stop loss
FastBoom
Evgeniy Zhdan
The FastBoom EA finds the most probable points of price pullback/reverse and places an order. It places averaging orders if the price moves further against take profit. Settings of the EA: Lots - initial lot; LotExponent - multiplier for following orders (Martingale). 1 - no multiplier. TakeProfit - take profit in points; Stochastic Settings InpKPeriod - K Period of Stochastic InpDPeriod - D Period of Stochastic InpSlowing - Stochastic Slowing LevHigh - level for sell positions of Stochastic L
The Expert Advisor calculates the double/triple divergence of volumes, and starts trading. It uses a unique formula of lot calculation, which greatly improves stability of trading. Recommended TF - 1h. Currency pair - EURUSD , but the EA can be used on any trading instruments which are not subject to high volatility. Settings mode - trading direction can be set manually; close - order close level (details on the screenshot); Step between orders - step between orders in points; Maximum orders -
OrderOnLine
Evgeniy Zhdan
The Expert Advisor opens orders from the horizontal line, the a trader can set on any level by dragging using the mouse or by changing the line properties. For example, when a horizontal line is above the current price, the EA will open a Buy order once the horizontal line is reached. And vice versa: If the line is below the current price, the EA will open a sell order once the line is crossed. A buy crossover of the line is: opening of the current candlestick below the horizontal line; the curr
SellerATR
Evgeniy Zhdan
5 (1)
The Expert Advisor only sells. Recommended currency pairs : EURUSD; GBPUSD; USDCHF; USDJPY; USDCAD; AUDUSD; EURGBP; EURAUD; EURCHF; EURJPY; GBPCHF; CADJPY; GBPJPY; AUDNZD; AUDCAD; AUDCHF; AUDJPY; CHFJPY; EURNZD; EURCAD; CADCHF; NZDJPY; NZDUSD. Timeframe: H1. Percent% manages closing both loss-making and profitable deals based on the account overall status. Using the EA on 23 symbols mentioned above allows the robot to cope with the drawdown in case of a long trend. While positions on some pairs
Illusion
Evgeniy Zhdan
3 (2)
The Illusion EA uses the probability theory - after a series of consecutive virtual losses - i.e. right during a flat the EA already starts trading in the trend. In addition, the EA considers the ratio of bullish/bearish candles on the higher timeframes to determine the greatest probability of the price movement direction. Only 1 order can be opened at a time. In case of a loss the following order will be placed with an increased lot (the multiplication coefficient is set in the parameters). The
The indicator plots a trend line and determines the levels for opening trades, in case the price goes "too far" away from the trend level. More detailed information is available in the screenshots. Settings Away from the trend line - distance from the trend line to the trades level; Arrow Signal for deals - enable displaying an arrow when the price reaches the trades level; Size of Arrow - size of the arrow; Alert Signal for deals - enable generating alerts when the price reaches the trades lev
Turbina
Evgeniy Zhdan
5 (4)
The axiom of the Forex market is that any trend will be broken. The Expert Advisor determines trend direction (the pink line), and calculates levels for opening opposite orders depending on the settings. The value of Away from the trend line for Deal will be different for each pair and timeframe, depending on the volatility of the trading instrument. Next orders can be opened with an increased lot (a static lot is used by default). See the screenshots to understand the idea of the Expert Advisor
Odysseus
Evgeniy Zhdan
The Expert Advisor determines the moments of strong movements and opens a position in the direction of the most probable price movement. The strategy always uses stop loss and take profit. Several independent orders can be in the market (the maximum number is set in parameters). The goal of the EA's underlying trading system is the quantitative excess of the number of profitable deals over the number of losing ones. Recommended: EURUSD 5m; GBPUSD 5m; USDJPY 5m. The Expert Advisor is able to work
Vise
Evgeniy Zhdan
Vise is a trend indicator. The upper and lower lines follow the price showing the prevailing price direction. Frequent breakthroughs of the upper line indicate a bullish trend, while frequent breakthroughs of the lower line indicate a bearish one. Parameters Points for UpLine - initial number of points for the upper line; Points for DownLine - initial number of points for the lower line. During the breakthrough of the upper level (line), this level shifts upwards by Points for UpLine. If the up
Twinkle
Evgeniy Zhdan
Twinkle is a trend-based scalper using stop loss and take profit invisible to the broker. The EA does not look for trend reversals. The EA catches strong market movements and opens orders in the direction of the trend. Your broker will not see the order closing levels. The EA closes orders independently when reaching the take profit or stop loss levels specified in the settings. Recommended trading symbols: EURUSD M5, GBPUSD M5. ECN accounts with 5 digits quotes are recommended. Expert Advisor
Shine
Evgeniy Zhdan
4.75 (4)
This Expert Advisor implements elements of the Martingale system. Orders are opened at a specified distance from the moving average. The Parabolic SAR indicator and certain technical details are used to ensure the most accurate entries. The EA is highly customizable. It is recommended for simultaneous use on 4 currency pairs: EURUSD M15; GBPUSD M15; USDJPY M15; USDCAD M15. Despite good stability, it is advisable to disable the EA operation during the days rich in news releases. Configurations P
LuckyCase
Evgeniy Zhdan
LuckyCase is an Expert Advisor with martingale elements. The EA strategy is based on a significant "deviation" of the price from SAR inadicator and the Bands levels breakthrough point. The money management system is an essential part of the EA. It starts working after a trade is opened. Trades are closed after accumulating specified points of market orders, by deposit % or after an opposite side of the channel is broken through. The default EA settings are meant for: EURUSD M15; USDJPY M15. The
Elize
Evgeniy Zhdan
The Elize Expert Advisor has been designed to work with the EURCHF currency pair. It considers the peculiarities of this trading instrument, its behavior and dependence on the behavior of other currencies. In particular, when the currencies of the European countries (EURUSD, GBPUSD, EURNOK, EURCHF) move in the same direction, the EA starts its operation and opens a deal in the trend direction of the European currencies. In the event of price rollbacks, the EA uses a unique method for making the
AllTrendLines
Evgeniy Zhdan
4 (1)
Brief Description of the All Trend Lines Indicator The indicator analyzes the wave structure of the market. What it displays on the chart: First. Wave pivots (semaphores) • Red markers – wave highs • Yellow markers – wave lows • Yellow-green markers – additional local extremes Second. Trend lines • Purple/blue lines – trends based on highs (resistance/support) • Beige/green lines – trends based on lows • Lines are built automatically by connecting wave pivots of the same type Third. Main trend
FastTraffic
Evgeniy Zhdan
The Expert Advisor has been specifically developed for trading gold (Spot Gold). The strategy is based on Fibo levels calculated from the previous (first) candle High/Low and the width of the current and lower timeframes channel. If important Fibo levels of different orders are located in a single price channel (within a spread), the EA defines this channel as the target for price movement and starts operation. Martingale and averaging are not used. Each order is independent and is accompanied b
Jazz
Evgeniy Zhdan
The algorithm of this Expert Advisor determines the significant price levels, where the trend often turns into a flat or reverses. Stochastic Oscillator serves as an additional filter of overbought/oversold zones. The EA sets stop loss and take profit after opening an order. The underlying trailing strategy applies a trailing stop. The EA is recommended for simultaneously use on three trading instruments: EURUSD M5, GBPUSD M5, EURCHF M5. Settings: Comment to order - comment to orders. MaxRisk -
Panther
Evgeniy Zhdan
The Expert Advisor looks for technical analysis patterns formed on the higher (hourly) timeframe to start working on the 5-minute chart. Technical analysis patterns used: double top/double bottom, head/shoulders, flag, expanding/narrowing triangles. The Relative Vigor Index technical indicator is used as the filter for opening deals. It is based on the idea that on the bull market the closing price is, as a rule, higher, than the opening price. It is the other way round on the bear market. This
Spook
Evgeniy Zhdan
The Expert Advisor calculates the divergence on the current and higher timeframes. In case the divergences coincide, the EA starts its operation. Deals have strict take profit and stop loss levels. Each deal is managed by trailing stop. The strategy involves the use of a tight stop-loss. Therefore, losing deals and/or series of losing deals are not uncommon. This EA is not suitable for those who have difficulties coping with losing deals. The EA is recommended for simultaneous use on the followi
Grand
Evgeniy Zhdan
The Expert Advisor has been developed specifically for the features of the CHFJPY currency pair. The EA's algorithm determines the direction of the current trend and starts operation. In case of a price reversal within the current trend, the EA adds additional orders. If trend changes, the EA starts to work in the direction contrary to the initial grid of orders. If there were no conditions for closing orders and the trend direction changed again, the EA continues to work with the "first" grid o
Intensive
Evgeniy Zhdan
The Expert Advisor algorithm determines on daily charts those candlestick patterns, which set the intraday trading direction. The trading EA determines how long the price is moving in overbought/oversold zones and starts working in the direction of the expected trend movement. Each position is accompanied with a tight stop loss and take profit. Only one active position can be open in the market. The EA was developed and tested using 99% quality quotes. The Expert Advisor has a built-in news filt
Slender
Evgeniy Zhdan
The strategy of this Expert Advisor is based on a hedging system, which implies placing opposite orders. The EA algorithm determines trend beginning and opens a position in the trend direction. In case of a wrong entry, the EA tries to neutralize the drawdown through opposite (hedging) orders at a preset interval (Coefficient of counter orders). Orders are closed when one of the two values ​​is reached - profit in percent or profit in points. The EA does not use lot increase. The EA wast tested
Dreamer
Evgeniy Zhdan
Советник работает по принципу хеджирования с периодическими "перекосами" в сторону трендовых направлений. Направления тренда советник определяет на основании стандартного индикатора Parabolic Stop and Reverse system (SAR). Уникальная стратегия установки балансирующих позиций позволяет избегать больших просадок даже при самых не благоприятных рыночных условиях. Параметры по умолчанию рекомендуется использовать на торговом инструменте: GBPJPY 15m. Разработка и оптимизация параметров производились
Snoot
Evgeniy Zhdan
5 (1)
This Expert Advisor works using a grid in the direction of a trend movement with the step between opened positions defined in the settings. The positions are closed by the total take profit. The Parabolic SAR standard indicator is used to filter order opening, which comes in the MetaTrader 4 package. The EA has been developed and tested using 99,9% quality of quotes. Operation of the EA in real time can be viewed in the signals . The best trading results have been achieved on CHFJPY M15. Settin
Solipsism
Evgeniy Zhdan
The Expert Advisor builds channels based on the data obtained using ATR and MA indicators according to the equations: Upper channel border = MA + ATR * (FIBO); Lower channel border = MA - ATR * (FIBO), where FIBO has the following values: Style of Trade - Aggressive = 1.61852; Style of Trade - Average = 3.26704; Style of Trade - Calm = 4.85556. Trades are opened inside the channel with the intervals defined in the settings. Long and short positions are opened independently. Positions are closed
The trading statistics indicator notifies the trader of the aggregate income of the trading account for different time intervals. The indicator has wide display settings on the graph. There is a choice of one of the two display languages on the chart- English and Russian. Settings Indicator language (ENG, RUS) - Select the language to display on the chart; To control the magic (-1: any magic) - Entering the Magic for control (-1: any Magic); Angle of indicator tie - Selecting the angle of the c
Filtrer:
Aucun avis
Répondre à l'avis