WaveMarkers MT4

Wave Markers: mappa delle onde adattiva con dashboard multi-timeframe

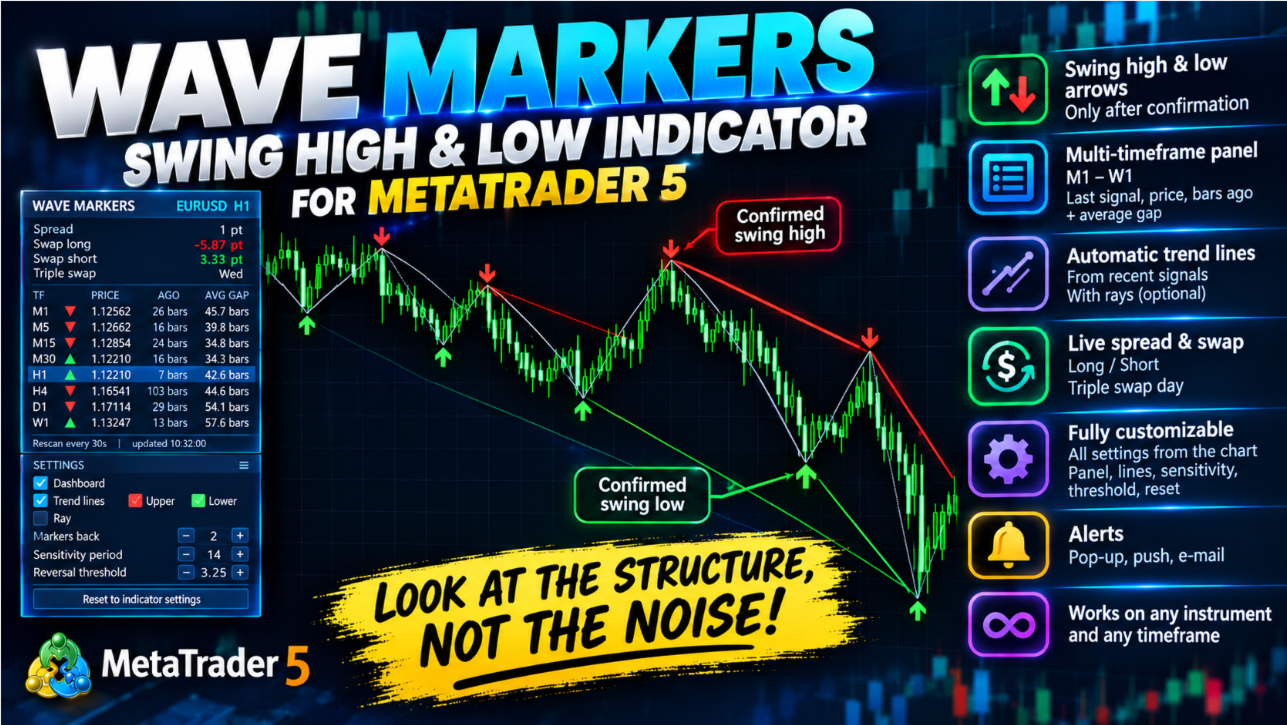
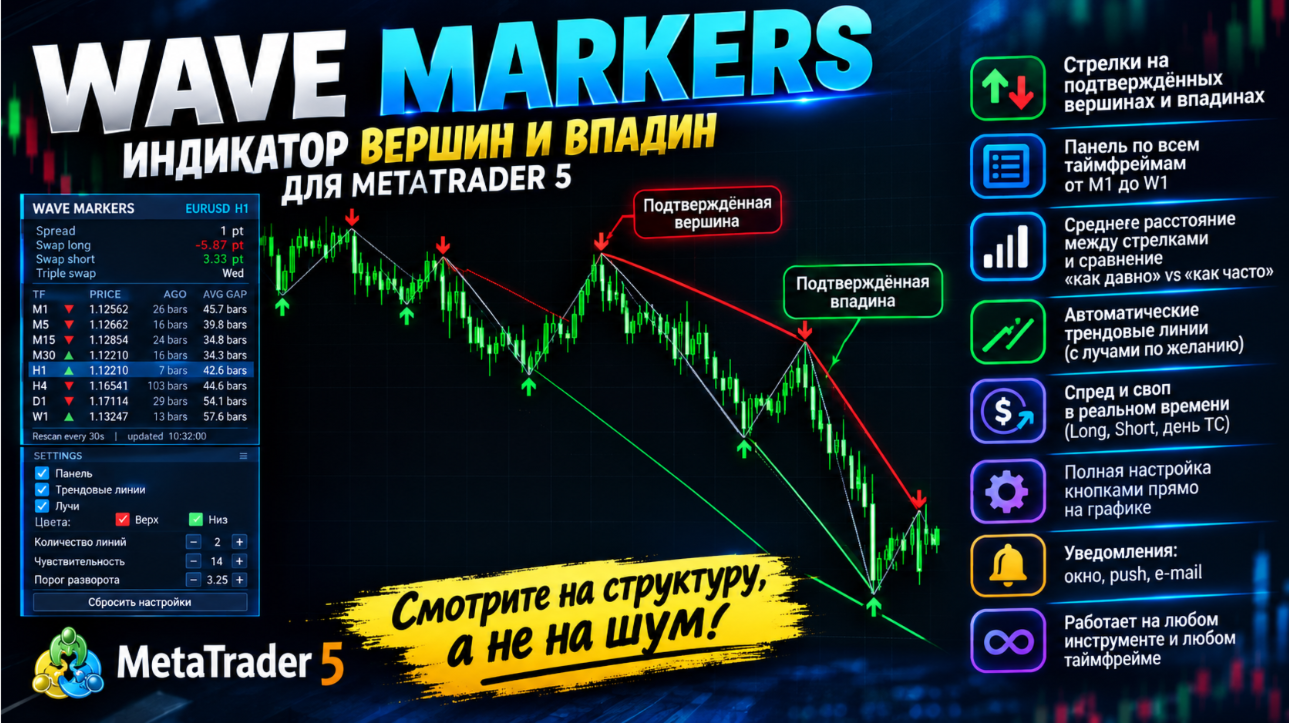
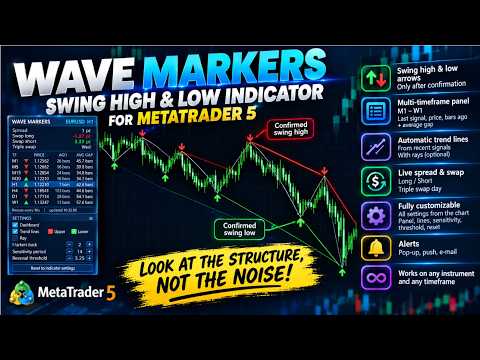
Vedi la vera struttura del mercato, non il rumore: massimi e minimi di swing confermati, linee di tendenza che li attraversano e la situazione di tutti i timeframe, da M1 a W1, in un unico pannello.

Che cos'è

Wave Markers è un indicatore di struttura grafica per MetaTrader 5. Individua i punti di svolta del prezzo (massimi e minimi di swing), li segnala con frecce pulite e costruisce intorno a essi strumenti di lavoro: linee di tendenza, una tabella di tutti i timeframe, oltre a spread e swap in tempo reale.

Non dà ordini di «compra» o «vendi» e non promette risultati. Fa una cosa sola e la fa con cura: mostrarti dove il mercato ha davvero girato, così puoi leggere la struttura in modo più rapido e coerente.

Perché non è un altro ZigZag

Uno ZigZag classico usa una distanza fissa (punti o percentuale) per decidere che cosa conta come inversione. Quel numero unico è quasi sempre sbagliato: troppo grande in un mercato tranquillo (si perdono onde reali), troppo piccolo in uno veloce (si raccoglie rumore).

Wave Markers funziona in modo diverso:

  • La soglia di inversione si adatta alla volatilità corrente. Si misura in multipli del movimento tipico del mercato stesso: si allarga quando il mercato accelera e si restringe quando si calma. Una stessa impostazione si comporta in modo sensato su major, oro, indici e criptovalute, e su timeframe diversi.
  • Un marcatore compare solo dopo che l'inversione è confermata. Il prezzo deve allontanarsi davvero dall'estremo della misura della soglia. Nessuno sguardo al futuro e nessun tentativo di indovinare un massimo mentre la candela è ancora in corso.
  • Il ritardo di conferma è onesto e prevedibile. Lo determina la soglia che scegli: una soglia più alta significa meno onde, più importanti e confermate più tardi; una soglia più bassa significa marcatori più frequenti e più rapidi.
  • La logica è identica su ogni timeframe, così la dashboard confronta cose confrontabili.

Vantaggi principali

  • Marcatori puliti e leggibili: una freccia verso il basso su ogni massimo di swing confermato, una freccia verso l'alto su ogni minimo
  • Soglia adattiva alla volatilità invece di un numero fisso
  • Linee di tendenza automatiche attraverso gli ultimi marcatori, con semirette opzionali
  • Dashboard per tutti i timeframe da M1 a W1: direzione dell'ultimo marcatore, suo prezzo, quante candele fa è comparso e distanza media tra marcatori della stessa direzione
  • Spread e swap (long, short e giorno del triplo swap) in tempo reale nello stesso pannello
  • Lo storico mancante sugli altri timeframe viene richiesto e caricato automaticamente
  • Leggero per il terminale: i marcatori sul grafico vengono ricalcolati una volta per ogni nuova candela e gli altri timeframe tramite timer, non a ogni tick
  • Tutto si controlla direttamente sul grafico, senza aprire la finestra delle impostazioni
  • Avvisi popup, notifiche push ed e-mail a ogni nuovo marcatore
  • Funziona su qualsiasi strumento e su qualsiasi timeframe

Che cosa vedi sul grafico

Marcatori e linea delle onde. Frecce sui massimi e minimi di swing confermati, a scelta unite da una linea sottile, così le onde si leggono a colpo d'occhio.

Linee di tendenza. L'indicatore traccia linee attraverso gli ultimi massimi di swing e, separatamente, attraverso gli ultimi minimi. Scegli tu quanti segmenti disegnare: con 1, una linea attraverso gli ultimi due marcatori di quel tipo; con 2, gli ultimi tre marcatori uniti da due linee, e così via. Le linee possono essere prolungate verso destra come semirette oppure restare segmenti che iniziano e finiscono esattamente sul massimo o sul minimo della candela.

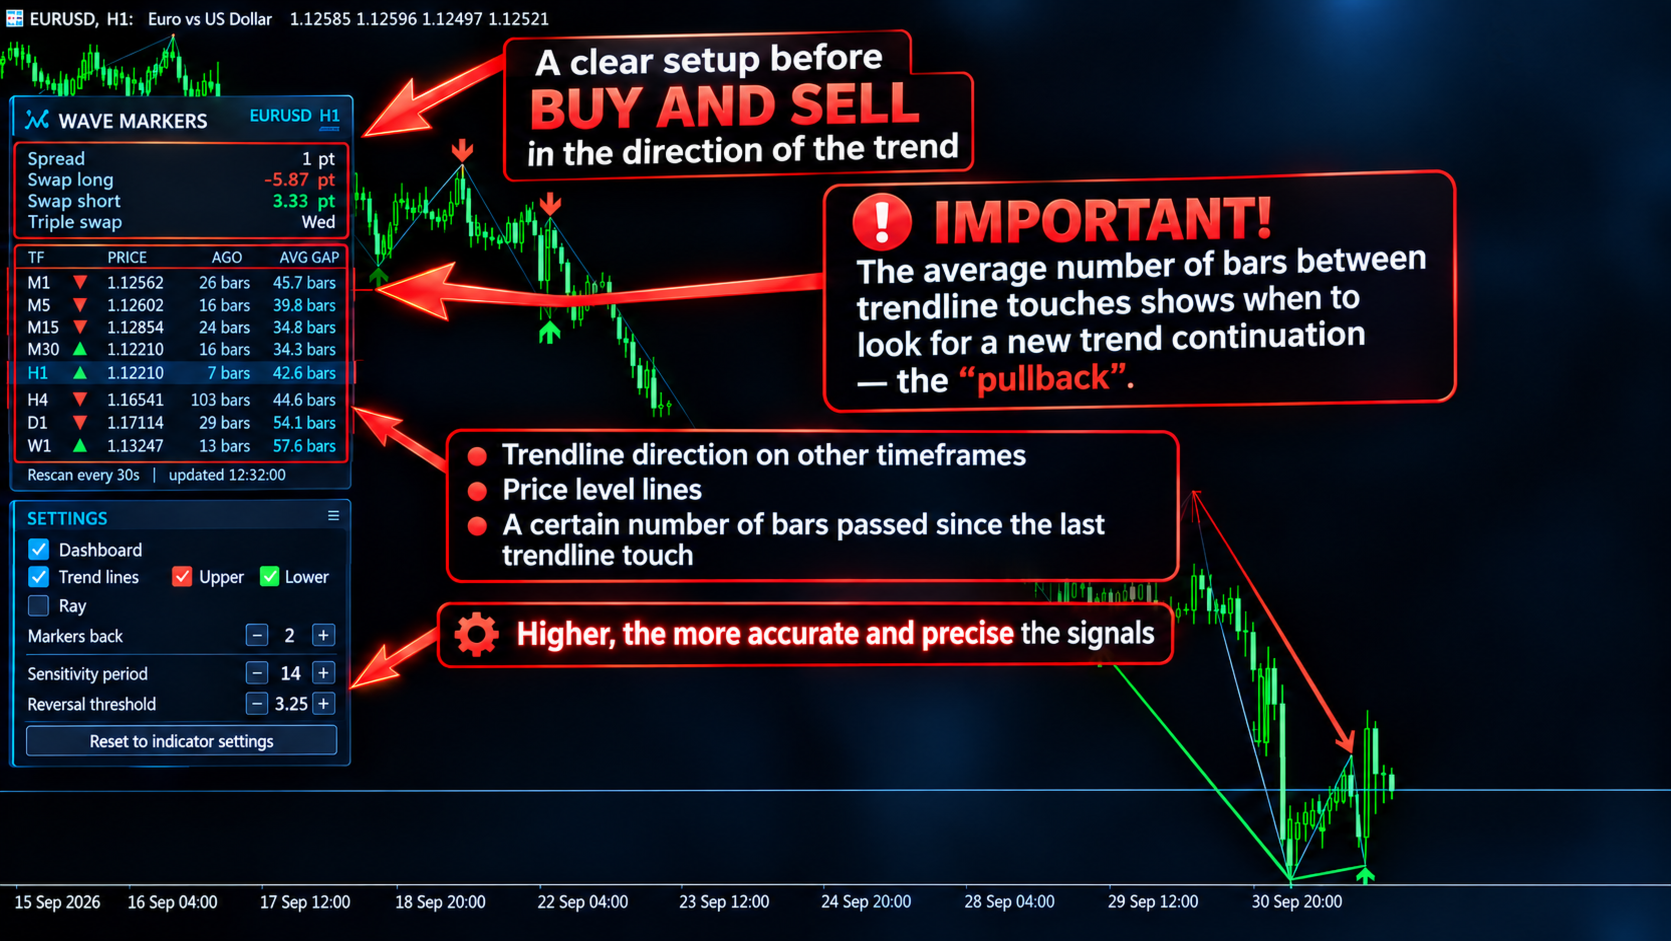
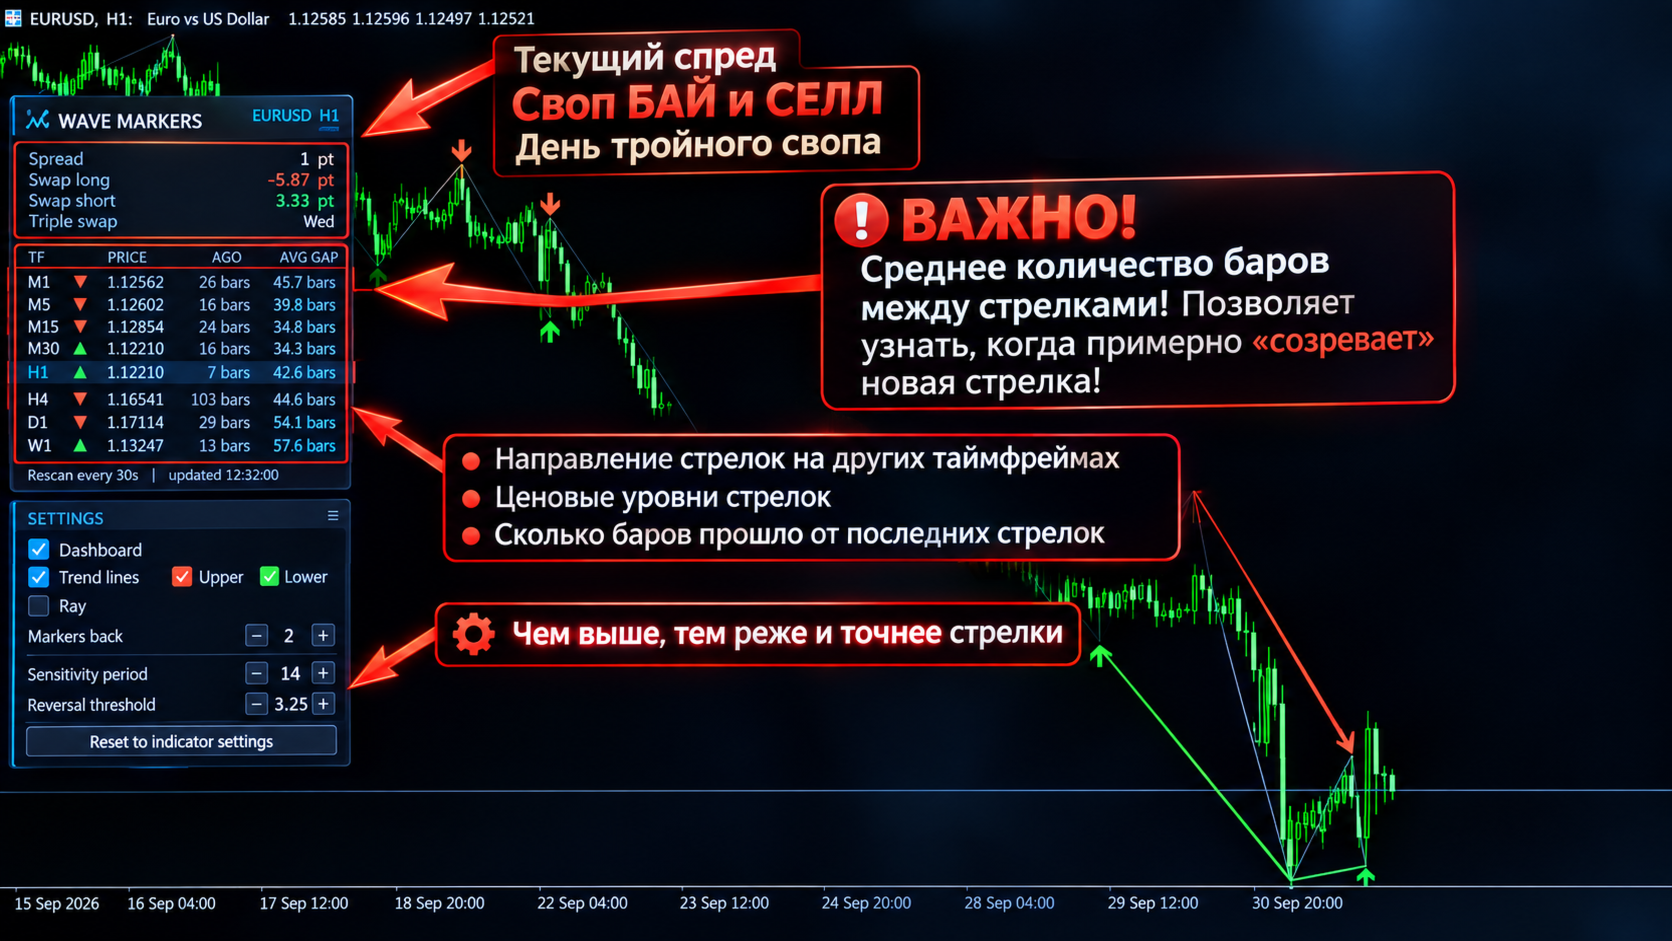
Dashboard multi-timeframe. Una riga per ogni timeframe, da M1 a W1:

  • la direzione dell'ultimo marcatore (▼ massimo, ▲ minimo)
  • il suo prezzo
  • quante candele fa è comparso
  • il numero medio di candele tra marcatori di quella direzione su tutto lo storico analizzato

Confrontare «quanto tempo fa» con «ogni quanto succede di solito» aiuta a capire in fretta in che fase del proprio ritmo si trova un timeframe.

Spread e swap. Lo spread corrente si aggiorna a ogni tick e può essere evidenziato quando supera il livello che imposti. Swap long, swap short e giorno del triplo swap sono mostrati con le unità corrette per lo strumento.

Pannello di controllo sul grafico

Sotto il pannello principale c'è una scheda compatta di impostazioni. Con essa puoi:

  • nascondere o mostrare il pannello principale per vedere la parte di grafico che copre
  • attivare o disattivare le linee di tendenza, separatamente quelle superiori e quelle inferiori
  • attivare o disattivare le semirette
  • cambiare il numero di linee con i pulsanti «−» e «+»
  • cambiare il periodo di sensibilità e la soglia di inversione con «−» e «+» e vedere subito il risultato
  • ripristinare tutto ai valori dell'indicatore con un clic
  • trascinare l'intero pannello in qualsiasi punto del grafico dalla barra del titolo

I valori della finestra delle impostazioni sono il punto di partenza. Da lì in poi prevale ciò che scegli sul grafico. Il cambio di timeframe mantiene le tue scelte e il pulsante di ripristino riporta i valori originali.

Come possono usarlo i trader

  • Leggere la struttura del mercato: massimi e minimi crescenti e decrescenti, e i punti in cui la struttura si rompe
  • Ottenere automaticamente livelli di swing e linee di tendenza rilevanti invece di tracciarli a mano
  • Valutare più timeframe a colpo d'occhio prima di prendere una decisione
  • Confrontare il ritmo dei marcatori tra i timeframe
  • Tenere sotto controllo il costo di spread e swap senza lasciare il grafico

Wave Markers è uno strumento di analisi. Non garantisce alcun risultato di trading e ogni decisione resta tua. Prova sempre ogni impostazione prima su un conto demo.

Da sapere

  • Poiché un marcatore viene confermato solo dopo che il prezzo ha invertito, compare sempre con un ritardo. È una scelta di progetto e l'entità del ritardo si regola con la soglia di inversione.
  • Gli altri timeframe vengono caricati dallo storico del tuo broker. Se un timeframe mostra «loading...», il terminale sta ancora costruendo le sue candele.
  • Per gli avvisi via e-mail, nel terminale deve essere configurata la posta (Strumenti → Opzioni → E-mail).

Impostazioni

Wave Markers

  • Wave markers: sensitivity period: su quante candele si misura il movimento tipico del mercato. Valori brevi reagiscono più in fretta ai cambi di volatilità, valori lunghi sono più stabili. 14 è un buon punto di partenza.
  • Wave markers: reversal threshold, x sensitivity: quanto il prezzo deve allontanarsi da un estremo, in multipli del movimento tipico, perché un marcatore venga confermato. Più alto significa meno onde, più importanti e confermate più tardi; più basso significa più marcatori, prima, ma con più rumore.
  • Analysis depth, bars (per timeframe): quante candele indietro analizza l'indicatore su ogni timeframe. Più profondità significa più storico sul grafico e nelle statistiche del pannello.

Chart Display

  • Show wave markers on chart: attiva o disattiva le frecce.
  • Connect wave markers with a line: unisce i marcatori consecutivi con una linea sottile, così le onde sono facili da seguire.
  • Swing high marker color: colore delle frecce sui massimi di swing.
  • Swing low marker color: colore delle frecce sui minimi di swing.
  • Connecting line color: colore della linea che unisce i marcatori.
  • Marker size (1-5): dimensione delle frecce.
  • Connecting line width (1-5): spessore della linea che unisce i marcatori.

Dashboard

  • Show info panel on chart: mostra la dashboard e la scheda di controllo sul grafico. Se disattivata, l'indicatore lavora solo con i valori di questa finestra di impostazioni.
  • Panel offset X, px: posizione orizzontale iniziale del pannello. In seguito puoi trascinarlo con il mouse.
  • Panel offset Y, px: posizione verticale iniziale del pannello.
  • Other timeframes re-check interval, sec: ogni quanto vengono ricontrollati gli altri timeframe. Il grafico corrente si aggiorna a ogni nuova candela; questo parametro riguarda solo la tabella (minimo 5 secondi).
  • Spread highlight level, points (0 = off): il valore dello spread diventa arancione quando supera questo livello. Zero disattiva l'evidenziazione.

Alerts (current timeframe)

  • Popup alert on new wave marker: mostra una finestra di avviso del terminale quando viene confermato un nuovo marcatore.
  • Push notification on new wave marker: invia una notifica al telefono (richiede il MetaQuotes ID nelle impostazioni del terminale).
  • E-mail notification on new wave marker: invia un'e-mail (richiede la configurazione della posta nel terminale).

Trend Lines (through wave markers)

  • Draw trend lines through wave markers: interruttore generale di tutte le linee di tendenza.
  • Lines through upper markers (highs): disegna linee attraverso i massimi di swing.
  • Lines through lower markers (lows): disegna linee attraverso i minimi di swing.
  • Number of lines per side (markers back, 1-50): quanti segmenti disegnare per ciascun lato. Con 1, una linea attraverso gli ultimi due marcatori; con 2, gli ultimi tre marcatori uniti da due linee, e così via.
  • Extend all lines to the right (ray): prolunga ogni linea verso destra fino al bordo del grafico. Se disattivato, ogni linea inizia e finisce sui suoi marcatori.
  • Upper line color: colore delle linee attraverso i massimi di swing.
  • Lower line color: colore delle linee attraverso i minimi di swing.
  • Line style: continua, tratteggiata, punteggiata e così via.
  • Line width (1-5, solid style only): spessore delle linee. MetaTrader applica spessori superiori a 1 solo alle linee continue.
  • Draw lines behind the chart: disegna le linee sotto le candele invece che sopra.
Prodotti consigliati
The indicator plots flexible support and resistance levels (dots). A special phase of movement is used for construction. Levels are formed dynamically, that is, each new candle can continue the level or complete it. The level can provide resistance or support to the price even where it is no longer there. Also, support and resistance levels can change roles. The importance of levels is affected by: the amount of time the level is formed and the number of touches. The significance of these lev
In the context of trading,   Malaysia SNR   (Support and Resistance) refers to the technical analysis of   support and resistance levels   in financial markets, particularly for stocks, indices, or other assets traded. There are three type of Malaysia SNR level Classic , GAP and Flipped 1. Classic Support   is the price level at which an asset tends to stop falling and may start to rebound. It acts as a "floor" where demand is strong enough to prevent the price from dropping further. Resistance
The indicator draws trend lines based on Thomas Demark algorithm. It draws lines from different timeframes on one chart. The timeframes can be higher than or equal to the timeframe of the chart, on which the indicator is used. The indicator considers breakthrough qualifiers (if the conditions are met, an additional symbol appears in the place of the breakthrough) and draws approximate targets (target line above/below the current prices) according to Demark algorithm. Recommended timeframes for t
FiboZag
Andriy Sydoruk
Indicator FiboZag - transfer the indicator to the chart and the Fibonacci levels will be built automatically on the last ZigZag turn. The main advantage lies in the correct construction of Fibonacci levels and markup of price levels. Simple, visual and effective use. The indicator is not redrawn and does not lag. Works on all currency pairs and on all timeframes.
Provides instant signals on the chart in panel form. Equipped with signal description and trading analysis tools such as drawing auto trendlines, support/resistance area, regression channel, Fibonacci levels, Pivot levels and current signal price, signal time, signal expiry and stoploss recommendation. Also sending alert messages to all available mt4 alert tool. A detailed description panel provides information about where the signal comes from and what indicators are behind the signal. Includin
Indicator Support and Resistence plain in your chart seven lines; Red line=Resistence 3. Red line=Resistence 2. Red line=Resistence 1. Yellow line= Pivot. Green line= Support 1. Green line= Support 2. Green line= Support 3. adattable in all timeframe (minute 1, minute   5, minute   15, minute   30, Hour 1, Hour 4,Day 1,Week 1,Mounth 1); Buy under support and sell over the resistence;
Pivot Bro
Thushara Dissanayake
5 (1)
Pivot Confluence Zones   è un   indicatore di analisi tecnica per MT4 e MT5   progettato per identificare   zone di ritracciamento   ,   aree di inversione   e   livelli di supporto e resistenza,   combinando   Pivot Point   ,   ritracciamenti di Fibonacci   ,   ATR   e   ADR   in un unico spazio di lavoro per il trading. Invece di affidarsi a un singolo strumento tecnico, l'indicatore ricerca   zone di confluenza   in cui si sovrappongono più livelli di trading, aiutando i trader a valutare le
The Auto Super Pivot indicator is an indicator designed to calculate support points and resistance points for pivot points. this indicator has the ability to calculate standard pivot, fibonacci, camarilla, woodie and demark pivot points. It also allows you to use all time zones with the time frame feature. Another feature of the indicator is the auto time slice feature. This feature allows automatic calculations without having to set any time zone. Features 6 different pivot calculation modes A
RelicusRoad Daily Pivots è un indicatore di punti pivot giornalieri per MetaTrader 4 e MetaTrader 5 che divide il range del giorno precedente in livelli Fibonacci e li estende sopra e sotto di esso, da meno 100 a più 200 per cento. Invece dei classici floor pivot, il range completato precedente viene trattato come una scala in cui il minimo è 0% e il massimo è 100%. Diciannove livelli vengono stampati come brevi marcatori colorati al bordo destro del grafico, così l'ampiezza del movimento di ogg
FREE
Pivots
Paul Geirnaerdt
Pivots is an indicator to show pivots for relevant time frames. Besides the pivots the indicator can also show daly open line, the resistance and support levels, the ADR Fibonacci levels and the order of the pivots. Pivots includes an intelligent algorithm to eliminate Sunday candles, but only if your broker provides those. Pivots are significant price levels that may serve as support, resistance or breakout levels Settings textFont - font to use for the labels. textSize - font size. textColor -
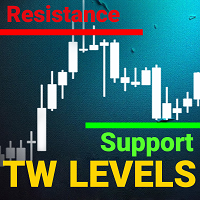
support resistance levels indicator mt4: Questo strumento è un indicatore multi-timeframe che identifica e traccia le linee di supporto e resistenza, così come i livelli di Fibonacci, su un grafico con la stessa precisione dell'occhio umano. I livelli di supporto e resistenza TW per il forex hanno un algoritmo complesso che scansiona il grafico per identificare i precedenti livelli di stabilizzazione dei prezzi e rimbalzi, registrando il numero di tocchi. Sei stanco di disegnare manualmente i
This is indicator signals entry buy or sell for trader. It notification price entry to trader and price Stop Loss and price Take Profit. Indicator price for entry orders Pending Limit. Input Parameters On Alert - true/false (Displays a message in a separate window.) On Send Notification - false/true. (Sends push notifications to the mobile terminals, whose Meta Quotes IDs are specified in the "Notifications" tab. (Strict use restrictions are set for the SendNotification() function: no more than
Price pivot points H1 - an indicator that shows price pivot points on the H1 timeframe with an accuracy of up to 95%. 95 signals from 100 will accurately indicate the place of the price reversal in the opposite direction. The indicator does not redraw its values. Suitable for trading on any currency pair. It can be used for both intraday scalping and long-term trading. Price pivot points H1 shows signals as arrows. When the price reverses, the indicator will draw an arrow on the chart. If the p
This is a dial indicator for trading from the level of support resistance  --- complete lack of redrawing ---  He is able to determine the levels of support resistance  Finds the best entry points and shows them with arrows.  If a trend is forming, the indicator will always notify with a arrow signal.  buy signal blue arrow for sale red arrow  This signaling tool can also be used on a sideways market.  The main thing is that it is volatile.!!!!!!  Good percentage of correct indicator predictio
KT Asian Breakout Indicator
KEENBASE SOFTWARE SOLUTIONS
Traccia l'intervallo della sessione asiatica KT Asian Breakout Indicator segna il massimo e il minimo di una finestra di quattro ore della sessione asiatica e controlla il prezzo dopo il completamento dell'intervallo. Il parametro GMT Offset allinea la sessione all'ora del server del broker, mentre Draw Session Box controlla la visualizzazione dell'intervallo. Osserva insieme il breakout e i livelli operativi Una freccia rialzista appare quando il prezzo chiude sopra il massimo della sessione. U
ZigZag Extras Display BreakOut points ZigZag Extras Display BreakOut points is a MetaTrader 4 indicator for traders who use ZigZag, breakout points, market structure, BOS, CHoCH, swing high, swing low, support and resistance, and higher timeframe bias in their trading analysis. Main Benefits Displays confirmed ZigZag swing highs and swing lows Marks BOS Up, BOS Down, CHoCH Up and CHoCH Down Shows Depth Highest High and Depth Lowest Low lines Adds HH, HL, LH and LL structure labels Includes HTF b
Trend Divergence Indicator: Your Essential Tool for Market Analysis The Trend Divergence Indicator is a powerful tool designed to assist traders in identifying market trends and pinpointing entry points with precision. By leveraging price divergence, this indicator enhances your trading strategy, offering reliable insights and filtering unnecessary signals. Key Features and Benefits of the Trend Divergence Indicator Accurate Trend Analysis: The Trend Divergence Indicator uses price divergence t
Optimized Version of the Pivot-Based Adaptive Support, Resistance, and Signal Line Indicator No Parameters, Simple and Easy to Use, Suitable for Daily and Lower Timeframes. Advantages: Applicable to all instruments. Suitable for all timeframes. The indicator automatically adjusts with changing data, providing more accurate signals. Instructions for Use: If the current price breaks above the signal line, the trend is bullish, with the initial target being the upper resistance line. If the price
The   Angle Prices   indicator is a tool that calculates the price angle based on price analysis, interpreting the time vector in the form of price points on the price chart. In other words, the X axis and Y axis are represented as price points, so you can actually calculate the angle with two axes of the same dimension. This allows traders to obtain information about the direction of price movement and possible entry or exit points for trades. Let's look at the main characteristics and interpr
Divergence Sync
Pavel Verveyko
5 (1)
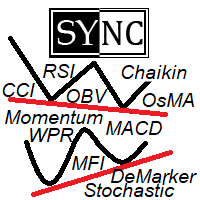
Divergence and Convergence are important harbingers of reversals in stock markets. The Divergence Sync indicator is designed to automatically search for divergences on a large number of indicators with different parameters. The search for divergences is carried out on these indicators: (CCI, CHO, DeMarker, MACD, MFI, Momentum, OBV, OsMA, RSI, Stochastic, WPR, Awesome Oscillator ). To search for divergences, you can use one technical indicator or search simultaneously on any number of indicator
This indicator is designed based on Mr.   WD   Gann's square of nine methods. Using this indicator, we can enter the desired   pivot   price and, based on the coefficient we assign to it, extract 8   support and resistance   numbers with 8 angles of 45, 90, 135, 180, 225, 270, 315, and 360. Calculates 8   support and resistance   points and draws   support and resistance   lines. The coefficient is to triple the number of executions. To select   pivot points   in which a price is a large nu
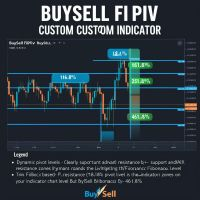
BuySell FibPiv Fibonacci Pivot Level Indicator with Dynamic Support and Resistance Zones Overview BuySell FibPiv is a Fibonacci pivot-based technical analysis indicator designed to calculate dynamic support and resistance levels using previous session price data. The indicator applies Fibonacci expansion and retracement calculations to generate multiple pivot-based levels for intraday and swing trading analysis. It provides: Central pivot calculation Fibonacci-based support and resistance zones
Owl smart levels
Sergey Ermolov
4.26 (38)
Quando si opera seguendo il trend, la difficoltà principale non è trovare un livello, ma capire dove un ingresso è realmente valido. Il prezzo spesso reagisce ai livelli, ma non riesce a proseguire il movimento — il che porta a ingressi falsi o opportunità perse. Owl Smart Levels non si limita a mostrare livelli , ma evidenzia zone basate sulla struttura di mercato e sui pullback. Questo consente di valutare i punti di ingresso in modo diverso ed evitare una parte dei segnali falsi. Cosa includ
Pivot Points MT4
KEENBASE SOFTWARE SOLUTIONS
KT Pivot Points traccia automaticamente i livelli pivot giornalieri, settimanali e mensili su un grafico utilizzando i dati più recenti. I punti pivot sono indicatori ampiamente utilizzati nell'analisi tecnica, soprattutto nel mercato Forex. Caratteristiche Invia avvisi quando il prezzo tocca un livello pivot.  Offre una personalizzazione completa per ciascun tipo di livello pivot.   Mostra chiaramente i livelli pivot giornalieri, settimanali e mensili. Utilizza poche risorse CPU per calcoli p
What are "pivot points"? Pivot point analysis is often used in conjunction with the calculation of support and resistance levels, as is the case with trend line analysis. Pivot point analysis calculates the first support and resistance levels using the trading range width between the pivot point and the previous day's high or low price. The second support and resistance levels are calculated using the entire width between the previous day's high and low prices. Looking for a quality pivot poin
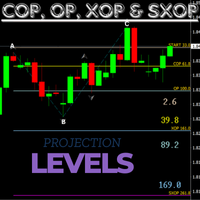
If you're familiar with COP, OP, and XOP levels, this indicator is definitely worth considering. There's no need to manually plot the ABC levels, as the indicator automatically calculates and displays the OP projection levels for you, updating regularly as the price changes. This is an essential indicator for your trading toolkit. Please if you are unsual on how to use this indicator feel fell to ask me for help and i can assist you where i can. Happy trading!
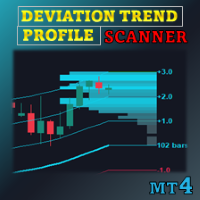
Offerta speciale : ALL TOOLS , solo $35 ciascuno! Nuovi strumenti   saranno a   $30   per la   prima settimana   o per   i primi 3 acquisti !  Canale Trading Tools su MQL5 : unisciti per ricevere le mie ultime novità Deviation Trend Profile Scanner (DTPS) è un indicatore che individua la direzione del trend, misura la volatilità e organizza le informazioni di più simboli/timeframe in un’unica tabella. Utilizza una media mobile configurabile, zone di deviazione standard adattive e un istogramma
Possible Price reversals levels - based on  Fibonacci + Support +  Resistance Levels Auto levels drawn based on input index (Bars Count )  ---->>> Price Over 50% Fibo line ---> UP TREND ---> BUY when price drop near Support Lines  ---->>> Price Down 50% Fibo line ---> DOWN TREND ---> SELL when price goes up  near Resistance Lines  --->>> The more close price levels ----> the more possibility for price reversals --->>> are you a scalper --> try it on M1 charts with big index like 5000 bars  or
Fair Value Gap (FVG) & Inversion Fair Value Gap (iFVG) Nelle metodologie ICT (Inner Circle Trader) e Smart Money Concepts (SMC), un Fair Value Gap (FVG)—noto anche come squilibrio (imbalance)—si verifica quando il prezzo si muove con un momento estremo, lasciando dietro di sé un vuoto di liquidità. Questi vuoti non colmati agiscono come magneti per la futura azione dei prezzi, rendendoli le zone di ritracciamento e di ingresso a più alta probabilità per i trader professionisti. Ma non tutti i FV
This is the Full Version, to get the free version please contact me. The free version works on “GBPCHF” charts. All symbols and time frames scanner. Harmonic Pattern Harmonic patterns are used in technical analysis that traders use to find trend reversals. They are considered one of the most accurate technical analysis tools, as they allow traders to predict the future price movement direction and the potential trend targets. Also, unlike many other technical tools, the number of false signals
Gli utenti di questo prodotto hanno anche acquistato
Trend SniperX MT4
Sarvarbek Abduvoxobov
5 (3)
Trend Sniper X è un indicatore di trend-following multi-timeframe per MetaTrader 5 che aiuta i trader a identificare la direzione del trend e i potenziali punti di inversione con chiarezza e precisione. Per MT5: https://www.mql5.com/en/market/product/181101 Informazioni sul prezzo: Il prezzo attuale è promozionale ed è soggetto a modifiche con il rilascio dei prossimi aggiornamenti e nuove funzionalità. Canale Code2Profit Domina il mercato con l'analisi multi-timeframe! Come massimizzare il tuo
Miraculous Indicator Binary & Forex v3 StrategySafe Miraculous Indicator Binary & Forex v3 StrategySafe è un indicatore professionale progettato per trader che cercano segnali chiari, strumenti di conferma avanzati e un metodo strutturato per operare sui mercati Binary e Forex. La versione v3 include MIR Dashboard, Miraculous Confirmation Dashboard, GANN Law, livelli Square of 9, angoli GANN e una modalità Forex più completa per un’analisi di mercato più precisa. Caratteristiche principali Modal
SR Liquidity
Oleg Rodin
5 (2)
SR Liquidity è un indicatore di trading progettato per individuare le zone nascoste in cui si concentra la liquidità di mercato e dove il prezzo reagisce con maggiore intensità. Queste aree di liquidità agiscono come potenti livelli di supporto e resistenza, offrendo una mappa chiara dei punti in cui è più probabile che il mercato inverta la propria direzione. Invece di tracciare le classiche linee di supporto e resistenza, SR Liquidity analizza l'effettivo comportamento dei prezzi per individua
Gann Made Easy
Oleg Rodin
4.84 (172)
Gann Made Easy è un sistema di trading Forex professionale e facile da usare che si basa sui migliori principi del trading utilizzando la teoria di mr. WD Gann. L'indicatore fornisce segnali ACQUISTA e VENDI accurati, inclusi i livelli di Stop Loss e Take Profit. Puoi fare trading anche in movimento utilizzando le notifiche PUSH. CONTATTAMI DOPO L'ACQUISTO PER RICEVERE GRATUITAMENTE LE ISTRUZIONI DI TRADING E OTTIMI INDICATORI EXTRA! Probabilmente hai già sentito parlare molte volte dei metodi d
PTS Precision Index Oscillator V2
PrecisionTradingSystems
5 (1)
L'Oscillatore dell'Indice di Precisione (Pi-Osc) di Roger Medcalf di Precision Trading Systems La Versione 2 è stata attentamente rielaborata per essere estremamente veloce nel caricarsi sul tuo grafico e sono state apportate alcune altre migliorie tecniche per migliorare l'esperienza. Il Pi-Osc è stato creato per fornire segnali di sincronizzazione del trading accurati progettati per individuare punti di esaurimento estremi, i punti ai quali i mercati vengono costretti a recarsi solo per eli
DayTrader PRO MT4
Davit Beridze
4.6 (10)
DayTrader PRO MT5:  https://www.mql5.com/en/market/product/186222 DayTrader PRO è un indicatore di trading avanzato che combina il filtro Laguerre di John Ehlers con un potente motore di auto-ottimizzazione. Invece di utilizzare parametri fissi, l'indicatore ricerca automaticamente le migliori impostazioni in base alle condizioni recenti del mercato, aiutandoti ad adattarti alla volatilità variabile senza costanti aggiustamenti manuali. L'indicatore genera segnali chiari di ACQUISTO (BUY) e VEND
Currency Strength Wizard è un indicatore molto potente che ti fornisce una soluzione all-in-one per un trading di successo. L'indicatore calcola la potenza di questa o quella coppia forex utilizzando i dati di tutte le valute su più intervalli di tempo. Questi dati sono rappresentati in una forma di indice di valuta facile da usare e linee elettriche di valuta che puoi utilizzare per vedere il potere di questa o quella valuta. Tutto ciò di cui hai bisogno è collegare l'indicatore al grafico che
M1 Sniper
Oleg Rodin
4.97 (30)
M1 SNIPER è un sistema di indicatori di trading facile da usare. Si tratta di un indicatore a freccia progettato per l'intervallo temporale M1. L'indicatore può essere utilizzato come sistema autonomo per lo scalping sull'intervallo temporale M1 e come parte del tuo sistema di trading esistente. Sebbene questo sistema di trading sia stato progettato specificamente per il trading sull'intervallo temporale M1, può comunque essere utilizzato anche con altri intervalli temporali. Inizialmente ho pro
PRO Renko System
Oleg Rodin
5 (31)
PRO Renko System è un sistema di trading altamente accurato appositamente progettato per il trading di grafici RENKO. Questo è un sistema universale che può essere applicato a vari strumenti di trading. Il sistema neutralizza efficacemente il cosiddetto rumore di mercato che consente di accedere a segnali di inversione accurati. L'indicatore è molto facile da usare e ha un solo parametro responsabile della generazione del segnale. Puoi facilmente adattare lo strumento a qualsiasi strumento di
PZ Swing Trading
PZ TRADING SLU
5 (3)
Protect against whipsaws: revolutionize your swing trading approach Swing Trading is the first indicator designed to detect swings in the direction of the trend and possible reversal swings. It uses the baseline swing trading approach, widely described in trading literature. The indicator studies several price and time vectors to track the aggregate trend direction and detects situations in which the market is oversold or overbought and ready to correct. [ Installation Guide | Update Guide | Tro
This is a professional chart indicator designed for traders focused on stability and clear price action. It helps filter market noise and provides clear visual entry and exit zones for your trading decisions. Core Features: Strictly Non-Repainting: The system is built with strict non-repaint logic. What you see on the chart is the true historical performance. Confirmed Signals: Signals are triggered and confirmed only after the candle closes . Once a trading arrow appears on a closed candle, it
Questo prodotto è stato aggiornato per il mercato 2026 e ottimizzato per le ultime build di MT5. AVVISO DI AGGIORNAMENTO PREZZO: Smart Trend Trading System è attualmente disponibile a $99 . Il prezzo aumenterà a $199 dopo i prossimi 30 acquisti . OFFERTA SPECIALE: Dopo aver acquistato Smart Trend Trading System, inviami un messaggio privato per ricevere Smart Universal EA GRATIS e trasformare i tuoi segnali Smart Trend in operazioni automatiche. Smart Trend Trading System è un sistema di tradin
Quantum Naked SMC Prime is a streamlined Smart Money Concepts indicator designed for traders who prefer a clean chart, structured market analysis and clear visual trade setups without unnecessary complexity. The indicator combines market structure, liquidity behavior, institutional zones and confirmation logic into a compact analytical framework. Instead of flooding the chart with technical indicators, Quantum Naked SMC Prime focuses on the core elements of price action and Smart Money Concepts.
KURAMA GOLD SIGNAL PRO (MT4) — Filtro a 7 livelli · TP/SL automatico · Punteggio di qualità · Salvataggio dello storico dei segnali | Sistema di trading completo per XAUUSD Nessun ridisegno (repaint) in tempo reale. Nell'istante in cui appare un segnale, freccia, ingresso, TP e SL vengono bloccati sul posto e non si spostano mai più. Ciò che fai tradare è proprio questo segnale in tempo reale. E nella v7.20, ogni segnale realmente inviato viene salvato automaticamente e ripristinato con esattez
Quantum Breakout Indicator PRO
Bogdan Ion Puscasu
4.96 (26)
Presentazione       Quantum Breakout PRO   , l'innovativo indicatore MQL5 che sta trasformando il modo in cui scambi le zone di breakout! Sviluppato da un team di trader esperti con un'esperienza di trading di oltre 13 anni,   Quantum Breakout PRO   è progettato per spingere il tuo viaggio di trading a nuovi livelli con la sua strategia innovativa e dinamica della zona di breakout. Quantum Breakout Indicator ti fornirà frecce di segnalazione sulle zone di breakout con 5 zone target di profitt
SISTEMA DI REVERSAL IN SOTTOFINESTRA ARTEMIS è un potente indicatore Forex senza repaint, progettato per identificare operazioni di inversione ad alta probabilità utilizzando una combinazione di Smart Money Concepts (concetti di denaro intelligente) e analisi del momentum stocastico. Sviluppato per trader che cercano ingressi precisi, questo indicatore combina la rilevazione dei liquidity sweep, i cambiamenti della struttura di mercato e la conferma del momentum in un unico strumento di trading
Introducing the POWER TRADE Indicator Created by a small group of experienced traders with years of profitable experience in the financial markets, the Power Trade Indicator is a plug-and-play trading tool designed to help traders spot high-quality setups with ease and confidence. What It Does: It provides powerful entry signals, profit-taking zones, and rebound areas — giving you a complete view of where price action is most likely to move next. The indicator reacts in real time, al
Scalper Inside PRO
Alexey Minkov
4.74 (69)
Scalper Inside PRO helps you read the intraday trend and plan a trade before you enter the market. It is built around three exclusive strategies for a sharper read of the market. The moment a signal appears, the indicator evaluates market direction and calculates the key levels, so you see the potential entry, the expected stop-loss and several profit-taking levels in advance. Detailed performance statistics show how different instruments and strategies performed in history and help you pick ass
PZ Trend Trading
PZ TRADING SLU
4.8 (5)
Capture every opportunity: your go-to indicator for profitable trend trading Trend Trading is an indicator designed to profit as much as possible from trends taking place in the market, by timing pullbacks and breakouts. It finds trading opportunities by analyzing what the price is doing during established trends. [ Installation Guide | Update Guide | Troubleshooting | FAQ | All Products ] Trade financial markets with confidence and efficiency Profit from established trends without getting whips
Attualmente 30% di sconto! La soluzione migliore per ogni principiante o trader esperto! Questo software per cruscotti funziona su 28 coppie di valute. Si basa su 2 dei nostri indicatori principali (Advanced Currency Strength 28 e Advanced Currency Impulse). Offre un'ottima panoramica dell'intero mercato Forex. Mostra i valori di forza delle valute avanzate, la velocità di movimento delle valute e i segnali per 28 coppie Forex in tutti i (9) timeframe. Immaginate come migliorerà il vostro tra
RFI levels PRO
Roman Podpora
5 (1)
L'indicatore mostra accuratamente i punti di inversione e le zone di ritorno dei prezzi in cui il       Principali attori   . Vedi dove si formano le nuove tendenze e prendi decisioni con la massima precisione, mantenendo il controllo su ogni operazione. VERSION MT5     -     Rivela il suo massimo potenziale se combinato con l'indicatore   TREND LINES PRO Cosa mostra l'indicatore: Strutture di inversione e livelli di inversione con attivazione all'inizio di un nuovo trend. Visualizzazione dei l
Here   our MT5 version more valuable tools SMC Trend Trading   ,  Easy SMC Trading  ,  Institutional SMC Architect Volume Analysis Tools  ,  Volume flow Profile  ,  Market volume profile  , FVG with Volume  , Liquidity Heatmap Profile  ,  Volume Spread Analysis 2. Key Features Dynamic Filtering : The core feature. As soon as the current price crosses a historical liquidity level, that level disappears. This reduces chart clutter and prevents you from trading off "dead" support/resistance. Liqui
Trend Lines PRO
Roman Podpora
5 (1)
LINEE DI TENDENZA PRO       Aiuta a capire dove il mercato sta realmente cambiando direzione. L'indicatore mostra reali inversioni di tendenza e punti in cui i principali attori rientrano. Vedi  Linee BOS   Cambiamenti di tendenza e livelli chiave su timeframe più ampi, senza impostazioni complesse o rumore inutile. I segnali non vengono ridisegnati e rimangono sul grafico dopo la chiusura della barra. VERSIONE MT 5     -      Svela il suo massimo potenziale se abbinato all'indicatore   RFI LEVE
Currency Strength Exotics
Bernhard Schweigert
4.88 (33)
ATTUALMENTE SCONTATO DEL 20%! La soluzione migliore per qualsiasi principiante o trader esperto! Questo indicatore è specializzato nel mostrare la forza della valuta per qualsiasi simbolo come coppie esotiche, materie prime, indici o futures. È il primo nel suo genere, qualsiasi simbolo può essere aggiunto alla nona riga per mostrare la vera forza della valuta di Oro, Argento, Petrolio, DAX, US30, MXN, TRY, CNH ecc. Si tratta di uno strumento di trading unico, di alta qualità e conveniente pe
Atomic Analyst
Issam Kassas
5 (13)
Questo prodotto è stato aggiornato per il mercato 2026 e ottimizzato per le ultime build di MT5. AVVISO DI AGGIORNAMENTO PREZZO: Atomic Analyst è attualmente disponibile a $99 . Il prezzo aumenterà a $199 dopo i prossimi 30 acquisti . OFFERTA SPECIALE: Dopo aver acquistato Atomic Analyst, inviami un messaggio privato per ricevere Smart Universal EA GRATIS e trasformare i tuoi segnali Atomic Analyst in operazioni automatiche. Atomic Analyst è un indicatore di trading Price Action non-repainting
PipFinite Breakout EDGE
Karlo Wilson Vendiola
4.93 (488)
The Missing Edge You Need To Catch Breakouts Like A Pro. Follow a step-by-step system that detects the most powerful breakouts! Discover market patterns that generate massive rewards based on a proven and tested strategy. Unlock Your Serious Edge Important information here www.mql5.com/en/blogs/post/723208 The Reliable Expert Advisor Version Automate Breakout EDGE signals using "EA Breakout EDGE" Click Here Have access to the game changing strategy that will take your trading to the next l
Neo Wave PRO
Nikolay Raykov
5 (1)
Price & Time Market Structure Indicator A professional market structure tool that analyzes waves through both price and time — not price alone. Main Description NeoWave PRO is a professional market structure indicator for MetaTrader 4 designed for traders who want to move beyond traditional one-dimensional wave tools such as ZigZag, swing indicators, and basic high/low systems. Most wave indicators analyze only one thing: Price. But a real market wave is not only a price movement. A true wave de
Md Trend Pro
Muhammad Wasim
MD Trend Pro — 4-Stage Trend Confirmation Indicator MD Trend Pro stops you from either jumping in too early on noise, or missing the move altogether by waiting for "perfect" confirmation. It only prints a signal once three independent trend tools agree, in the correct order — and it tells you when that signal is backed by extra strength. Pleas Note| You must have Template File for Results. Download Tamplate How it works — the 4-stage chain Stage 1 — Hull MA turns / changes colour, establishing
All in One Trade
Alexey Minkov
4.52 (29)
All-in-One Trade Indicator (AOTI) automatically calculates daily target levels for 14 currency pairs and brings together technical analysis tools for any trading instrument in a single window: Double Channel for trend detection, Price Channel, MA Bands, Climax Bars detector, Fibonacci levels, support/resistance micro-levels, and arrow reversal signals. Works on the MetaTrader 4 platform. Daily levels are calculated for EURUSD, EURJPY, GBPUSD, USDCHF, EURGBP, EURCAD, EURAUD, AUDJPY, GBPAUD, GBPCA
Super Signal – Skyblade Edition Sistema professionale di segnali di tendenza senza repaint / senza ritardo con tasso di vincita eccezionale | Per MT4 / MT5 Funziona meglio su timeframe più bassi, come 1 minuto, 5 minuti e 15 minuti. Caratteristiche principali: Super Signal – Skyblade Edition è un sistema intelligente di segnali progettato specificamente per il trading di tendenza. Utilizza una logica di filtraggio multilivello per identificare esclusivamente i movimenti direzionali forti, supp
Altri dall’autore
L'indicatore calcola le aree di arresto/inversione di tendenza più probabili, le aree di movimento di tendenza sicure. Il calcolo considera: il tasso di variazione del prezzo; l'angolo di deviazione relativa del grafico; l'ampiezza media dei movimenti di prezzo; il prezzo che esce dalla sua "zona di comfort"; i valori dell'indicatore ATR. L'indicatore può generare un avviso quando il prezzo entra in un'area di stop/inversione. Impostazioni Disegna l'intera lunghezza? - disegnare le aree fino
Buy and sell zones
Evgeniy Zhdan
5 (2)
Indicator for determining flat and trend. If the price is below any of the two histograms and two lines (red and blue), this is a sell zone. When purchasing this version of the indicator, MT5 version for one real and one demo account - as a gift (to receive, write me a private message)! If the price is above any of the two histograms and two lines (red and blue), this is a buy zone. MT5 version:  https://www.mql5.com/en/market/product/70409 If the price is between two lines or in the zone of
SuperTrend
Evgeniy Zhdan
2.5 (2)
The Supertrend Expert Advisor The Supertrend Expert Advisor with averaging elements. It has been developed during three months until I finally got good results. It is not a scalper. The minimum balance to start trading - 100 $. Is automatically adjusted to the 4 and 5-digit prices. Has an efficient risk management system. The lot and limit on the maximum lot is automatically calculated based on the settings specified in the EA. As a result, you have a complete automated trading system. Download
Stardust
Evgeniy Zhdan
StarDust searches for divergences in the values of several indicators considering them as signs of flat and enters the market if a relatively steady trend is detected. The Expert Advisor trades "basic" symbols with a low spread. The best results are achieved on М15. The EA automatically adjusts to 4 and 5-digit quote flows. Settings Comment_to_orders – comment to a placed order. The field can be left blank if no comment is required. MM – enable money management with automatic setting of a worki
Top Floor
Evgeniy Zhdan
The EA catches the price when it moves against the trend in an effort to open an order in an opposite direction (direction of the main trend). Screenshots illustrate examples of entries and the strategy gist. The EA uses stop losses depending on values of ATR. Settings: Lot_ - if Risk_ = 0, the EA will trade this lot; Risk_ - risk per one trade. Stop loss is taken into account; koeff_ATR - coefficient multiplied by the ATR value to calculate stop loss (the bigger the value, the bigger stop loss
FastBoom
Evgeniy Zhdan
The FastBoom EA finds the most probable points of price pullback/reverse and places an order. It places averaging orders if the price moves further against take profit. Settings of the EA: Lots - initial lot; LotExponent - multiplier for following orders (Martingale). 1 - no multiplier. TakeProfit - take profit in points; Stochastic Settings InpKPeriod - K Period of Stochastic InpDPeriod - D Period of Stochastic InpSlowing - Stochastic Slowing LevHigh - level for sell positions of Stochastic L
The Expert Advisor calculates the double/triple divergence of volumes, and starts trading. It uses a unique formula of lot calculation, which greatly improves stability of trading. Recommended TF - 1h. Currency pair - EURUSD , but the EA can be used on any trading instruments which are not subject to high volatility. Settings mode - trading direction can be set manually; close - order close level (details on the screenshot); Step between orders - step between orders in points; Maximum orders -
OrderOnLine
Evgeniy Zhdan
The Expert Advisor opens orders from the horizontal line, the a trader can set on any level by dragging using the mouse or by changing the line properties. For example, when a horizontal line is above the current price, the EA will open a Buy order once the horizontal line is reached. And vice versa: If the line is below the current price, the EA will open a sell order once the line is crossed. A buy crossover of the line is: opening of the current candlestick below the horizontal line; the curr
SellerATR
Evgeniy Zhdan
5 (1)
The Expert Advisor only sells. Recommended currency pairs : EURUSD; GBPUSD; USDCHF; USDJPY; USDCAD; AUDUSD; EURGBP; EURAUD; EURCHF; EURJPY; GBPCHF; CADJPY; GBPJPY; AUDNZD; AUDCAD; AUDCHF; AUDJPY; CHFJPY; EURNZD; EURCAD; CADCHF; NZDJPY; NZDUSD. Timeframe: H1. Percent% manages closing both loss-making and profitable deals based on the account overall status. Using the EA on 23 symbols mentioned above allows the robot to cope with the drawdown in case of a long trend. While positions on some pairs
Illusion
Evgeniy Zhdan
3 (2)
The Illusion EA uses the probability theory - after a series of consecutive virtual losses - i.e. right during a flat the EA already starts trading in the trend. In addition, the EA considers the ratio of bullish/bearish candles on the higher timeframes to determine the greatest probability of the price movement direction. Only 1 order can be opened at a time. In case of a loss the following order will be placed with an increased lot (the multiplication coefficient is set in the parameters). The
The indicator plots a trend line and determines the levels for opening trades, in case the price goes "too far" away from the trend level. More detailed information is available in the screenshots. Settings Away from the trend line - distance from the trend line to the trades level; Arrow Signal for deals - enable displaying an arrow when the price reaches the trades level; Size of Arrow - size of the arrow; Alert Signal for deals - enable generating alerts when the price reaches the trades lev
Turbina
Evgeniy Zhdan
5 (4)
The axiom of the Forex market is that any trend will be broken. The Expert Advisor determines trend direction (the pink line), and calculates levels for opening opposite orders depending on the settings. The value of Away from the trend line for Deal will be different for each pair and timeframe, depending on the volatility of the trading instrument. Next orders can be opened with an increased lot (a static lot is used by default). See the screenshots to understand the idea of the Expert Advisor
Odysseus
Evgeniy Zhdan
The Expert Advisor determines the moments of strong movements and opens a position in the direction of the most probable price movement. The strategy always uses stop loss and take profit. Several independent orders can be in the market (the maximum number is set in parameters). The goal of the EA's underlying trading system is the quantitative excess of the number of profitable deals over the number of losing ones. Recommended: EURUSD 5m; GBPUSD 5m; USDJPY 5m. The Expert Advisor is able to work
Vise
Evgeniy Zhdan
Vise is a trend indicator. The upper and lower lines follow the price showing the prevailing price direction. Frequent breakthroughs of the upper line indicate a bullish trend, while frequent breakthroughs of the lower line indicate a bearish one. Parameters Points for UpLine - initial number of points for the upper line; Points for DownLine - initial number of points for the lower line. During the breakthrough of the upper level (line), this level shifts upwards by Points for UpLine. If the up
Twinkle
Evgeniy Zhdan
Twinkle is a trend-based scalper using stop loss and take profit invisible to the broker. The EA does not look for trend reversals. The EA catches strong market movements and opens orders in the direction of the trend. Your broker will not see the order closing levels. The EA closes orders independently when reaching the take profit or stop loss levels specified in the settings. Recommended trading symbols: EURUSD M5, GBPUSD M5. ECN accounts with 5 digits quotes are recommended. Expert Advisor
Shine
Evgeniy Zhdan
4.75 (4)
This Expert Advisor implements elements of the Martingale system. Orders are opened at a specified distance from the moving average. The Parabolic SAR indicator and certain technical details are used to ensure the most accurate entries. The EA is highly customizable. It is recommended for simultaneous use on 4 currency pairs: EURUSD M15; GBPUSD M15; USDJPY M15; USDCAD M15. Despite good stability, it is advisable to disable the EA operation during the days rich in news releases. Configurations P
LuckyCase
Evgeniy Zhdan
LuckyCase is an Expert Advisor with martingale elements. The EA strategy is based on a significant "deviation" of the price from SAR inadicator and the Bands levels breakthrough point. The money management system is an essential part of the EA. It starts working after a trade is opened. Trades are closed after accumulating specified points of market orders, by deposit % or after an opposite side of the channel is broken through. The default EA settings are meant for: EURUSD M15; USDJPY M15. The
Elize
Evgeniy Zhdan
The Elize Expert Advisor has been designed to work with the EURCHF currency pair. It considers the peculiarities of this trading instrument, its behavior and dependence on the behavior of other currencies. In particular, when the currencies of the European countries (EURUSD, GBPUSD, EURNOK, EURCHF) move in the same direction, the EA starts its operation and opens a deal in the trend direction of the European currencies. In the event of price rollbacks, the EA uses a unique method for making the
AllTrendLines
Evgeniy Zhdan
4 (1)
Brief Description of the All Trend Lines Indicator The indicator analyzes the wave structure of the market. What it displays on the chart: First. Wave pivots (semaphores) • Red markers – wave highs • Yellow markers – wave lows • Yellow-green markers – additional local extremes Second. Trend lines • Purple/blue lines – trends based on highs (resistance/support) • Beige/green lines – trends based on lows • Lines are built automatically by connecting wave pivots of the same type Third. Main trend
FastTraffic
Evgeniy Zhdan
The Expert Advisor has been specifically developed for trading gold (Spot Gold). The strategy is based on Fibo levels calculated from the previous (first) candle High/Low and the width of the current and lower timeframes channel. If important Fibo levels of different orders are located in a single price channel (within a spread), the EA defines this channel as the target for price movement and starts operation. Martingale and averaging are not used. Each order is independent and is accompanied b
Jazz
Evgeniy Zhdan
The algorithm of this Expert Advisor determines the significant price levels, where the trend often turns into a flat or reverses. Stochastic Oscillator serves as an additional filter of overbought/oversold zones. The EA sets stop loss and take profit after opening an order. The underlying trailing strategy applies a trailing stop. The EA is recommended for simultaneously use on three trading instruments: EURUSD M5, GBPUSD M5, EURCHF M5. Settings: Comment to order - comment to orders. MaxRisk -
Panther
Evgeniy Zhdan
The Expert Advisor looks for technical analysis patterns formed on the higher (hourly) timeframe to start working on the 5-minute chart. Technical analysis patterns used: double top/double bottom, head/shoulders, flag, expanding/narrowing triangles. The Relative Vigor Index technical indicator is used as the filter for opening deals. It is based on the idea that on the bull market the closing price is, as a rule, higher, than the opening price. It is the other way round on the bear market. This
Spook
Evgeniy Zhdan
The Expert Advisor calculates the divergence on the current and higher timeframes. In case the divergences coincide, the EA starts its operation. Deals have strict take profit and stop loss levels. Each deal is managed by trailing stop. The strategy involves the use of a tight stop-loss. Therefore, losing deals and/or series of losing deals are not uncommon. This EA is not suitable for those who have difficulties coping with losing deals. The EA is recommended for simultaneous use on the followi
Grand
Evgeniy Zhdan
The Expert Advisor has been developed specifically for the features of the CHFJPY currency pair. The EA's algorithm determines the direction of the current trend and starts operation. In case of a price reversal within the current trend, the EA adds additional orders. If trend changes, the EA starts to work in the direction contrary to the initial grid of orders. If there were no conditions for closing orders and the trend direction changed again, the EA continues to work with the "first" grid o
Intensive
Evgeniy Zhdan
The Expert Advisor algorithm determines on daily charts those candlestick patterns, which set the intraday trading direction. The trading EA determines how long the price is moving in overbought/oversold zones and starts working in the direction of the expected trend movement. Each position is accompanied with a tight stop loss and take profit. Only one active position can be open in the market. The EA was developed and tested using 99% quality quotes. The Expert Advisor has a built-in news filt
Slender
Evgeniy Zhdan
The strategy of this Expert Advisor is based on a hedging system, which implies placing opposite orders. The EA algorithm determines trend beginning and opens a position in the trend direction. In case of a wrong entry, the EA tries to neutralize the drawdown through opposite (hedging) orders at a preset interval (Coefficient of counter orders). Orders are closed when one of the two values ​​is reached - profit in percent or profit in points. The EA does not use lot increase. The EA wast tested
Dreamer
Evgeniy Zhdan
Советник работает по принципу хеджирования с периодическими "перекосами" в сторону трендовых направлений. Направления тренда советник определяет на основании стандартного индикатора Parabolic Stop and Reverse system (SAR). Уникальная стратегия установки балансирующих позиций позволяет избегать больших просадок даже при самых не благоприятных рыночных условиях. Параметры по умолчанию рекомендуется использовать на торговом инструменте: GBPJPY 15m. Разработка и оптимизация параметров производились
Snoot
Evgeniy Zhdan
5 (1)
This Expert Advisor works using a grid in the direction of a trend movement with the step between opened positions defined in the settings. The positions are closed by the total take profit. The Parabolic SAR standard indicator is used to filter order opening, which comes in the MetaTrader 4 package. The EA has been developed and tested using 99,9% quality of quotes. Operation of the EA in real time can be viewed in the signals . The best trading results have been achieved on CHFJPY M15. Settin
Solipsism
Evgeniy Zhdan
The Expert Advisor builds channels based on the data obtained using ATR and MA indicators according to the equations: Upper channel border = MA + ATR * (FIBO); Lower channel border = MA - ATR * (FIBO), where FIBO has the following values: Style of Trade - Aggressive = 1.61852; Style of Trade - Average = 3.26704; Style of Trade - Calm = 4.85556. Trades are opened inside the channel with the intervals defined in the settings. Long and short positions are opened independently. Positions are closed
The trading statistics indicator notifies the trader of the aggregate income of the trading account for different time intervals. The indicator has wide display settings on the graph. There is a choice of one of the two display languages on the chart- English and Russian. Settings Indicator language (ENG, RUS) - Select the language to display on the chart; To control the magic (-1: any magic) - Entering the Magic for control (-1: any Magic); Angle of indicator tie - Selecting the angle of the c
Filtro:
Nessuna recensione
Rispondi alla recensione