Elder Force Zones

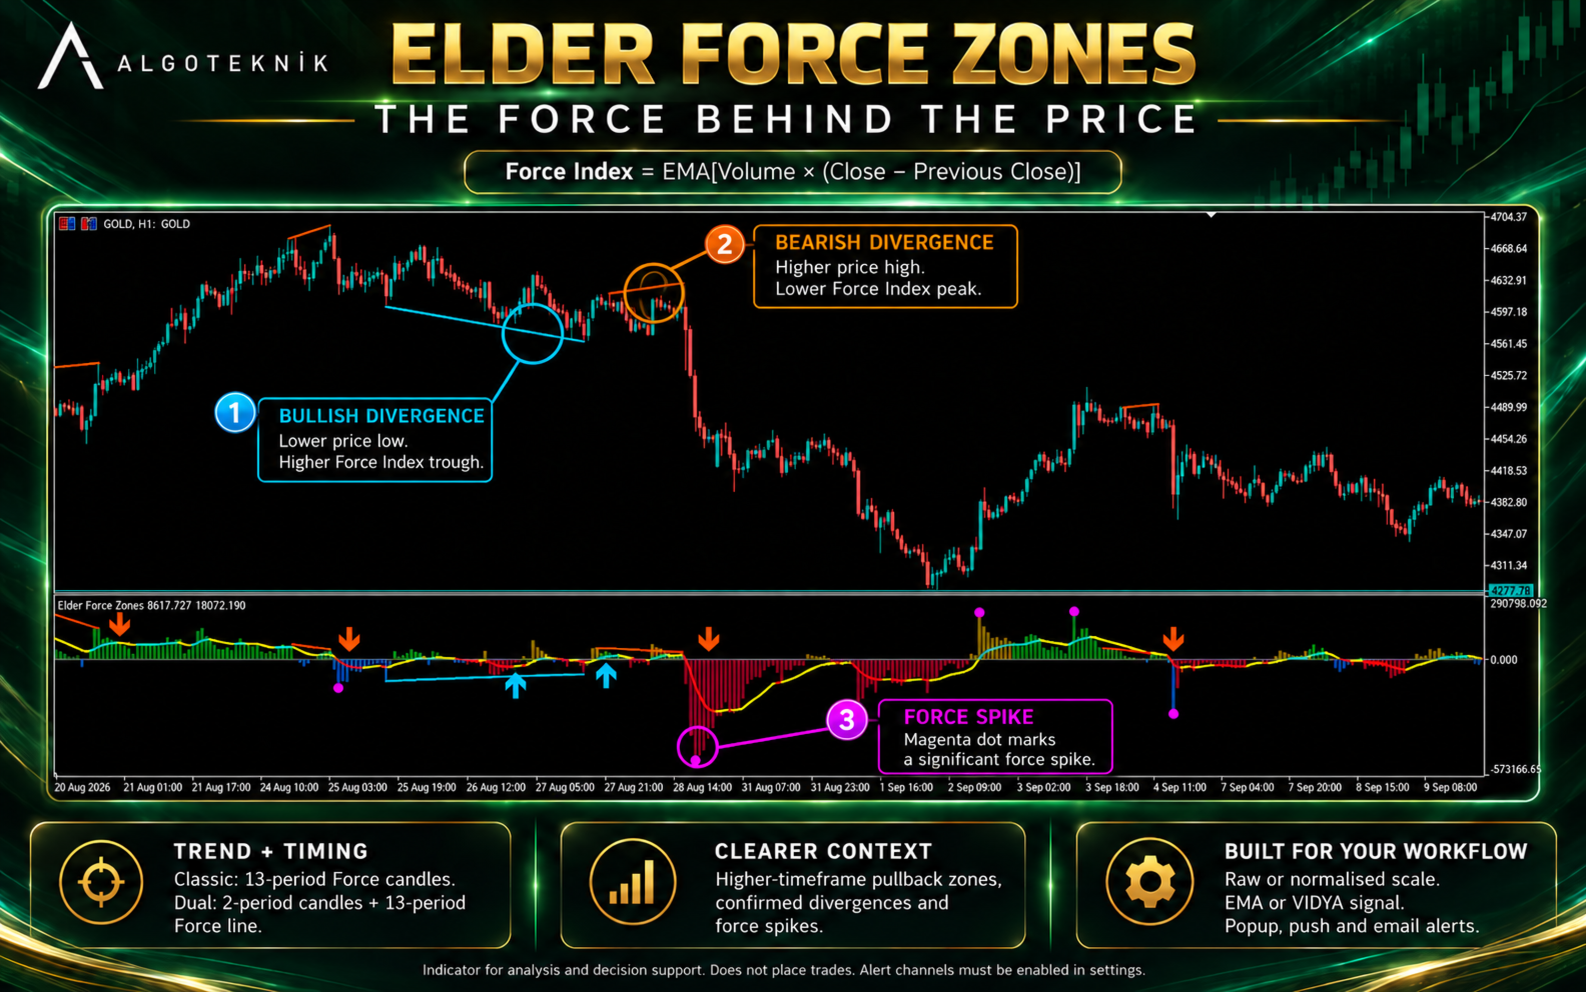
MetaTrader's built-in Force Index is not the formula Dr. Alexander Elder published. It multiplies the volume of a bar by the change of a 13-bar moving average of price. Elder defined the force of a bar as its volume times the change of its close, and smoothed that with an exponential moving average. Measured on gold over the last year, the two disagree about which side of zero the market is on roughly one bar in six (M15, H1 and H4).

Elder Force Zones computes Elder's own definition and builds his way of working around it: the 13-bar Force Index for the trend of force, the 2-bar Force Index for timing in the Dual view, and the buy and sell zones it is named after, pullbacks judged against the trend of the next higher timeframe (the Triple Screen). On top of that it marks force spikes and divergences on closed bars and can alert on them.

Release notes, chart examples and new product announcements are posted on the TrendTower channel: https://www.mql5.com/en/channels/trendtower

What you see

In the default Classic view the candles are the 13-bar Force Index: who has been in control, and how hard. The thick line over them is the signal line, an EMA or VIDYA of the 13-bar Force Index; a crossing of the two marks a turn. The Dual view adds Elder's pair: the candles become the 2-bar Force Index, who pushed hardest in the last bar or two, and the 13-bar Force Index is drawn as a line of its own, with the signal line under it.

Line colours offers three looks. The default is a traffic light. Green: the line rises, or runs above its signal, with buyers in control, at or above zero. Red: it falls, or runs below its signal, with sellers in control, at or below zero. Both confirm the side in control. Yellow: the two disagree, rising while still below zero or falling while still above it, a caution that the force is heading back toward zero. In the Classic view the signal line carries the colour (for an EMA or VIDYA the Force Index above the signal is the signal rising); in the Dual view the Force Index line carries it, judged against its signal line, and the signal line is silver. The colour changes on the very bar of a crossing. Measured on gold, EURUSD and the Nasdaq (M15 to H4), yellow covers 50 to 60 % of the Classic signal line's bars and 30 to 44 % of the Dual Force Index line's: a line swinging around zero spends about half its time heading back to it. Colour by slope, signal gap widened: the Dual Force Index line follows the same traffic light by its own slope, grey while flat, and the dotted silver signal line is drawn with its distance to the Force Index widened 2.5 times, so a crossing stays on its bar but the drawn signal line no longer sits at its own value and can appear on the other side of zero. One colour each: a gold Force Index line and a silver signal line. The numbers at the top of the window and in the Data Window always show the signal line's own value.

The zero line is a solid line in the colour set on the Inputs tab; None hides it.

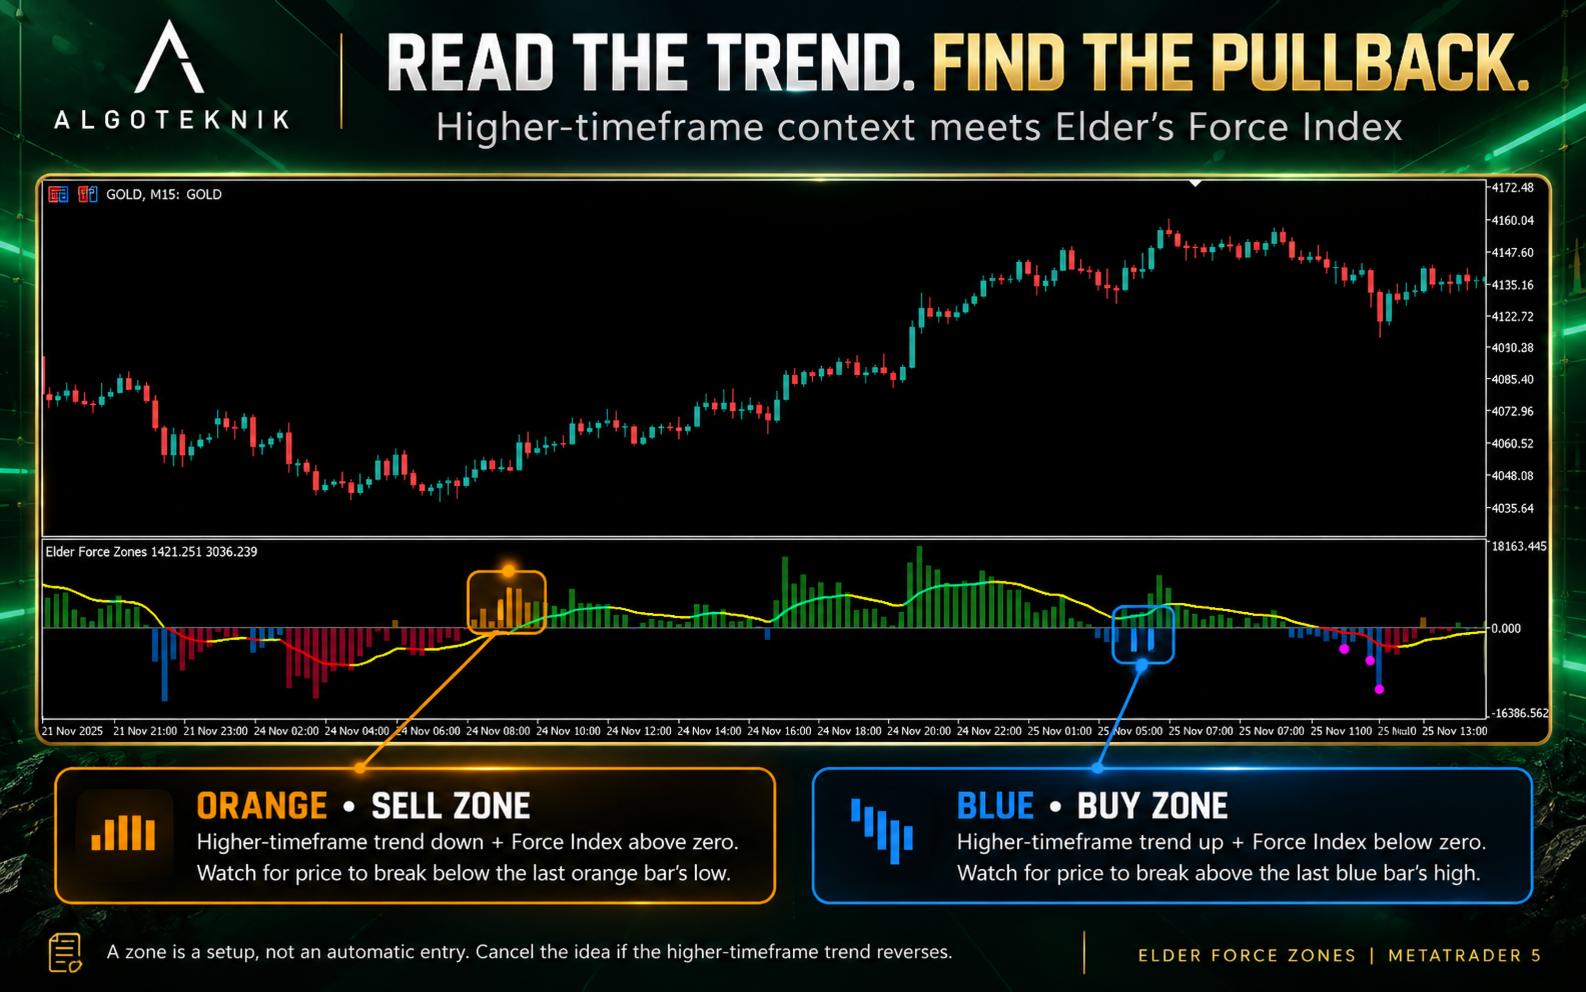
Each bar is a candle body drawn from zero to the Force Index value, so it widens and narrows with the chart zoom exactly like the price candles above it. The candles are green above zero and red below it. With the trend colouring on, two more colours mark the bars that matter most in Elder's method: blue for a buy zone and orange for a sell zone. The next section explains what to do with them.

MetaTrader draws indicator colours without transparency, so the candle colours are mixed toward the chart background instead. At the default Candle opacity of 55 %, measured on a black chart against the brightest candle (orange), green keeps 4.3 to 1 contrast, yellow 5.4, gold 4.2 and silver 3.2. Solid red keeps 1.45 against orange and 2.8 against the red candles it mostly runs over below zero; the slope look's green keeps 2.75 and its flat grey 1.06. Lower the opacity for stronger lines, raise it for stronger candles. The four candle colours are set on the Inputs tab.

The bar that is still forming is drawn live and changes with every tick until it closes. Markers and alerts wait for the close, so a marker that has appeared never moves or disappears.

The numbers after the name at the top of the indicator window are, in order: the Force Index line (Dual view only), the signal line and the candle's value. A switched-off signal line leaves out its number.

Reading the colours: buy zones and sell zones

Blue is a buy zone and orange is a sell zone. A bar turns blue when the trend on the higher timeframe is up and the candle has dipped below zero: sellers are briefly in control inside an uptrend, which is a pullback. A bar turns orange in the mirror case, a rally inside a downtrend. These are the bars Elder trades, not the ones he avoids: the higher timeframe tells you which way to trade, and the pullback offers a better price in that direction.

A colour is not an entry on its own. A pullback can deepen, and several blue bars in a row are common. Elder's entry waits for the market to turn: a buy stop just above the high of the last blue bar, lowered to the high of each new blue bar while the pullback lasts, so a position opens only once price moves back in the direction of the trend. If the higher timeframe turns down first, the idea is dropped. Orange works the same way downwards: a sell stop just below the low of the last orange bar.

Green bars in an uptrend and red bars in a downtrend show the trend pushing; Elder does not chase them. Selling on blue or buying on orange would trade against the higher timeframe and is not part of the method. With the trend colouring switched off the candles are only green and red and mark no zones.

The indicator shows where the method looks for trades. It does not place trades, and it does not claim that the method is profitable on any market.

The trend, from the timeframe above

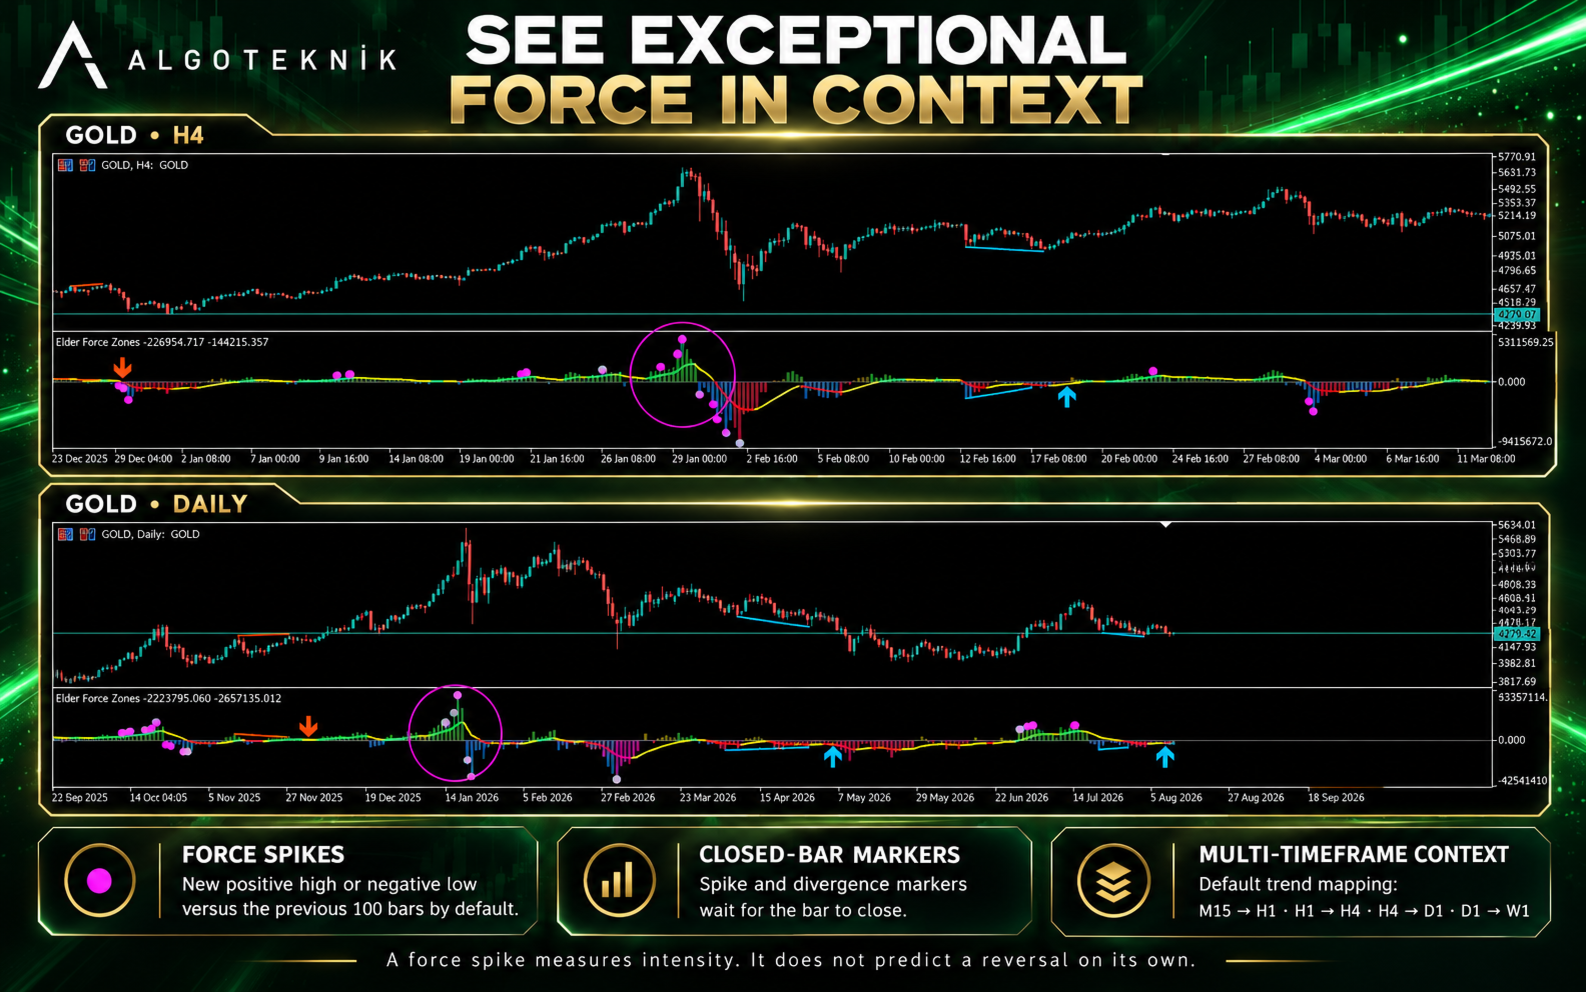
Elder's Triple Screen reads the trend on a timeframe about five times longer than the one you trade and takes entries against short-term moves in that direction. By default the indicator does the same: on M15 the trend comes from H1, on H1 from H4, on H4 from D1 and on D1 from W1. The trend is the slope of a 13-period EMA of closes on that timeframe.

Each bar takes the trend of the last higher-timeframe bar that had already closed when the bar opened. The colour of a bar therefore never changes while it forms, and history shows exactly what was known at the time. While the higher timeframe's history is still loading the colours stay plain, the journal says so, and the history is recoloured once it arrives.

The first bar of a buy or sell zone can raise an alert. With the trend from the next higher timeframe a zone starts on one bar in 11 to 17 in the Classic view and one in five to seven in the Dual view, whose 2-bar Force Index changes sign often (measured on gold, EURUSD and the Nasdaq, M5 to H4). That suits the chart but is frequent for an alert, so this alert is off by default.

Force spikes

A spike is a closed bar whose candle goes beyond every candle of the previous 100 bars: a new high above zero or a new low below zero, compared on the raw values so that both scales mark the same bars. It shows where buying or selling was at its most intense; on its own it does not predict a reversal. Because the test is a rank and not a fixed number, it behaves the same on every market: on gold, EURUSD and the Nasdaq about three bars in a hundred were marked on M15, H1 and H4 in the Classic view and four to five on M5; the Dual view's 2-bar candles mark about two in a hundred, three on M5.

Divergences

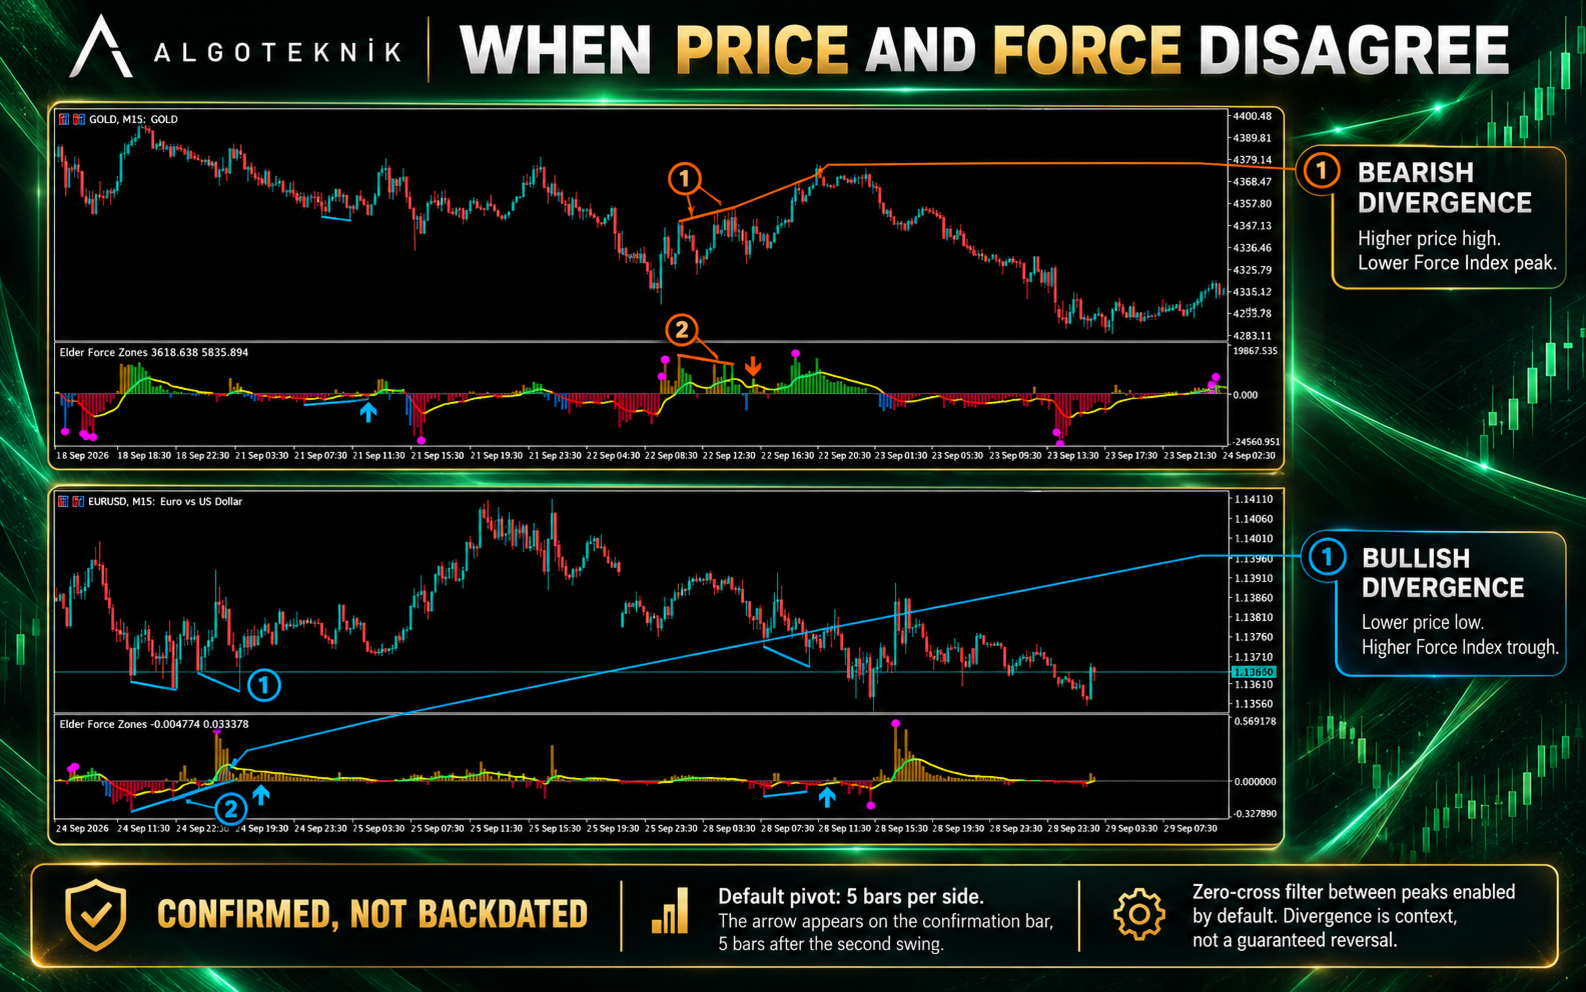
A bearish divergence is a higher swing high in price with a lower peak of the 13-bar Force Index; a bullish one is a lower swing low with a higher trough. A swing high needs five lower highs on its left and no higher high among the five bars on its right, so a divergence is known five bars after its second swing. The arrow sits on that confirming bar, not earlier, and two thick lines connect the price swings and the Force Index extremes. The arrows are large and drawn clear of the bar's candle and lines, above it for a bearish divergence and below it for a bullish one, so they stand on the background. Their two colours are set on the Inputs tab.

By default the Force Index must also cross zero between the two peaks, the condition Elder applies to his oscillator divergences: the bulls' or bears' back has to be broken. It halves the number of signals, measured at 7 to 11 per 1000 bars instead of 16 to 22.

Raw or normalised numbers

Raw values are volume times price change, the numbers Elder used. Their size depends on the symbol and drifts with activity: on gold the typical H1 value grew about ten times in three years, and EURUSD and the Nasdaq differ by five orders of magnitude. The normalised scale divides by the average volume and the average true range of the previous 100 bars, so 1.0 means an average-volume bar moving one average range, on any symbol and in any year. Colours, markers and alerts are identical in both scales; only the numbers on the axis change.

Alerts

Alerts can be sent as a popup, a push notification and an e-mail, each switched on separately. They come once per closed bar and never for a bar that closed before the indicator was attached, so attaching it or restarting the terminal does not replay old signals. Divergence alerts are preselected; the channels are all off until you choose one.

Things that work without a setting

Every line appears only once it no longer depends on how much history the chart holds. An exponential average remembers its starting point, and a chart with 5000 bars would otherwise show different values from one with 100000. The indicator waits until that memory is below one part in a billion: about 150 bars after the first bar on the chart for the 13-bar Force Index, about 280 for the EMA signal line, and 600 to 2900 for a VIDYA signal line. After that the same bar shows the same value on every chart and after every restart.

Most CFD and forex symbols report no real volume. When real volume is selected and the last 100 bars carry none, the indicator uses tick volume instead of drawing a flat line, writes that in the journal and in its name on the chart.

The normalised scale uses the bars before the current one, so it does not move while a bar forms.

The newest 100 divergences keep their arrows and lines. If another copy of the indicator on the same chart removes them, they are redrawn within a second.

Hovering over a divergence arrow or line shows its sentence and nothing else. Over the candles, the lines and a spike MetaTrader adds the indicator's name and the bar's time, and ends the row with the value: the number after the label is that candle's or line's Force Index. The Data Window lists the values under the same short names.

A chart or template saved with an older version can restore the indicator with fewer lines than it has; the missing ones cannot be drawn and their settings seem to do nothing. The indicator notices this and says so in orange in its own window. Remove it from the chart, add it again, and save your templates again.

For Expert Advisors

Buffers 0 to 3 are the candle (open 0, high, low, and close, which is the Force Index value) and buffer 4 its colour index (0 green, 1 red, 2 blue buy zone, 3 orange sell zone). Buffer 5 is the signal line as drawn and buffer 6 its colour index; buffer 7 is the Force Index line of the Dual view and buffer 8 its colour index. Both colour indexes read 0 green (above the signal or rising, at or above zero), 1 red (below or falling, at or below zero), 2 one colour or flat, 3 yellow (the direction against the line's side of zero). Buffer 9 is the spike marker, buffers 10 and 11 the bullish and bearish divergences (the Force Index at the confirming bar; not drawn, the arrows are chart objects), buffer 12 the Force Index line's value, buffer 13 the signal line's own value and buffer 14 the candles' value on its own. Read the signal from buffer 13: with slope colours buffer 5 is widened for the eye. Where nothing is drawn a buffer holds EMPTY_VALUE. Shift 0 is the bar that is still forming; markers exist only on closed bars, so read shift 1. When you pass inputs to iCustom, each input group heading counts as one parameter: give a string for the heading, then the values that follow it.

Settings reference

Every setting below is written exactly as it appears on the Inputs tab, in the same order, with its default.

1. FORCE INDEX

Display mode — default: Classic: Force Index as candles
Classic: the Force Index as the candles. Dual: the short Force Index as the candles and the Force Index as a line, Elder's pair. The signal line is drawn in both.

Force Index period (Elder: 13) — default: 13
EMA period of the Force Index; 13 is Elder's value for the trend of force. The line in Dual, the candles in Classic. 1 to 500.

Short Force Index period, Dual mode (Elder: 2) — default: 2
EMA period of the short Force Index in Dual mode; 2 is Elder's value for timing. Smaller than the Force Index period, 1 to 50.

Volume — default: Tick volume
Tick volume or real volume. Without real volume on the symbol, tick volume is used and the name on the chart says so.

Scale — default: Raw: volume x price change
Raw: volume times price change. Normalised: 1.0 is an average-volume bar moving one average range. Colours, markers and alerts are the same in both.

Normalised scale: average over this many bars — default: 100
Bars averaged for the normalised scale, not counting the current bar. 5 to 1000.

Draw the forming bar live — default: true
On: the forming bar is drawn and changes with every tick. Off: a bar appears when it closes. Markers and alerts always wait for the close.

2. CANDLES

Candle colour: buyers in control (above zero) — default: LimeGreen
Candles above zero when no zone applies.

Candle colour: sellers in control (below zero) — default: Crimson
Candles below zero when no zone applies.

Candle colour: buy zone (pullback in an uptrend) — default: DodgerBlue
Candles below zero while the higher timeframe rises.

Candle colour: sell zone (rally in a downtrend) — default: Orange
Candles above zero while the higher timeframe falls.

Candle opacity, % (lower lets the lines stand out) — default: 55
How strongly the candle colours show, mixed toward the chart background. 55 keeps the lines readable on a black chart. 10 to 100.

3. LINES

Line colours — default: Traffic light: crossings, yellow against zero
Traffic light: green rising above zero, red falling below zero, yellow when the direction is against the line's side of zero; the Classic signal line or the Dual Force Index line carries it. Slope: the same by the line's own slope, grey flat, with the dotted signal line's distance widened 2.5 times. One colour: gold line, silver signal line.

Zero line colour (None hides it) — default: DimGray
Colour of the solid zero line; None hides it.

4. SIGNAL LINE

Signal line method — default: EMA (Exponential Moving Average)
EMA or VIDYA of the Force Index, drawn as the thin signal line in both views; none hides it. On the Force Index a VIDYA runs much slower than its period suggests: VIDYA 13 behaves like an EMA of about 75 bars in the median.

Signal line period (VIDYA: up to 20) — default: 13
EMA 1 to 500, VIDYA 1 to 20: a longer VIDYA forgets its start so slowly that its line would depend on how much history the chart holds.

5. TRIPLE SCREEN TREND

Colour buy and sell zones (pullbacks within the trend) — default: true
Blue marks a buy zone (below zero while the higher timeframe rises), orange a sell zone (above zero while it falls). Off: only green above zero and red below.

Trend timeframe — default: Next higher timeframe (Elder: about x5)
Next higher: M15 to H1, H1 to H4, H4 to D1, D1 to W1 and so on. A timeframe that is not above the chart's uses the chart's own.

Trend EMA period, on closes — default: 13
EMA of closes on the trend timeframe; up while it rises, down while it falls. 2 to 500.

6. FORCE SPIKES

Mark force spikes — default: true
Marks a closed bar whose candle is a new high above zero or a new low below zero compared with the spike window.

Spike: new high or low of the candles over this many bars — default: 100
Bars a spike is measured against; 100 marks about three bars in a hundred in the Classic view. 10 to 1000.

7. DIVERGENCE

Mark divergences — default: true
Arrows on the bar that confirms a divergence between price swings and the Force Index.

Pivot: bars on each side — default: 5
A swing needs this many bars on each side, so a divergence is known this many bars after its second swing. 1 to 20.

Max bars between the two pivots — default: 60
The two swings are at most this many bars apart; more than twice the pivot bars, at most 500.

Force Index must cross zero between the peaks (Elder) — default: true
The Force Index must cross zero between the two peaks. Halves the number of divergences.

Draw divergence lines — default: true
Two lines per divergence, on price and on the indicator. The newest 100 are kept.

Divergence colour: bullish — default: DeepSkyBlue
Arrow and lines of a bullish divergence.

Divergence colour: bearish — default: OrangeRed
Arrow and lines of a bearish divergence.

8. ALERTS (ON CLOSED BARS)

Alert when a buy or sell zone starts — default: false
The first bar of a buy zone or a sell zone.

Alert on a divergence — default: true
A divergence is confirmed.

Alert on a force spike — default: false
A force spike on a closed bar.

Alert when the Force Index crosses zero — default: false
The Force Index crosses zero.

Alert when the Force Index crosses the signal line — default: false
The Force Index crosses its signal line.

Popup — default: false
Alert window in the terminal.

Push notification — default: false
Push notification to the phone set in Tools > Options > Notifications.

E-mail — default: false
E-mail through the account set in Tools > Options > Email.

Version history

1.0: first release.

About the author

Published by algoteknik. Other products and contact details are on the seller profile: https://www.mql5.com/en/users/bugraky123

Questions, bug reports and feature requests are welcome on the TrendTower channel: https://www.mql5.com/en/channels/trendtower

This is an indicator for analysis and decision support. It does not place trades. Always test thoroughly before using any tool in live trading. Trading involves risk.

algoteknik

Support, updates and every other product: mql5.com/en/users/bugraky123
Product channel: mql5.com/en/channels/trendtower

Elder Force Zones version 1.0

Produits recommandés
OmniSignal Navigator – Scalping intelligent aux niveaux clés Tradez comme un professionnel avec cet indicateur quotidien/hebdomadaire High-Low-Close, conçu pour le scalping et le trading de cassures de précision. Pourquoi ça marche ? Idéal pour le scalping : cible les zones clés (PDH/PDL/PDC et PWH/PWL/PWC) sur les unités de temps M2, M3, M5 et M15. (Unités de temps courtes = plus de signaux, unités de temps longues = moins de signaux) Aucune analyse graphique nécessaire : attendez s
FREE
Ultimate MACD MTF Pro est une version puissante et améliorée du MACD classique — repensée pour le trading moderne. Cet indicateur vous offre un MACD Multi-Timeframe (MTF), des couleurs d'histogramme dynamiques, des marqueurs de croisement de signaux et des changements intelligents de couleur de ligne basés sur le momentum. Conçu pour les traders qui veulent des signaux propres, une détection précoce des tendances et une clarté visuelle de qualité professionnelle. Caractéristiques Clés MACD
FREE
VFI Quantum
Nikita Berdnikov
5 (1)
Introducing VFI (Volume Flow Indicator) – a trading indicator that analyzes the relationship between volume and price movement to identify key trading opportunities. The indicator displays the strength and direction of volume flow, providing clear signals about potential entry and exit points. Signals are formed based on zero line crossovers, crossovers between the VFI line and its exponential moving average (EMA), and when the indicator exits overbought and oversold zones. Attention! This stra
FREE
-- Simple mais efficace. Indicateur d'inversion - Qu'est-ce que c'est ? Un indicateur superposé qui suit les tendances et combine la logique SuperTrend avec la technologie des courbes exponentielles. Il détecte la direction de la tendance, trace un canal dynamique sur le graphique et envoie des alertes en temps réel lorsque la tendance s'inverse. Comment fonctionne-t-il ? L'indicateur calcule une ligne de base exponentielle à l'aide de l'ATR et d'un facteur SuperTrend. Lorsque le prix clôture
FREE
RSI abcd
Francisco Gomes Da Silva
3.75 (4)
Détecteur de Motif ABCD RSI : Stratégie Technique 1. Fonctionnement de l'Indicateur Combine le RSI classique avec la détection automatique de motifs harmoniques ABCD . Composants Clés RSI standard (période ajustable) Marqueurs de sommets et creux (flèches) Motifs ABCD (lignes vertes/rouges) Filtres de surachat (70) et survente (30) 2. Configuration sur MT5 period = 14 ; // Période RSI size = 4 ; // Taille maximale du motif OverBought = 70 ; // Niveau de surachat OverSold = 30 ; // Niveau de surv
FREE
Quantora Order Blocks MT5 Quantora Order Blocks MT5 is a MetaTrader 5 indicator that identifies bullish and bearish Order Block zones using market structure and price-action conditions. The indicator monitors detected zones and tracks their status as market conditions develop. It provides a chart-based overview of areas associated with previous structural price movements. Order Block Detection Bullish and bearish Order Block detection Fresh Order Block identification Mitigation tracking Breaker
FREE
Stackable VWAP
Flavio Javier Jarabeck
3.5 (4)
Volume Weighted Average Price (VWAP) is a trading benchmark commonly used by Big Players that gives the average price a Symbol has traded throughout the day. It is based on both Volume and price. Additionally we put in this indicator the MVWAP (Moving Volume Weighted Average Price). For those who do not know the usage and the importance od this indicator I recommend a great article about this subject at Investopedia ( https://www.investopedia.com/articles/trading/11/trading-with-vwap-mvwap.asp
FREE
Weis Waves est un indicateur technique développé par David Weis, inspiré des principes de Richard Wyckoff. Contrairement au volume traditionnel, affiché barre par barre, Weis Waves cumule le volume en “vagues” haussières ou baissières, redémarrant le comptage dès que la direction du prix change. Cette approche permet aux traders de visualiser clairement la véritable force des mouvements du marché , car chaque vague reflète l’intensité du volume derrière une série de bougies. Caractéristiques
FREE
RSI back arrows
Smaylle Rafael Coelho Mariano
L'indicateur   Flèches de Retour RSI   est un outil puissant conçu pour les traders qui s'appuient sur l'Indice de Force Relative (RSI) afin d'identifier les éventuelles retournements de marché. Cet indicateur met en évidence lorsque le RSI sort des zones   suracheté   ou   survendu , fournissant des signaux visuels clairs pour orienter les décisions de trading. Caractéristiques Principales : Indices Visuels   : L'indicateur marque des flèches sur le graphique lorsque le RSI revient dans une zon
FREE
Value Chart Candlesticks
Flavio Javier Jarabeck
4.57 (14)
The idea of a Value Chart indicator was presented in the very good book I read back in 2020 , " Dynamic Trading Indicators: Winning with Value Charts and Price Action Profile ", from the authors Mark Helweg and David Stendahl. The idea is simple and the result is pure genius: Present candlestick Price analysis in a detrended way! HOW TO READ THIS INDICATOR Look for Overbought and Oversold levels. Of course, you will need to test the settings a lot to find the "correct" one for your approach. It
FREE
Quantora Market Structure MT5 is a MetaTrader 5 indicator that identifies confirmed swing points and displays market structure events on the chart. The indicator classifies detected swing points as Higher High, Higher Low, Lower High or Lower Low. It also marks Break of Structure and Change of Character events according to its detection conditions. Market Structure Analysis Higher High and Higher Low detection Lower High and Lower Low detection Bullish and bearish Break of Structure events Chan
FREE
Necessary for traders: tools and indicators Waves automatically calculate indicators, channel trend trading Perfect trend-wave automatic calculation channel calculation , MT4 Perfect trend-wave automatic calculation channel calculation , MT5 Local Trading copying Easy And Fast Copy , MT4 Easy And Fast Copy , MT5 Local Trading copying For DEMO Easy And Fast Copy , MT4 DEMO Easy And Fast Copy , MT5 DEMO The homeopathic indicator is also called the CCI indicator. The CCI indicator was proposed
FREE
IMA Finder MT5
Mubashir Mohamed Quraish Albarakat
1 (1)
This indicator is designed based on the Moving Origin indicator When the moving origin indicator breaks the price, this indicator gives a signal It is useful for better viewing of signals and analysis on them Attributes: Can be used in all symbols Can be used in all time frames Too many signals Simple and quick settings Easy way to work Settings: period: like moving average settings alarmShow: If you want to receive an alert in Metatrader after receiving the signal, enable this setting alarmS
FREE
Supports And Resistances Lines
Francisco Gomes Da Silva
4.66 (47)
Indicateur MT5 des zones de support et de résistance cet indicateur sait identifier automatiquement les hauts et les bas. Cet indicateur de support et de résistance crée des lignes de support et des lignes de résistance basées sur les hauts et les bas. comment créer des lignes de support et de résistance. il s'agit d'un indicateur pour créer des lignes de support et de résistance automatiques. comment trouver le niveau d'assistance avec indicateur. cet indicateur trouve automatiquement les hauts
FREE
The indicator highlights the points that a professional trader sees in ordinary indicators. VisualVol visually displays different volatility indicators on a single scale and a common align. Highlights the excess of volume indicators in color. At the same time, Tick and Real Volume, Actual range, ATR, candle size and return (open-close difference) can be displayed. Thanks to VisualVol, you will see the market periods and the right time for different trading operations. This version is intended f
FREE
Follow The Line MT5
Oliver Gideon Amofa Appiah
4.6 (35)
This indicator obeys the popular maxim that: "THE TREND IS YOUR FRIEND" It paints a GREEN line for BUY and also paints a RED line for SELL. (you can change the colors). It gives alarms and alerts of all kinds. IT DOES NOT REPAINT and can be used for all currency pairs and timeframes. Yes, as easy and simple as that. Even a newbie can use it to make great and reliable trades. NB: For best results, get my other premium indicators for more powerful and reliable signals. Get them here: https://www.m
FREE
Best SAR MT5
Ashkan Hazegh Nikrou
4.33 (3)
La description :  nous sommes heureux de vous présenter notre nouvel indicateur gratuit basé sur l'un des indicateurs professionnels et populaires du marché des changes (PSAR). Cet indicateur est une nouvelle modification de l'indicateur SAR parabolique original. Dans l'indicateur pro SAR, vous pouvez voir un croisement entre les points et le graphique des prix. le croisement n'est pas un signal mais parle du potentiel de fin de mouvement, vous pouvez commencer à acheter par un nouveau point b
FREE
SynapticTrendline — Automatic Trendlines with Touch and Break Statistics Overview SynapticTrendline is a chart-window indicator for MetaTrader 5. It automatically detects and draws support and resistance trendlines, then tracks how price interacts with them: touches, held or failed touches, breakouts, follow-through or failure, and retests. Selected candles can be colored, and a compact panel summarizes the current statistics. This indicator is designed as an analysis and education tool. It does
FREE
(Special New Year promotion - free price!) The indicator displays the actual 'Scale in points per bar' (identical to the manual setting in the Terminal, see screenshot) in the upper right corner of the chart. The displayed value changes INSTANTLY whenever the chart scale is changed! (This is very convenient when planning screenshots). In Settings: Change language (Russian/English), font size of the displayed text, text label offset coefficient from the graph corner, equally in X and Y directi
FREE
Daily High Low Danilo Monteiro
Danilo Hudson Couto Monteiro
4 (2)
# Indicador Daily High - Danilo Monteiro - MT5 ## Descrição O Daily High/Low Labels é um indicador personalizado para MetaTrader 5 que exibe automaticamente as máximas e mínimas diárias no gráfico, facilitando a identificação rápida dos níveis importantes de preço. O indicador marca os preços com etiquetas e linhas horizontais, permitindo uma visualização clara dos níveis críticos do dia atual e anterior. ## Principais Características ### 1. Marcação Automática - Exibe automaticamente as máxi
FREE
DONCHIAN CHANNEL DC Il s'agit d'un indicateur de tendance développé par “Richard Donchian”, composé de 3 couches, le canal supérieur, le canal inférieur et le canal intermédiaire. Il est créé sur le canal Donchian en traçant les prix les plus élevés et les plus bas atteints au cours de la période précédente sur le graphique des prix. Il est également utilisé pour mesurer la volatilité du marché, car il s'agit d'un canal d'expansion/contraction en fonction de l'augmentation/diminution de la volat
FREE
Coral Indi
Dinh Duong Luong
Coral trend is   a trend-following indicator that is widely popular among FOREX traders . It is usually used as a confluence with other indicators. It uses combinations of moving averages with complex smoothing formulas! It has two configurable parameters: Coefficient   - smoothing ratio (*) Applied price Calculation: Coral = (-0.064) * B6 + 0.672 * B5 - 2.352 * B4 + 2.744 * B3
FREE
Fimathe PCM Indicador
Cristiano Rodrigo Olegini
5 (4)
Velas Forex FIMATHE PCM Indicator (GRATUIT) Le Velas Forex FIMATHE PCM Indicator est un indicateur gratuit conçu pour aider les traders à analyser les marchés de manière simple, rapide et efficace. Son objectif est de faciliter l'identification des conditions du marché grâce à des signaux visuels clairs, permettant ainsi aux traders de prendre des décisions de trading avec davantage de confiance. Meilleur résultat pour XAUUSD : Unité de temps : 5M Heure du serveur MT5 : 02:00 Gestion des risque
FREE
STM Signal MT5
Aren Davidian
5 (1)
Introducing the Professional Arka STM Signal Indicator With Arka Candle Close Time – 100% Free Version Fast, Accurate, and Unmatched in Identifying Trading Opportunities This indicator is the result of combining advanced price action analysis with specialized market algorithms, delivering clear, timely, and profitable signals. Completely Free – No Installation or Usage Limits ️ An automated trading bot, fully synchronized with it, is also ready to run. The Power of ARKA STM Signa
FREE
VWAP Bands trace le prix moyen pondéré par le volume à partir de l'ancrage de votre choix, avec jusqu'à trois bandes d'écart-type et un second VWAP pour le contexte. Gratuit, sans aucune limite. VWAP ancré Ancrage : jour, semaine, mois, année ou date et heure fixes Heure de début de période configurable (heure du serveur) : par exemple 00:00, ou 17:00 clôture de New York pour le forex, où une session qui commence le soir compte comme la journée de trading suivante Prix : typique, clôture, (high+
FREE
MIDAS Super VWAP
Flavio Javier Jarabeck
4.27 (11)
Imagine VWAP, MVWAP and MIDAS in one place... Well, you found it! Now you can track the movement of Big Players in various ways, as they in general pursue the benchmarks related to this measuring, gauging if they had good execution or poor execution on their orders. Traders and analysts use the VWAP to eliminate the noise that occurs throughout the day, so they can measure what prices buyers and sellers are really trading. VWAP gives traders insight into how a stock trades for that day and deter
FREE
Moving line
Jun Chao Jiang
The one minute chart has a bug, but the one-day chart can still be used after deleting the bug and reloading the indicators, This indicator can be used to determine how far the indicator goes up to place an order to buy, how far it goes down to place an order to sell, and not placing an order until it reaches this distance, which is considered oscillation, open an account gift index
FREE
Market Shift and FVG MT5
Cruz Molina William Alberto
Market Structure Shift with FVG Indicator for MT5 This MT5 indicator from the   apexfintech.net   suite identifies market structure shifts and fair value gaps (FVGs) to provide traders with potential trading opportunities. It alerts users on these events via mobile notifications, enabling them to react quickly to changing market conditions. Key Features: Market Structure Shift Detection:   Identifies bullish and bearish market structure shifts based on swing high/low breaks and significant candl
FREE
L'indicateur montre des niveaux ronds sur le graphique. Ils sont également appelés niveaux psychologiques, niveaux de banque ou niveaux des principaux acteurs. À ces niveaux, il y a une véritable lutte entre les haussiers et les baissiers, une accumulation de nombreux ordres, ce qui entraîne une volatilité accrue. L'indicateur s'adapte automatiquement à tout instrument et à toute période. Si le niveau 80 est cassé puis testé, il faut acheter. Si le niveau 20 est cassé puis testé, vendre. L'obje
FREE
Market Session Visual
Kambiz Shahriarynasab
5 (8)
The  Market Sessions Indicator for MT5 helps you  predict market turnarounds  by detecting major supply and demand areas. These pivot points tend to occur after a new session has started and the previous one is still open. It is also used to gauge how many points or pips the market moves on average during a session. This helps us to place better our take profits and stop losses. The indicator works on all forex pairs, gold, silver, commodities, stocks, indices and any other instrument that you
FREE
Les acheteurs de ce produit ont également acheté
Trend Sniper X
Sarvarbek Abduvoxobov
4.86 (44)
Trend Sniper X est un indicateur de suivi de tendance multi-unités de temps pour MetaTrader 5 qui aide les traders à identifier la direction de la tendance et les points d'inversion potentiels avec clarté et précision. pour MT4: https://www.mql5.com/en/market/product/193245 Informations sur le prix : Le prix actuel est un prix promotionnel et est susceptible de changer lors des prochaines mises à jour et nouvelles fonctionnalités. Offre bonus : Pour obtenir GRATUITEMENT l'Auto-Trade Assistant E
Un nouveau Roi en ville - Indicateur + Gestion des ordres (TP1 + TP2 + TP3) + Envoi optionnel de signaux Telegram INCLUS (GRATUIT) (SYSTÈME COMPLET DE TRADING et DE SIGNAUX) Notre meilleur EA pour l’Or : Gold Slayer Cet indicateur inclut une stratégie avancée, un système de trading avec gestion des ordres personnalisable ainsi qu’un système de retour à la moyenne combinant des extensions d’enveloppes, soutenu par plusieurs filtres intelligents de confirmation comme le RSI afin de détecter des en
Smart Trend Trading System — MetaTrader 5 Après votre achat, envoyez-moi un message sur MQL5 pour recevoir GRATUITEMENT Smart Universal Expert Advisor, ainsi que le cours en ligne, le manuel PDF et l’accès au groupe privé. STTS réunit la direction de la tendance, les signaux d’entrée et de sortie, les zones de retournement et les niveaux de prix importants directement sur votre graphique. Suivez le système manuellement ou connectez un EA compatible distinct pour une exécution automatique selon l
Entry Points Pro vous montre où entrer, où placer le stop et avec quel lot trader — avant que vous ne passiez l'ordre. PRIX Actuellement 199 USD : 8 exemplaires à ce prix, ensuite 249 USD. Le prix final est de 349 USD. Je gagne ma vie en tradant sur les marchés, et je le montre, donc je n'ai pas besoin de vendre cet indicateur à tout le monde. C'est un outil pour les traders qui réfléchissent par eux-mêmes, pas un bouton magique. Pas de cassure, pas de trade. Une flèche grise est un signal annu
Zoryk Gold
Reda El Koutbane
4.79 (19)
ZORYK — Système avancé de signaux XAUUSD pour MetaTrader 5 Vous connaissez certainement cette sensation. Vous passez du temps à analyser l’or. Vous attendez le bon point d’entrée. Vous ouvrez enfin la position, puis le prix commence immédiatement à évoluer contre vous. Vous fermez trop tôt, déplacez le Stop Loss ou hésitez pendant quelques secondes. Ensuite, le marché atteint exactement l’objectif que vous aviez initialement prévu, mais sans vous dans la position. Le problème n’était pas toujour
Gardez votre avantage de trading dans votre ligne de mire ! M5 Sniper est un nouvel indicateur de MeanFX. Il combine des signaux de trading précis avec des niveaux de TP/SL adaptatifs — créant ainsi les meilleures opportunités de trading statistiques possibles ! Le prix augmente tous les 5 achats, le prochain prix est de 69$ Envoyez-moi un message après l’achat pour recevoir des conseils/un guide et un EA bonus Qu’est-ce qui le distingue ? Performance statistique éprouvée sur Gold XAUUSD ( fonct
Gann Made Easy   est un système de trading Forex professionnel et facile à utiliser qui est basé sur les meilleurs principes de trading en utilisant la théorie de mr. WD Gann. L'indicateur fournit des signaux d'ACHAT et de VENTE précis, y compris les niveaux Stop Loss et Take Profit. Vous pouvez échanger même en déplacement en utilisant les notifications PUSH. VEUILLEZ ME CONTACTER APRÈS L'ACHAT POUR RECEVOIR GRATUITEMENT DES INSTRUCTIONS DE TRADING ET D'EXCELLENTS INDICATEURS SUPPLÉMENTAIRES! V
SuperScalp Pro
Van Minh Nguyen
4.54 (37)
SuperScalp Pro - Professional Multi-Layer Confluence Scalping System SuperScalp Pro est un indicateur de scalping avancé qui améliore le Supertrend classique grâce à plusieurs filtres intelligents de confirmation. Il vous aide à identifier des opportunités de trading Buy/Sell présentant une probabilité de réussite plus élevée, tout en réduisant considérablement les faux signaux. Des flèches Buy et Sell bien visibles apparaissent directement sur le graphique, avec des niveaux de Stop Loss et de T
Ultra Indicator
Ihor Otkydach
5 (1)
ULTRA est un indicateur technique « tout-en-un » : il analyse le marché de manière autonome, génère des signaux de trading, affiche les niveaux permettant de définir des ordres stop-loss et suggère le moment opportun pour clôturer les positions afin de sécuriser les bénéfices ou de minimiser les pertes. En d'autres termes, peu importe que vous ne sachiez pas analyser le marché, déterminer les niveaux (où placer votre stop-loss) ou que vous ayez du mal à gérer votre capital. ULTRA s'occupera de t
Gold Trend Coach MT5
Cristhian Alexander Gaibor Cuasquer
4.27 (11)
Des signaux d'achat et de vente sans repaint pour l'or (XAUUSD) sur MetaTrader 5. Chaque signal arrive avec un stop loss et trois take profits. Un filtre Smart Money Concepts avec BOS et CHoCH, pour trader dans le sens de la structure, pas contre elle. Un Mentor en direct sur votre panneau qui vous guide à chaque étape, de l'entrée jusqu'au TP3. Et des alertes directement sur votre téléphone et sur votre propre canal Telegram. C'est ça, Gold Trend Coach. Ne tradez plus jamais seul. KIT ACHETEUR
GoldenX Entry MT5
VividMind Digital Solutions
5 (17)
GoldenX Entry est un indicateur MT5 doté d’un algorithme adaptatif Smart Entry Trend, d’un système de scoring des signaux, d’un détecteur de régime de marché et d’un filtre de volatilité. Chaque signal inclut un niveau d’entrée calculé, trois niveaux de Take-Profit (TP1, TP2, TP3) ainsi qu’un niveau de Stop-Loss. Il est construit sur plusieurs couches analytiques conçues pour s’adapter à différentes conditions de marché, combinant un système analytique multicouche avec un optimiseur intégré et u
SMC Intraday Formula
VividMind Digital Solutions
5 (26)
Commençons par être honnêtes. Aucun indicateur ne vous rendra rentable à lui seul. Si quelqu’un vous dit le contraire, il vous vend un rêve. Tout indicateur qui affiche des flèches parfaites d’achat/vente peut être rendu impeccable — il suffit de zoomer sur la bonne partie de l’historique et de capturer uniquement les trades gagnants. Nous ne faisons pas cela.  SMC Intraday Formula est un outil. Il lit la structure du marché pour vous, identifie les zones de prix à la probabilité la plus élevée
Boba Analysis Suite
Trade Ready Solutions LLC
5 (2)
Boba Analysis Suite Boba Analysis Suite est un indicateur d’analyse pour MetaTrader 5. Il réunit la structure du marché, les zones de prix pertinentes et le contexte général du marché dans une même vue graphique. Développé à partir de l’expérience pratique d’un trader et formateur en trading, il accompagne une démarche d’analyse structurée : évaluer la direction du marché, identifier les niveaux importants et analyser plusieurs unités de temps conjointement. Une analyse en contexte La significat
FX Power MT5 NG
Daniel Stein
5 (33)
FX Power : Analysez la force des devises pour des décisions de trading plus intelligentes Aperçu FX Power est l'outil essentiel pour comprendre la force réelle des principales devises et de l'or, quelles que soient les conditions du marché. En identifiant les devises fortes à acheter et les faibles à vendre, FX Power simplifie vos décisions de trading et révèle des opportunités à forte probabilité. Que vous suiviez les tendances ou anticipiez les retournements à l'aide de valeurs extrêmes de D
Gold Entry Sniper
Tahir Mehmood
5 (23)
Gold Entry Sniper – Tableau de Bord ATR Multi-Unités de Temps pour Scalping et Swing Trading sur l'Or Gold Entry Sniper est un indicateur avancé pour MetaTrader 5 qui fournit des signaux d'achat/vente précis sur XAUUSD et autres actifs, basé sur la logique de Trailing Stop ATR et l' analyse multi-unités de temps . Caractéristiques et Avantages Clés Analyse Multi-Unités de Temps – Affiche les tendances en M1, M5, M15 sur un seul tableau. Trailing Stop Basé sur l'ATR – Ajuste automatiquement selon
M1 Sniper MT5
Oleg Rodin
5 (7)
M1 SNIPER   est un système d'indicateurs de trading facile à utiliser. Il s'agit d'un indicateur à flèche conçu pour l'unité de temps M1. Cet indicateur peut être utilisé seul pour le scalping sur l'unité de temps M1 ou intégré à votre système de trading existant. Bien que conçu spécifiquement pour le trading sur l'unité de temps M1, ce système peut également être utilisé avec d'autres unités de temps. Initialement, j'avais conçu cette méthode pour le trading du XAUUSD et du BTCUSD. Cependant, j
FiboSniper Pro
Van Minh Nguyen
5 (4)
FiboSniper Pro – Multi-Filter Fibonacci System with Auto SL/TP and Control Panel FiboSniper Pro est un indicateur technique qui combine des Fibonacci Envelopes dynamiques avec plusieurs filtres de confirmation afin de générer des signaux Buy et Sell sélectionnés. Les niveaux de Fibonacci sont calculés à partir de Moving Average et ATR, puis filtrés par ADX, EMA, RSI, ATR, Volume, Time et la structure des bougies. L’indicateur affiche directement sur le graphique les niveaux automatiques de Stop
Apex Patterns PRO Achetez l'indicateur - Obtenez GRATUITEMENT l'Expert Advisor basé sur celui-ci. Intelligence auto-optimisée des figures chartistes et des cassures Les scanners de figures traditionnels s'appuient sur des paramètres fixes, sous-performant souvent lorsque la volatilité et les structures du marché changent. Apex Patterns PRO est conçu pour s'adapter aux conditions changeantes du marché en combinant la reconnaissance des figures chartistes structurelles, le filtrage du momentum et
Auto Optimized SpeedAngle est un système de vectorisation du momentum de niveau institutionnel qui élimine l'ajustement de courbe ( curve-fitting ) grâce à une optimisation continue par avancement ( Walk-Forward Optimization , WFO). Plutôt que de s'appuyer sur des entrées statiques qui se dégradent lorsque les régimes de marché changent, l'indicateur recalibre dynamiquement ses paramètres en utilisant une validation hors échantillon ( Out-of-Sample , OOS), garantissant ainsi que les signaux affi
SQN Max indicator for MT5 by ITC
Renaud Herve Francois Candel
Sqn Max Indicator Sqn Max is an exclusive indicator to trade the market with high effectiveness. The indicator is based on price action, volatility and trend. This indicator is as simple as possible but not too simple. The indicator can generate alerts to ease the trading process. You don't have to stay all day in front of your screen. The indicator can be used with any class of assets and with any time frame. It is possible to achieve better results trading our list of selected assets. We achi
Prochaine mise à jour — Version 2.52 bientôt disponible ! [NOUVEAU] Préparez-vous à découvrir 4 nouvelles fonctionnalités majeures conçues pour améliorer votre analyse du marché et votre flux de travail de trading Nous faisons passer l’analyse du marché au niveau supérieur avec 4 nouvelles fonctionnalités conçues pour répondre à vos besoins en trading. Découvrez : 1. TRADE OVERVIEW DASHBOARD 2. CONFLUENCE AT ZONE 3. STRONG & WEAK HIGH/LOW 4. OTE 1. TRADE OVERVIEW DASHBOARD Un tableau de bord qu
Divergence Bomber
Ihor Otkydach
4.89 (94)
Chaque acheteur de cet indicateur reçoit également gratuitement : L’outil exclusif « Bomber Utility », qui accompagne automatiquement chaque opération de trading, fixe les niveaux de Stop Loss et de Take Profit, et clôture les positions selon les règles de la stratégie Des fichiers de configuration (set files) pour adapter l’indicateur à différents actifs Des set files pour configurer le Bomber Utility selon différents modes : « Risque Minimum », « Risque Équilibré » et « Stratégie d’Attente »
Power Candles MT5
Daniel Stein
4.58 (12)
Power Candles V3 - Indicateur de force à optimisation automatique Power Candles V3 transforme la force des devises et des instruments en un plan de trading exploitable sur chaque graphique auquel il est associé. Au lieu de se contenter de colorer les bougies, il effectue une optimisation automatique en temps réel en arrière-plan et vous fournit les meilleurs niveaux de Stop Loss, Take Profit et seuils de signal pour le symbole que vous avez sous les yeux. Un simple clic suffit pour l'adopter en
Currency Strength Wizard   est un indicateur très puissant qui vous offre une solution tout-en-un pour un trading réussi. L'indicateur calcule la puissance de telle ou telle paire de devises en utilisant les données de toutes les devises sur plusieurs périodes. Ces données sont représentées sous la forme d'un indice de devise facile à utiliser et de lignes électriques de devise que vous pouvez utiliser pour voir la puissance de telle ou telle devise. Tout ce dont vous avez besoin est d'attacher
Atomic Analyst MT5
Issam Kassas
4.51 (65)
Atomic Analyst — MetaTrader 5 Après votre achat, envoyez-moi un message sur MQL5 pour recevoir GRATUITEMENT Smart Universal Expert Advisor, ainsi que le cours en ligne, le manuel PDF et l’accès au groupe privé. Atomic Analyst réunit l’action des prix, la direction de la tendance, les signaux d’entrée et de sortie, le Stop Loss et plusieurs niveaux de Take Profit directement sur votre graphique. REPÉREZ LE SIGNAL. COMPRENEZ LA CONFIGURATION. Atomic Analyst présente son analyse sous forme d’inform
Unix Scalper
Issam Kassas
4 (4)
Unix Scalper — MetaTrader 5 Après votre achat, envoyez-moi un message sur MQL5 pour recevoir GRATUITEMENT Smart Universal Expert Advisor, ainsi que le cours en ligne, le manuel PDF et l’accès au groupe privé. Repérez la configuration. Consultez le plan. Choisissez comment intervenir. UNIX Scalper réunit l’analyse du marché, les décisions BUY/SELL/WAIT et les niveaux Entry, Stop Loss, TP1 et TP2 dans un panneau organisé. VISUALISEZ LE SIGNAL ET LE PLAN • Des décisions claires : BUY, SELL ou WAIT.
Astral Structure
Ottaviano De Cicco
Astral Structure Évaluez la configuration. Consultez le plan initial. Offre de lancement - $99. $149 après le lancement. Une configuration de structure soulève plusieurs questions : la vue plus large concorde-t-elle, où se situe la référence de stop et comment les objectifs sont-ils définis ? Astral Structure réunit ces questions dans un espace de travail pour les traders discrétionnaires qui fondent leurs décisions sur la structure du marché. Concentrez-vous sur la configuration pertinente. Exa
Tokyo mt5 Indicator
Vasiliy Strukov
5 (15)
Le Tokyo Indicator offre une vue d'ensemble visuelle et claire de l'orientation de la tendance, des signaux de trading potentiels et des conditions du marché. Sa ligne de tendance en escalier, codée par couleur, distingue les phases haussières (en bleu) des phases baissières (en magenta). Des flèches directionnelles associées mettent en évidence les opportunités d'achat et de vente potentielles lors des changements de tendance. Un tableau de bord intégré regroupe le signal actuel, l'orientation
Indicateur multi-devises de force et de momentum MT5 Dynamic Forex28 Navigator est l'évolution de nos indicateurs populaires de longue date, qui réunit la puissance de cinq en un : Advanced Currency Strength28 Indicator (700 avis) Advanced Currency IMPULSE with ALERT (530 avis) Currency Strength EXOTICS GOLD Impulse with Alert CS28 Combo Signals (bonus actuel) Pas besoin d'acheter quatre indicateurs et de les empiler sur vos graphiques. Tout est réuni dans un seul indicateur puissant : la force
Scalper Vault est un système de trading puissant et complet, conçu pour les traders en quête de régularité dans le cadre du trading intrajournalier. Cet indicateur de haute précision constitue un système de trading autonome et exhaustif, offrant des analyses de qualité institutionnelle, aussi bien pour le Forex que pour les options binaires. VEUILLEZ ME CONTACTER APRÈS VOTRE ACHAT POUR OBTENIR MES CONSEILS DE TRADING AINSI QU'UN EXCELLENT BONUS ! En éliminant les incertitudes et les analyses man
Plus de l'auteur
Smart Chandelier Exit
Bugra Kaan Yildirim
5 (3)
Smart Chandelier Exit v1.5 Smart Chandelier Exit is an adaptive trailing-stop and trend-direction indicator. It plots a multi-layer ratchet stop line that follows price: green below price in an uptrend, red above price in a downtrend. The line only ever ratchets in the trend's favor, never against it, so it doubles as a mechanical trailing stop and a clear trend-state signal. What makes it smart is the built-in Pearson R trend-quality filter. A raw stop line tells you where the stop is; the Pear
FREE
Smart Chandelier Exit EA 1.1 Smart Chandelier Exit EA is the Expert Advisor for the Smart Chandelier Exit indicator, tested on Gold (XAUUSD) H1. It runs the indicator's chandelier engine by itself, with the same formula, the same default settings and the same fake-flip confirmation, and turns the confirmed flips into trades. A flip is traded only when it agrees with the higher timeframe, and every position carries a stop on the broker's server that follows the chandelier line and is never loosen
Smart Exit EA
Bugra Kaan Yildirim
Smart Exit EA — Ride the Trend, Skip the Chop Smart Exit EA follows a trend with an adaptive ATR trailing line and stays in the move until the trend really turns. It is built for two problems every trend trader knows: getting shaken out of a good trade too early, and getting chopped up in a sideways market. Release notes, chart examples and new product announcements are posted on the TrendTower channel:   https://www.mql5.com/en/channels/trendtower What It Does Rides trends longer.   The trailin
FREE
Refine OBV
Bugra Kaan Yildirim
Refine OBV  Refine OBV measures cumulative volume flow read against its own adaptive signal line with a color-coded spread and non-repainting divergence detection. Raw On Balance Volume answers one question: is volume being credited to the buyers or the sellers? While useful, raw OBV is a single wandering line with no reference point. Refine OBV adds an adaptive EMA of the flow itself as a reference line. The distance between the flow and its signal line (the spread) is rendered as a color-coded
FREE
Trix Trend
Bugra Kaan Yildirim
Trix Trend algoteknik · MetaTrader 5 Indicator Manual Overview Trix Trend is a momentum oscillator based on TRIX — the rate of change of a triple-smoothed exponential moving average of price. Triple smoothing removes most of the short-term noise, so the oscillator reacts to the underlying momentum of the move rather than to every small wiggle, while staying more responsive than a simple long moving average. The indicator draws a slope-colored TRIX line, a weighted signal line, a zero line, and t
FREE
Donchian Trend Engine  Donchian Trend Engine is an institutional-grade dual-clock trend-following and channel breakout suite engineered for MetaTrader 5, combining Richard Donchian's breakthrough channels with the complete tactical rules of the legendary Turtle Trading experiment . The Two-Clock Architecture Unlike standard Donchian channel indicators that merely compute static highest highs and lowest lows, Donchian Trend Engine is built on a mathematically rigorous two-clock foundation : The P
FREE
Smart Volatility Squeeze MT5 Smart Volatility Squeeze MT5 is a volatility compression and momentum expansion indicator for MetaTrader 5. It builds on John Carter's Volatility Squeeze framework and extends the usual single-tier squeeze into three compression tiers, so you can see not only whether the market is compressed but how tightly it is compressed before it expands. The indicator opens in a separate window and draws two elements: a linear regression momentum histogram and a row of coloured
FREE
Smart Chandelier Exit for MetaTrader 4 Smart Chandelier Exit is an advanced volatility trailing-stop and trend-direction indicator developed for MetaTrader 4. It enhances classical Chandelier Exit logic by introducing a real-time Pearson R correlation engine to quantify trend quality and weed out sideways market noise. Technical Specifications 1. Precision Ratchet Trailing: The trailing line computes adaptive volatility bands based on Highest High and Lowest Low channels combined with Average Tr
FREE
Quant Trend Cloud
Bugra Kaan Yildirim
Quant Trend Cloud A cloud that is a regime, not a thread: the band between two slow adaptive lines. No arrows and no dots - the colour says which way the regime stands, and the brightness says whether the candle and the fast line stand clear of the band on that bar. Version 1.0. Release notes, chart examples and new product announcements are posted on the TrendTower channel: https://www.mql5.com/en/channels/trendtower What It Is The cloud is the band between Kaufman's adaptive average and VIDYA.
FREE
Quant Key Levels
Bugra Kaan Yildirim
Quant Key Levels, version 1.0. The reference levels a discretionary trader actually works from, on one chart and in one visual language. Eleven families, each on its own switch, and nothing on the chart that a level does not earn. What separates it from a pivot pack is not the number of families. It is that the things most level tools assume, this one measures. How far your broker's clock sits from UTC, measured out of your own terminal rather than typed into a box. Where an exchange actually op
FREE
Trend Regime Line
Bugra Kaan Yildirim
Trend Regime Line Version 1.1 · algoteknik What This Indicator Is Trend Regime Line reads the trend through a triad: three Larry Williams tools that each answer their own question, and one line on the price chart that is coloured only when the answers fit together. Williams %R says which side price is thrusting to, the Ultimate Oscillator whether momentum confirms that side, and Williams Accumulation/Distribution whether buying or selling pressure still backs it. Green means the triad agrees on
FREE
SVS Assistant
Bugra Kaan Yildirim
SVS Assistant SVS Assistant is the execution half of Smart Volatility Squeeze MT5. It carries out the orders you request from that indicator's 1-Click Trading Desk, applies your risk rules to them, and manages the resulting positions. It is published free of charge. Please read this before downloading: it does not analyse the market and it produces no signals of its own. Without the Smart Volatility Squeeze indicator running on the same chart there is nothing for it to listen to, and it will do
FREE
Smart Chandelier Exit EA — Institutional Gold Trend & Prop Firm Engine for MetaTrader 4 LAUNCH PROMO: First 10 copies available at $199 (1/10 sold)! Next price: $249 | Final price: $399. FREE SETFILES AVAILABLE IN THE COMMENTS TAB: SCE_GOLD_H1_Conservative.set (Low drawdown, steady compounding) SCE_GOLD_H1_Balanced_Growth.set (3-Year tick verified peak performance engine) SCE_GOLD_H1_PropFirm_Challenge.set (Strict daily 2.5% and max 5% loss guards) WHY 95% OF MARKETPLACE ROBOTS FAIL — AND WHY TH
Quant Desk Pro
Bugra Kaan Yildirim
Quant Desk Pro An R-native trade manager for MetaTrader 5.   It manages the trades you have already opened: it measures what each one is really risking, protects it, scales out of it on a plan you set, trails what is left, and stops the whole book when the day has gone far enough wrong. Read this first.   Quant Desk Pro does not open trades and has no signal. And it ships in   VIEW ONLY : it will not send a single order until you set   I understand the risks   to true in the inputs. Until you do
FREE
Filtrer:
Aucun avis
Répondre à l'avis