
BrioQuant Range Volume Profile
- Göstergeler
-
Mitchell Dean Ede
 Trader, araç geliştirici ve piyasa ninjası
Ben 2010’dan beri piyasalarla çalışan bir trader ve işlem araçları geliştiricisiyim. Grafiklerini gereksiz şekilde karmaşıklaştırmadan faydalı bağlam sunmak isteyen traderlar için temiz MetaTrader 5 indikatörleri ve EA’lar geliştiriyorum. - Sürüm: 1.31
- Güncellendi: 30 Ağustos 2026
- Etkinleştirmeler: 5
Build a clear POC and value area from the chart range you choose.
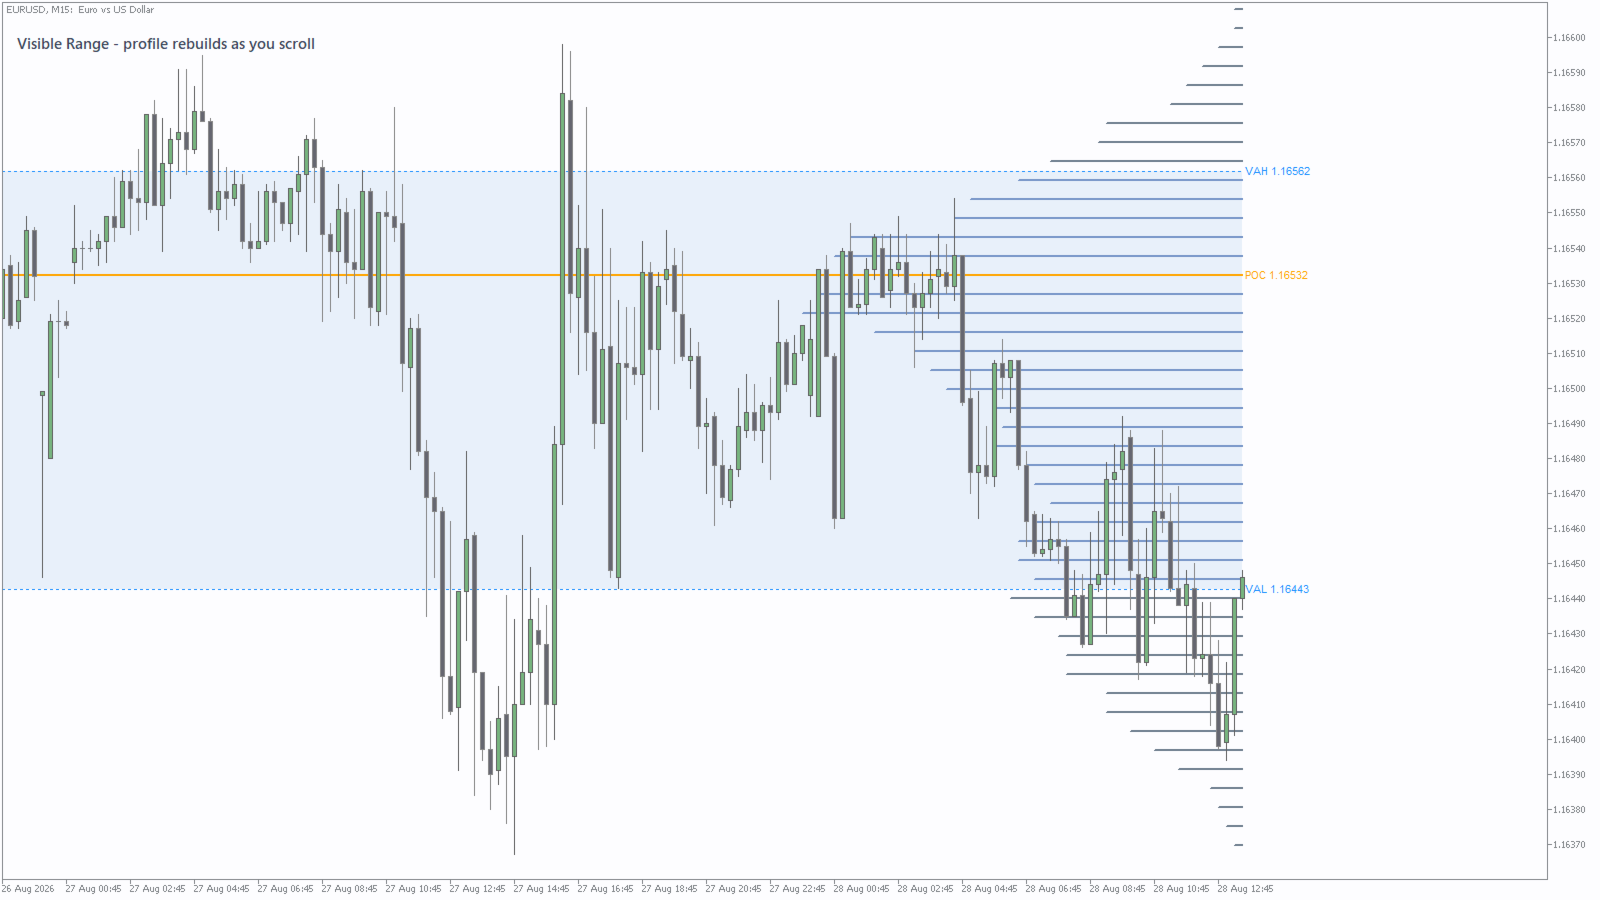
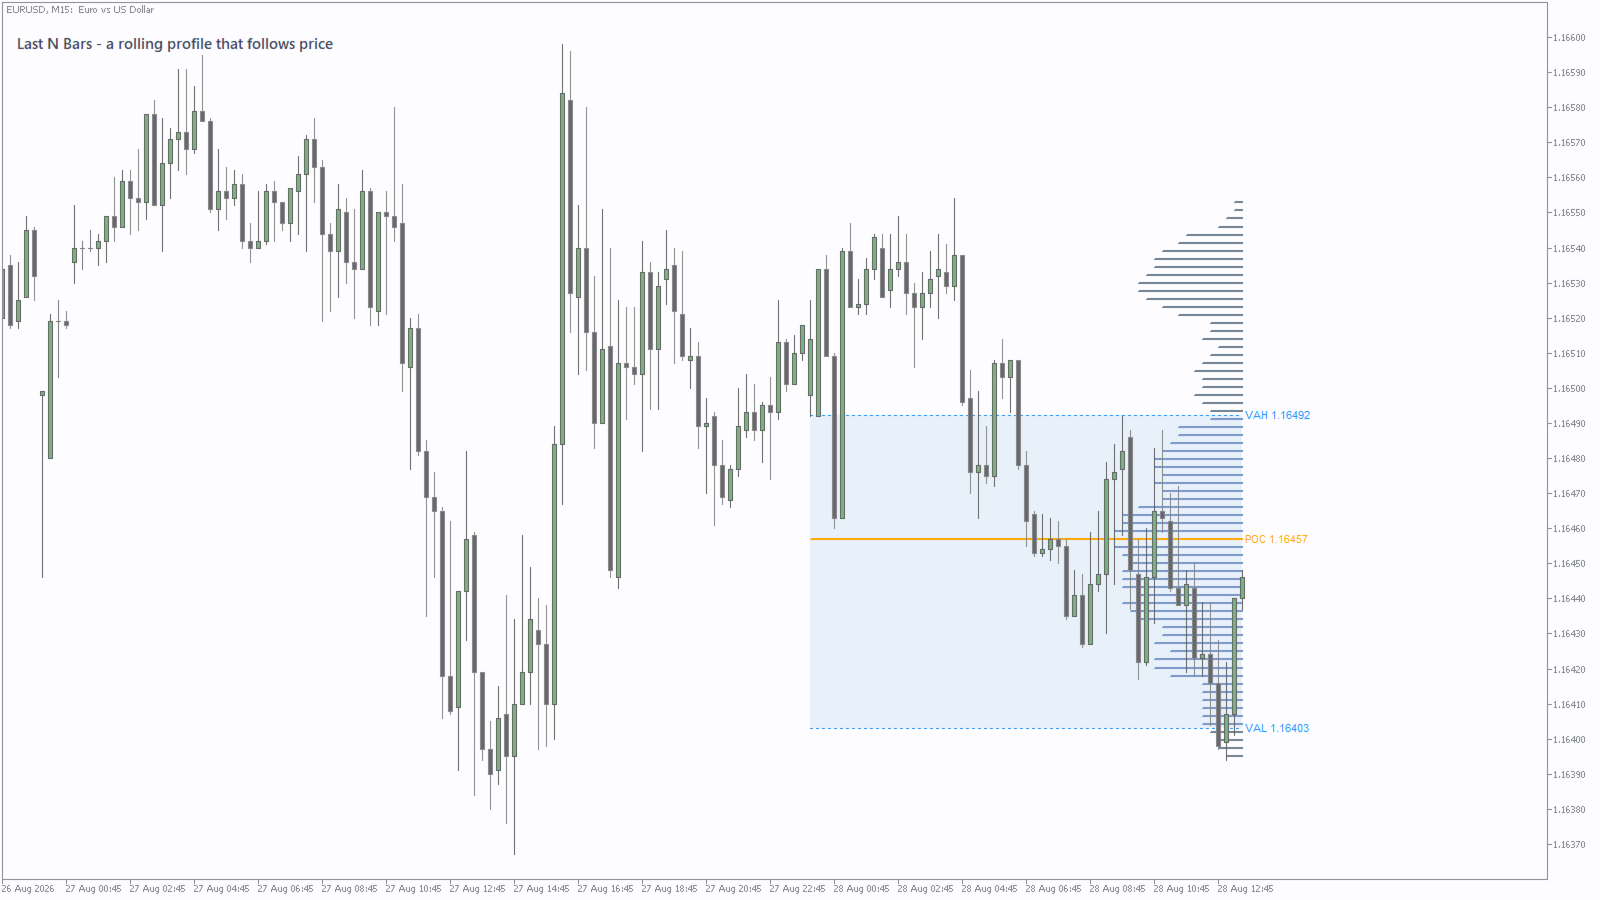
BrioQuant Range Volume Profile maps the selected MT5 volume feed across price and marks the POC, VAH and VAL. Profile the visible chart, a draggable fixed range, today or the latest number of bars, with configurable value-area shading and labels.
Features:
- Modes: Visible Range, Fixed Range (drag two handles on the chart), Today, Last N Bars
- POC, configurable value-area percent, VA shading, price labels
- Instance tag lets two copies share one chart
- Tick or real volume
- All chart objects removed cleanly with the indicator
Note: on Forex and many CFD symbols, tick volume measures quote activity rather than centralized traded volume. Real volume is available only where the broker supplies it.
Chart context: it draws the profile and leaves the trading decisions to you.
If you work in sessions
If you want the background first, POC, VAH and VAL: how to read a volume profile in MetaTrader 5 explains how the levels are built and how traders read them. What tick volume actually is in MetaTrader 5 covers the Applied volume input below and how to tell what your own feed supplies.
Inputs
- Profile range - Visible chart range (rebuilds as you scroll), Fixed range (drag the two vertical handles over any stretch you like), Last N bars, or Today from midnight to now. Fixed range is the default and the one worth learning first.
- Bars - how many bars the Last N mode uses. Default 200.
- Price rows - the resolution of the histogram. Too few and neighbouring prices merge into one block; too many and every row holds a fragment and the POC jumps about. Default 70.
- Applied volume - Tick or Real. Leave it on Tick for forex, where the terminal reports the number of price changes rather than a traded quantity. Switch to Real only where you have established the feed genuinely carries volume for that symbol.
- Value area % - the share of total volume the value area encloses, expanded outward from the POC one row at a time. Default 70, the market-profile convention.
- Max bar width - how far the histogram reaches across the chart, as a fraction of the profiled range. Default 0.30.
- Draw bars from right edge - anchor the histogram to the right of the range instead of the left.
- Bar thickness - histogram line weight in pixels.
- Histogram colour, in-value-area colour, POC colour and VAH/VAL line colour - four colours, so rows inside the value area read differently from rows outside it and the POC stands out from both.
- Shade value area and Value area fill - the pale band behind the value area.
- Price labels on POC/VAH/VAL - the numeric readout on the three levels.
- Fixed-range handle colour - the two draggable vertical lines in Fixed range mode.
- Instance tag - set a different tag on each copy when running two or more profiles on one chart, so they do not share object names.
Tell me what would make this more useful. Post the change you want in the comments - I read every one and build what I can.
































Kullanıcı değerlendirmeye herhangi bir yorum bırakmadı