
The volume bar under a forex chart is not a count of lots traded across the currency market. In MetaTrader 5 it is usually tick volume: the number of price or quote updates received while that bar was forming.
That distinction matters to volume profiles, VWAPs, volume-spike alerts and every other indicator that weights its calculation by volume. Before reading the result, find out which volume the indicator used and what the symbol's feed actually supplies.
What MT5 stores in each bar
MQL5 represents a historical bar with the MqlRates structure. Alongside its time, open, high, low, close and spread, the structure contains two separate fields:
- tick_volume is the tick count for the bar. On a forex chart, it records how many price updates the terminal received during the period. It is a count of events, not a count of lots, contracts or currency units.
- real_volume is the traded quantity reported for the bar where the data feed supplies it. Depending on the instrument, its unit can be shares, contracts or another exchange-defined quantity.
The word tick can cause confusion here. Tick volume does not add up the distance travelled. Ten updates of one point each give a tick volume of ten; one update of ten points gives a tick volume of one. Direction is not part of the count either.
There is another similarly named property in MQL5. SYMBOL_VOLUME, read with SymbolInfoInteger(), is the volume of the last deal. SYMBOL_VOLUME_REAL reports the same last-deal quantity with greater precision. Neither property is the tick count of the current bar. For bar history, use MqlRates, iTickVolume(), iRealVolume(), CopyTickVolume() or CopyRealVolume().
Why spot forex has no single volume total
Spot foreign exchange is an over-the-counter market. Banks, prime brokers, electronic venues, liquidity providers and customers trade through a network rather than sending every transaction to one central exchange.
There is therefore no single consolidated tape containing every EURUSD trade. A retail broker receives or constructs a stream of Bid and Ask quotes from its own sources and sends that stream to its clients. The MT5 chart for an OTC symbol is normally built from those Bid quotes.
Tick volume is useful because active periods tend to produce more quote changes than quiet periods. It is a proxy for activity in that feed. A bar with 1,800 ticks received far more updates than a bar with 180 ticks on the same feed, even though neither number says how many euros changed hands across the global market.
Why brokers show different tick volume
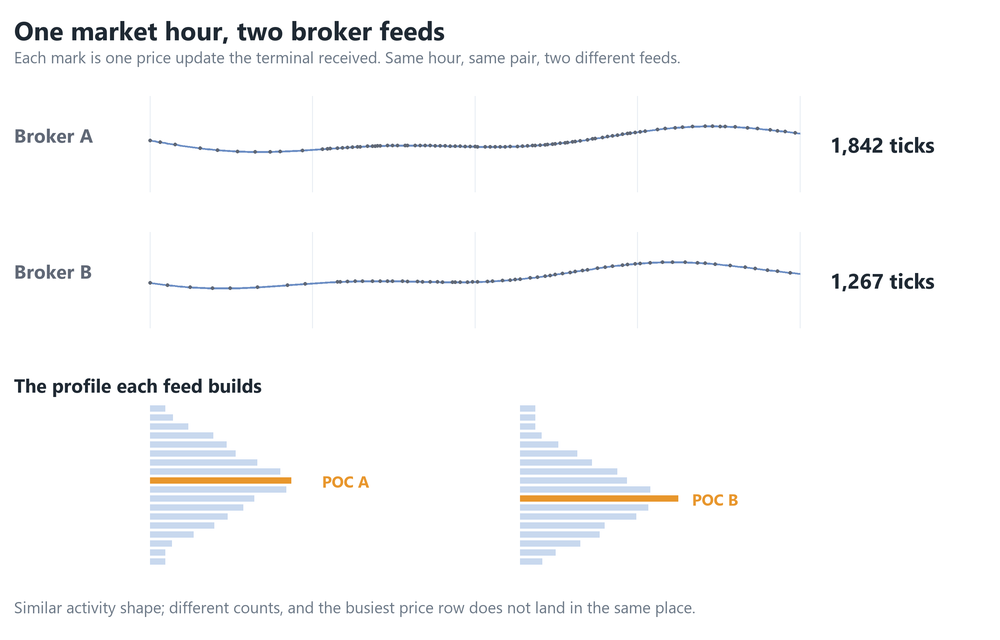
Two brokers can cover the same EURUSD hour and produce different tick counts. They may use different liquidity providers, combine those providers differently, publish prices at different frequencies, or filter repeated and insignificant updates differently. Their Bid paths can look close while the number of updates differs materially.
This is not a scaling detail that can be corrected by changing the colour or timeframe. Each broker has supplied a different dataset.
If a volume profile built from Broker A places its point of control at 1.1642 and Broker B places it at 1.1640, both levels belong to their respective histories and calculation settings. Comparing the exact POC, VAH, VAL or spike threshold across brokers is comparing two datasets. The same applies when one feed calls a bar unusually busy and another does not.
Profile construction introduces a second source of difference. An MT5 bar contains one volume total, not a record of how that total was distributed between its high and low. A bar-based profile must apply an allocation rule. The guide to POC, VAH and VAL in MT5 explains that step and why the exact row can move.
When real volume means exchange volume
Real volume is most direct on an exchange-traded instrument when the broker passes through the exchange feed. The exchange records executed deals and their quantities, so an MT5 futures or share bar can carry the number of contracts or shares traded during that period. Last prices and Time and Sales then come from actual exchange transactions.
A non-zero real_volume field is evidence that the feed supplied a quantity. Its source determines its meaning. On an OTC CFD, a broker can populate the field with its own dealt volume, client flow or a quantity derived from a provider. That is still a defined dataset, but it is not automatically the total volume of the underlying exchange or the wider market.
Ask the broker three precise questions: what venue or system produced the number, what unit it uses, and whether it covers the underlying market or only the broker's flow. The answer identifies what the field measures. A non-zero value by itself identifies only that a value was supplied.
Check your symbol in two minutes
- Choose a completed, actively traded bar. A live bar is still accumulating, and an inactive last-deal field can remain unchanged between trades.
- Add MT5's built-in Volumes indicator. In its inputs, select tick volume, note the completed bar's value, then select real volume. The Data Window gives the exact value under the cursor.
- If real volume is zero across a reasonable run of active bars while tick volume is populated, that symbol's history is supplying tick volume only. If real volume is populated, confirm its source and unit with the broker.
- For an exchange symbol, Market Watch can also show Last and Volume for the latest deal. That is a quick sign that deal data is arriving; use the bar data to inspect the period total.
The programmatic check needs two statements inside a script's OnStart(): long v = iRealVolume(_Symbol, PERIOD_CURRENT, 1); followed by Print("Last completed bar real volume: ", v);. Shift 1 selects the last completed bar. Repeat it on several active bars before deciding what the history contains.
Indicators that expose an Applied volume input use ENUM_APPLIED_VOLUME: VOLUME_TICK selects tick volume and VOLUME_REAL selects trade volume. That input selects a field; it does not change where the broker obtained the data.
What tick volume is good for
Tick volume is well suited to comparisons made within one consistent feed. It shows relative activity between bars, helps compare the London and New York sessions, reveals the quiet hours, and makes unusual bursts of quote activity visible.
It also supports a useful volume-profile shape. Thick areas show prices that accumulated more of the selected feed's activity; thin areas show prices through which activity was distributed more lightly. Read the shape and its changes on the same symbol and broker, while treating its absolute count and exact price rows as properties of that dataset.
BrioQuant Range Volume Profile is a free MT5 indicator that maps a chosen chart range into POC, VAH and VAL. BrioQuant Anchored VWAP is a free MT5 indicator that plots VWAP from a session, calendar or manual anchor. Both provide an Applied volume input, so the calculation can use tick or real volume according to the feed you have just checked.


