BrioQuant Range Volume Profile

  • Indicateurs
  • Mitchell Dean Ede
    Mitchell Dean Ede
    5 (5)
    Trader, créateur d’outils & ninja des marchés
    Je suis trader et développeur d’outils de trading, actif sur les marchés depuis 2010. Je crée des indicateurs et des Expert Advisors clairs pour MetaTrader 5, destinés aux traders qui recherchent un contexte utile sans encombrer leurs graphiques.
  • Version: 1.31
  • Mise à jour: 30 août 2026
  • Activations: 5

Build a clear POC and value area from the chart range you choose.

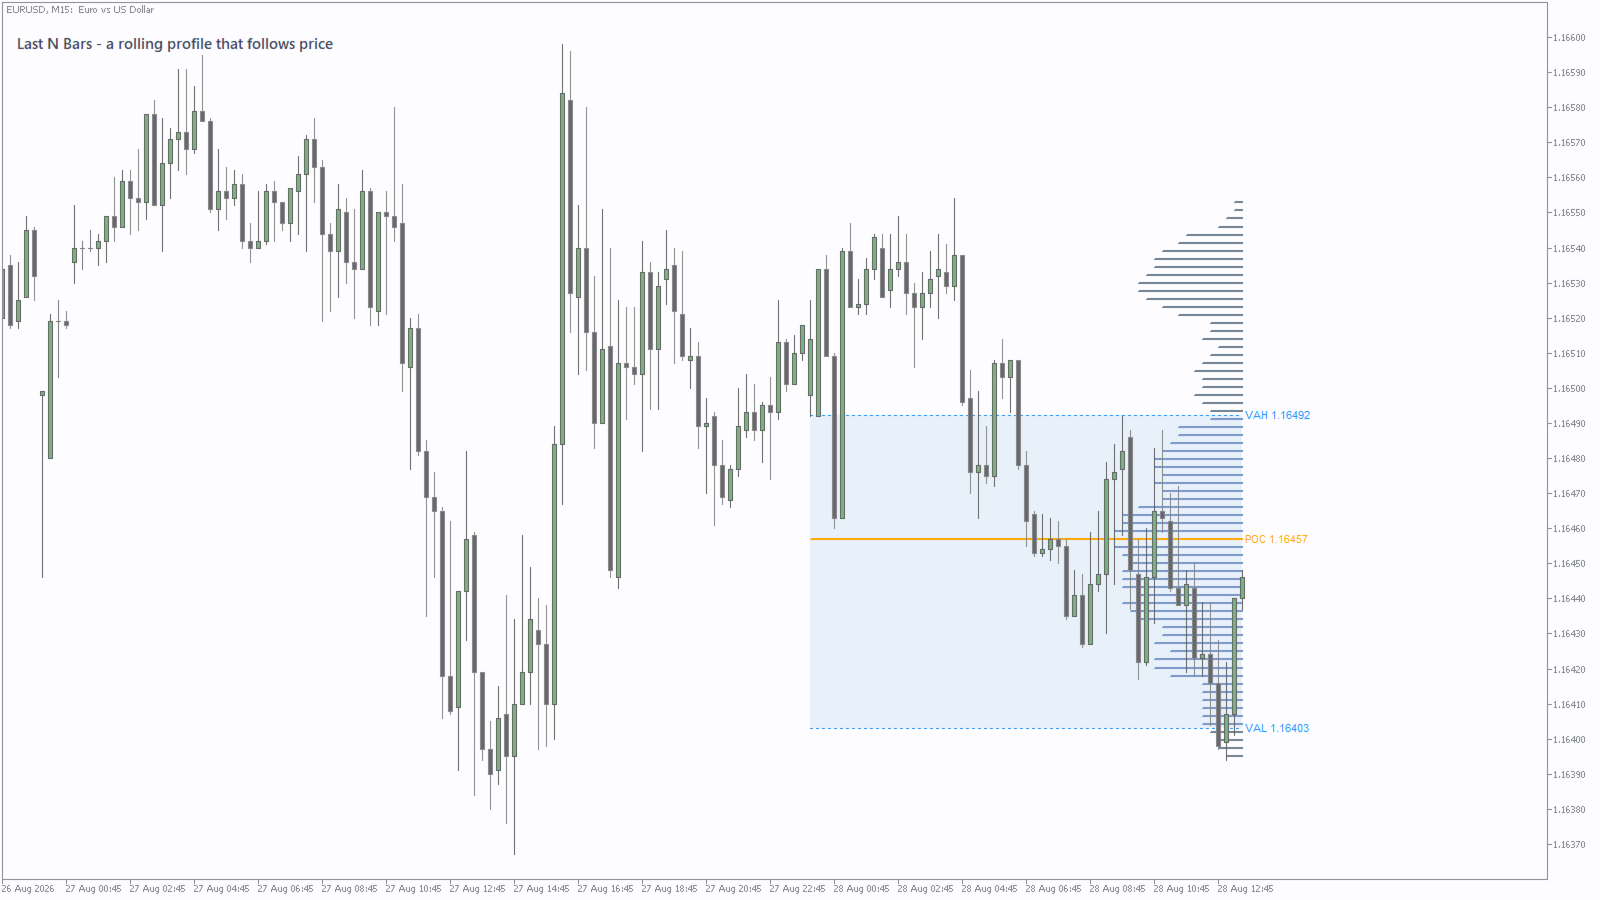
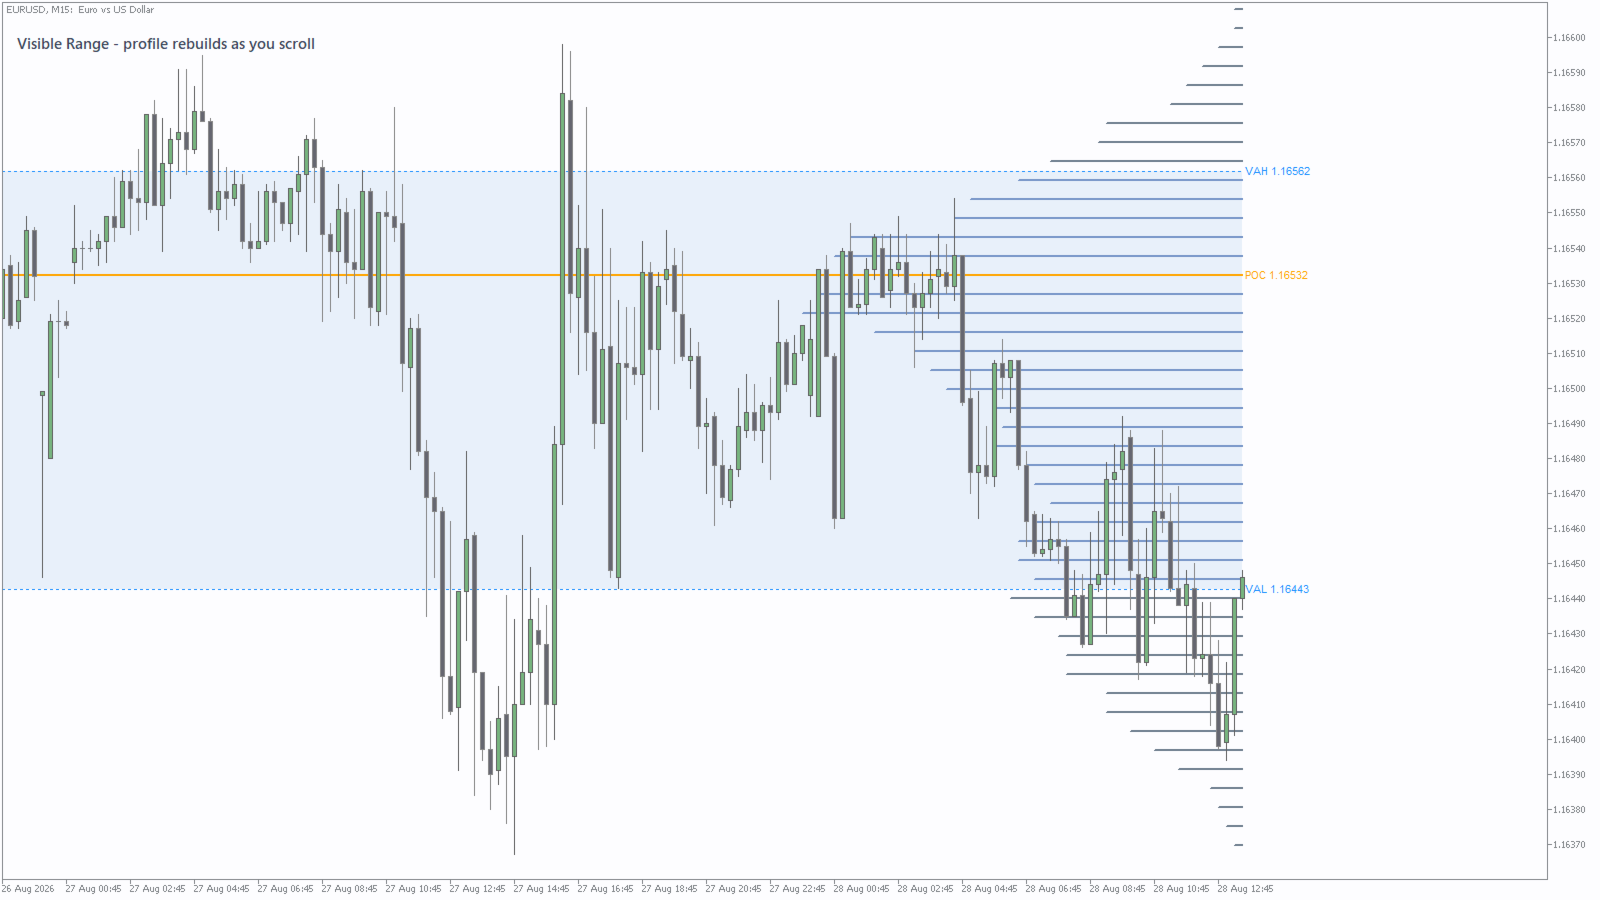
BrioQuant Range Volume Profile maps the selected MT5 volume feed across price and marks the POC, VAH and VAL. Profile the visible chart, a draggable fixed range, today or the latest number of bars, with configurable value-area shading and labels.

Features:

  • Modes: Visible Range, Fixed Range (drag two handles on the chart), Today, Last N Bars
  • POC, configurable value-area percent, VA shading, price labels
  • Instance tag lets two copies share one chart
  • Tick or real volume
  • All chart objects removed cleanly with the indicator

Note: on Forex and many CFD symbols, tick volume measures quote activity rather than centralized traded volume. Real volume is available only where the broker supplies it.

Chart context: it draws the profile and leaves the trading decisions to you.

If you work in sessions

If you want the background first, POC, VAH and VAL: how to read a volume profile in MetaTrader 5 explains how the levels are built and how traders read them. What tick volume actually is in MetaTrader 5 covers the Applied volume input below and how to tell what your own feed supplies.

Inputs

  • Profile range - Visible chart range (rebuilds as you scroll), Fixed range (drag the two vertical handles over any stretch you like), Last N bars, or Today from midnight to now. Fixed range is the default and the one worth learning first.
  • Bars - how many bars the Last N mode uses. Default 200.
  • Price rows - the resolution of the histogram. Too few and neighbouring prices merge into one block; too many and every row holds a fragment and the POC jumps about. Default 70.
  • Applied volume - Tick or Real. Leave it on Tick for forex, where the terminal reports the number of price changes rather than a traded quantity. Switch to Real only where you have established the feed genuinely carries volume for that symbol.
  • Value area % - the share of total volume the value area encloses, expanded outward from the POC one row at a time. Default 70, the market-profile convention.
  • Max bar width - how far the histogram reaches across the chart, as a fraction of the profiled range. Default 0.30.
  • Draw bars from right edge - anchor the histogram to the right of the range instead of the left.
  • Bar thickness - histogram line weight in pixels.
  • Histogram colour, in-value-area colour, POC colour and VAH/VAL line colour - four colours, so rows inside the value area read differently from rows outside it and the POC stands out from both.
  • Shade value area and Value area fill - the pale band behind the value area.
  • Price labels on POC/VAH/VAL - the numeric readout on the three levels.
  • Fixed-range handle colour - the two draggable vertical lines in Fixed range mode.
  • Instance tag - set a different tag on each copy when running two or more profiles on one chart, so they do not share object names.

Tell me what would make this more useful. Post the change you want in the comments - I read every one and build what I can.
Produits recommandés
La Master Edition est un outil d'analyse de qualité professionnelle conçu pour visualiser la structure du marché à travers le prisme du volume et du flux monétaire. Contrairement aux indicateurs de volume standard, cet outil affiche un Profil de Volume Quotidien directement sur votre graphique, vous permettant de voir exactement où la découverte des prix a eu lieu et où est positionné "l'argent intelligent". Cette Master Edition est conçue pour la clarté et la rapidité, dotée d'un système unique
Smart SMC FVG
Ekkasawat Pitichalermroch
SMC + Volume Profile + FVG: Indicator Guide Overview SMC + Volume Profile + FVG is an all-in-one indicator for MetaTrader 5. It combines three popular price-action tools on a single chart: Smart Money Concepts (SMC): market structure (swings, BOS, CHoCH) and Order Blocks Fair Value Gaps (FVG): price imbalances left behind by fast moves Volume Profile: where the most trading happened, shown as POC, Value Area High and Value Area Low Everything is drawn automatically. You can turn each part on or
English Version Unlock the Power of Volume with Next-Generation Volume Profile This advanced Volume Profile indicator transforms your MetaTrader 5 chart into a powerful volume analysis tool. Unlike standard volume indicators that only show volume over time, this tool displays volume distribution across   price levels , allowing you to pinpoint exactly where the "big money" is trading. Why choose this indicator? Dynamic Price Bins:   Set your own precision (number of rows) to view volume clust
The "MR Volume Profile 5" indicator is a charting tool that displays trading volume at different price levels rather than time intervals. A key concept in volume profile is the point of control (POC)—the price level with the highest volume traded during the session or time range. While tools like VWAP or OBV provide volume trends, the "MR Volume Profile 5" indicator offers granular detail about where the most market activity occurs at specific price levels. This makes it a more precise tool for
VWAP Volume Profile Pro
Strifor (Mauritius) Ltd
5 (6)
VWAP Volume Profile Pro Analyse professionnelle de la structure du marché VWAP Volume Profile Pro est un indicateur de trading professionnel qui combine le VWAP (Volume Weighted Average Price) , le Volume Profile , le Point of Control (POC) , le Value Area High (VAH) et le Value Area Low (VAL) dans un seul outil d’analyse puissant. Cet indicateur est conçu pour fournir une analyse objective de la structure du marché basée sur la distribution des volumes et le prix juste ( Fair Value ). Il aide l
FREE
Spike Blast Pro
Israr Hussain Shah
Here   our more valuable tools SMC Trend Trading   ,  Easy SMC Trading  ,  Institutional SMC Architect Volume Analysis Tools  ,  Volume flow Profile  ,  Market volume profile  , FVG with Volume  , Liquidity Heatmap Profile  ,  Volume Spread Analysis Spike Blaster Pro is a next-generation MT5 indicator designed specifically for synthetic markets. It works seamlessly on Boom Index and Weltrade Index , providing traders with sharp, reliable spike detection signals. What makes Spike Blaster Pro po
Here   our more valuable tools SMC Trend Trading   ,  Easy SMC Trading  ,  Institutional SMC Architect Volume Analysis Tools  ,  Volume flow Profile  ,  Market volume profile  , FVG with Volume  , Liquidity Heatmap Profile  ,  Volume Spread Analysis Short Description: Stop overloading your charts with dozens of indicators.   Bollinger Fibo  Pro   is a sophisticated, all-in-one trading system for MetaTrader 5 that merges two legendary concepts into a single, powerful tool. It enhances standard
Fixed Volume Profile
Carlos Pascual Perez Maturano
This indicator, titled "Fixed Volume Profile.mq5", is a custom tool for MetaTrader 5 (MQL5) designed to calculate and display a Volume Profile over a user-defined fixed time range. The Volume Profile shows the distribution of trading volume at different price levels during a specific period, helping to identify areas of high activity (such as Points of Control or POCs) and volume-based support/resistance areas. Main Functionality: Interactive Range: The indicator creates two vertical lines on
FREE
Volume Profile Multiple — Profils de Volume Multiples avec Buffers pour le Trading Algorithmique Fatigué de redessiner le Volume Profile bloc par bloc, en devant tout recalculer à chaque changement de timeframe ? Volume Profile Multiple trace automatiquement plusieurs profils de volume consécutifs sur le graphique, révélant où l'intérêt institutionnel s'est réellement concentré dans chaque section du marché — et pas seulement sur la dernière plage visible. Ce que l'indicateur fait pour vous L'in
Boom Crash SMC
Israr Hussain Shah
Here   our more valuable tools SMC Trend Trading   ,  Easy SMC Trading  ,  Institutional SMC Architect Volume Analysis Tools  ,  Volume flow Profile  ,  Market volume profile  , FVG with Volume  , Liquidity Heatmap Profile  ,  Volume Spread Analysis Deriv boom and crash index spike killer system you can use it only on m5 timeframe  follow the structure and get signal with alert on phone open trade set sl tp and enjoy easy analysis and trading made simple 
Here   our more valuable tools SMC Trend Trading   ,  Easy SMC Trading  ,  Institutional SMC Architect Volume Analysis Tools  ,  Volume flow Profile  ,  Market volume profile  , FVG with Volume  , Liquidity Heatmap Profile  ,  Volume Spread Analysis Boom: Take SELL signals only (price spikes up then crashes) Crash: Take BUY signals only (price drops then spikes up) SL goes beyond the line as labeled Interactive Market Watch Panel : A left-side sidebar showing real-time strength indicators (po
DRX Market Profile Master v4 — Market Profile institutionnel pour MetaTrader 5 Le Market Profile et l’analyse Time Price Opportunity (TPO) comptent parmi les méthodes les plus efficaces pour comprendre la véritable structure du marché. Le DRX Market Profile Master v4 implémente بالكامل cette méthodologie dans MetaTrader 5 et offre un ensemble de fonctionnalités comparable aux plateformes de trading professionnelles. L’indicateur calcule automatiquement pour chaque session quelles zones de prix o
Volume Analysis Trader looks at volume using a fixed average of volume. This averaging helps spot when volume is rising or declining. Also I have added volume spikes which are when volume suddenly is above the average. These help spot market reversals. This will hep a trader look for the following in their trading: Rising volume during a rally shows trend is strong. Falling volume on a rally shows trend is weakening. As a rule of thumb on daily charts if current volume is higher than yesterda
Volume Profile Density V2.40 Affiche la répartition du volume par niveau de prix, mettant en évidence les zones d’intérêt institutionnel. Contrairement au volume classique, il montre où le volume s’est réellement concentré. Principe : Barres horizontales = volume échangé à chaque prix Barre plus longue → volume plus élevé Zones rouges = supports et résistances majeurs Utilisation principale : Identifier les zones de support/résistance réelles Déterminer le POC (Point of Control) Définir la Value
FREE
Volume Profile FREE — Multi-Session Heatmap (POC · VAH · VAL) See where trading activity actually occurs—not just where price moves. This indicator builds a clear, color-coded Volume Profile Heatmap directly on your chart and highlights the market's most important price levels: the Point of Control (POC) and the Value Area (VAH/VAL) , where price is most likely to react.
FREE
Market Profile TPO Indicator
Thiago Pereira Pinho
5 (1)
The MarketProfileTPO indicator for MetaTrader 5 is a powerful tool designed to bring the Market Profile concept, based on Time Price Opportunity (TPO) analysis , directly onto your main chart window. This indicator calculates and displays the price distribution over a specified period, highlighting key areas of market activity and concentration. It is particularly optimized for high-volatility instruments like NAS100, US30, and XAUUSD when used on the M1 (1-minute) timeframe, offering a detailed
FREE
VWAP + Volume Profile Combined Indicator FREE Launch Offer OVERVIEW Professional combination of VWAP (Volume Weighted Average Price)  and Volume Profile in a single MT5 indicator. This powerful tool  combines two of the most respected institutional trading tools  into one seamless display. KEY FEATURES 1. VWAP with 6 calculation modes 2. Volume Profile with Value Area analysis 3. Point of Control identification 4. Standard deviation bands 5. Dynamic color changing 6. Separate buy/sell vol
FREE
MTF VWAP Indicator - Quick Overview   This indicator shows you where institutional money is flowing across multiple timeframes using Volume Weighted Average Price (VWAP) to identify high-probability trading zones. New version has VWAP bands plotting capability if user enabled and display panel (whose background changes colour on confluence) can be toggled on/off.      What It Actually Does:     1. Tracks Smart Money Levels: - Shows Daily, Weekly, and Monthly VWAP lines where big players (banks,
Cet indicateur est basé sur la transformée de Hartley discrète. L'utilisation de cette transformation vous permet d'appliquer différentes approches lors du traitement des séries chronologiques financières. Une caractéristique distinctive de cet indicateur est que ses lectures ne se réfèrent pas à un point sur le graphique, mais à tous les points de la période de l'indicateur. Lors du traitement d'une série temporelle, l'indicateur permet de sélectionner différents éléments de la série temporell
Market Marker MT5
Evgeny Shevtsov
3.8 (5)
The indicator displays peak levels of activity formed by the maximum volume, tracks the correlation of the candles on all timeframes (from the highest to the lowest one). Each volume level is a kind of key trading activity. The most important cluster is inside a month, week, day, hour, etc. Indicator operation features A volume level receives Demand status if the nearest volume level located to the left and above has been broken upwards. A volume level receives Supply status if the nearest volu
Easy SMC Trading
Israr Hussain Shah
3.8 (5)
Analyse de Tendance Structurelle avec RR Auto et Scanner BOS Version : 1.0 Présentation L'analyse de Tendance Structurelle avec RR Auto est un système de trading complet conçu pour les traders qui s'appuient sur l'analyse de l'action des prix et de la structure du marché. Elle combine un filtre de tendance lissé avec la détection des points de swing et les signaux de cassure de structure (BOS) afin de générer des configurations de trading à forte probabilité. La caractéristique phare de cet
FREE
VOLUME PROFILE SAF-XII Analyse Market Profile Professionnelle pour MT5 (L'indicateur idéal pour le trading de type Grid) QU'EST-CE QUE LE VOLUME PROFILE ? Le Volume Profile est un outil institutionnel qui affiche l'activité de trading à des niveaux de prix spécifiques, contrairement aux indicateurs de volume classiques qui montrent le volume en fonction du temps. Il révèle OÙ les transactions ont eu lieu, aidant ainsi à identifier : ZONES DE VALEUR (VAH/VAL) – Niveaux de prix où la majorité des
VWAP Indicator MT5
Kyra Nickaline Watson-gordon
Description : VWAP (Volume-Weighted Average Price) is the ratio of the value traded to total volume traded over a particular time horizon. It is a measure of the average price at which pair is traded over the trading horizon. Read More. All Symbols and All Timeframes are supported. Indicator Inputs :     VWAP Mode : Mode of VWAP Calculation. Options can be selected : Single,Session,Daily,Weekly,Monthly     Volumes : Real Volumes,Tick Volumes     Price Type : Used price for calculating. O
Volume Delta Candles offer a straightforward way to analyze trading activity within each candle, making it easier to see what's happening without needing an extra volume indicator. This tool uses lower timeframe or real-time data to show the percentage of buying and selling volume within a candle as a colored bar. Make sure you understand Volume and Volume Delta before jumping in. If you’re not sure, reach out to me first for a quick rundown. But if you're already familiar, you're good to go! Ke
Daily & Composite Volume Profile   This is a professional-grade market profile tool designed for MetaTrader 5. It utilizes a   Dual-Profile System   to visualize supply, demand, and liquidity concentrations. Key Features Left Side: Daily Session Profiles Automatically identifies the start and end of every trading day. Generates a unique Volume Profile for each individual day. Allows you to see how value migrated from yesterday to today (e.g., Is today's volume higher or lower than yesterday?).
BoxChart MT5
Evgeny Shevtsov
5 (7)
The market is unfair if only because 10% of participants manage 90% of funds. An ordinary trader has slim changes to stand against these "vultures". This problem can be solved. You just need to be among these 10%, learn to predict their intentions and move with them. Volume is the only preemptive factor that faultlessly works on any timeframe and symbol. First, the volume appears and is accumulated, and only then the price moves. The price moves from one volume to another. Areas of volume accumu
AvgVolumes
Marco Montemari
5 (1)
This indicator is based on Volumes standard indicator, calculates the average of Volumes based on the last N bars set by users, and if the value of the volume is bigger then a set % respect the average a different color will be used. The indicator is shown in a separate indicator window. This version has now a limitation in setting the % about the threshold. If you are interested to set threshold consider to buy the PRO version ( https://www.mql5.com/en/market/product/35925 ) If you want to use
FREE
GoldenX Entry MT5
VividMind Digital Solutions
5 (16)
GoldenX Entry est un indicateur MT5 doté d’un algorithme adaptatif Smart Entry Trend, d’un système de scoring des signaux, d’un détecteur de régime de marché et d’un filtre de volatilité. Chaque signal inclut un niveau d’entrée calculé, trois niveaux de Take-Profit (TP1, TP2, TP3) ainsi qu’un niveau de Stop-Loss. Il est construit sur plusieurs couches analytiques conçues pour s’adapter à différentes conditions de marché, combinant un système analytique multicouche avec un optimiseur intégré et u
Here   our more valuable tools SMC Trend Trading   ,  Easy SMC Trading  ,  Institutional SMC Architect Volume Analysis Tools  ,  Volume flow Profile  ,  Market volume profile  , FVG with Volume  , Liquidity Heatmap Profile  ,  Volume Spread Analysis 1. Institutional Supply & Demand Zones Auto-Detection:   Automatically draws zones at valid pivot points. Smart Extension:   Zones extend into the future for easy visibility but automatically cut off when price breaks them. Mitigation Logic:   When
Forex Volume MT5
KEENBASE SOFTWARE SOLUTIONS
KT Forex Volume affiche le volume d'achat et de vente d'une paire de devises sous forme d'histogramme coloré. Le volume est composé des transactions d'achat et de vente sur un actif. Sur le marché des changes (Forex) : Si le volume d'achat dépasse le volume de vente, le prix de la paire de devises augmente. Si le volume de vente dépasse le volume d'achat, le prix de la paire de devises diminue. Fonctionnalités Évitez les mauvaises transactions en les confirmant avec les données de volume par ti
Les acheteurs de ce produit ont également acheté
Trend Sniper X
Sarvarbek Abduvoxobov
4.9 (40)
Trend Sniper X est un indicateur de suivi de tendance multi-unités de temps pour MetaTrader 5 qui aide les traders à identifier la direction de la tendance et les points d'inversion potentiels avec clarté et précision. pour MT4: https://www.mql5.com/en/market/product/193245 Informations sur le prix : Le prix actuel est un prix promotionnel et est susceptible de changer lors des prochaines mises à jour et nouvelles fonctionnalités. Offre bonus : Pour obtenir GRATUITEMENT l'Auto-Trade Assistant E
Smart Trend Trading System — MetaTrader 5 Après votre achat, envoyez-moi un message sur MQL5 pour recevoir GRATUITEMENT Smart Universal Expert Advisor, ainsi que le cours en ligne, le manuel PDF et l’accès au groupe privé. STTS réunit la direction de la tendance, les signaux d’entrée et de sortie, les zones de retournement et les niveaux de prix importants directement sur votre graphique. Suivez le système manuellement ou connectez un EA compatible distinct pour une exécution automatique selon l
ARIPoint
Temirlan Kdyrkhan
1 (4)
ARIPoint is a powerful trading companion designed to generate high-probability entry signals with dynamic TP/SL/DP levels based on volatility. Built-in performance tracking shows win/loss stats, PP1/PP2 hits, and success rates all updated live. Key Features: Buy/Sell signals with adaptive volatility bands Real-time TP/SL/DP levels based on ATR Built-in MA Filter with optional ATR/StdDev volatility Performance stats panel (Success, Profit/Loss, PP1/PP2) Alerts via popup, sound, push, or email Cu
Zoryk Gold
Reda El Koutbane
5 (15)
ZORYK — Système avancé de signaux XAUUSD pour MetaTrader 5 Vous connaissez certainement cette sensation. Vous passez du temps à analyser l’or. Vous attendez le bon point d’entrée. Vous ouvrez enfin la position, puis le prix commence immédiatement à évoluer contre vous. Vous fermez trop tôt, déplacez le Stop Loss ou hésitez pendant quelques secondes. Ensuite, le marché atteint exactement l’objectif que vous aviez initialement prévu, mais sans vous dans la position. Le problème n’était pas toujour
SuperScalp Pro
Van Minh Nguyen
4.66 (35)
SuperScalp Pro - Professional Multi-Layer Confluence Scalping System SuperScalp Pro est un indicateur avancé de scalping qui améliore le Supertrend classique grâce à plusieurs filtres intelligents de confirmation. Il aide à identifier des opportunités de Buy/Sell présentant une probabilité plus élevée, tout en réduisant considérablement les faux signaux. Des flèches Buy et Sell claires apparaissent directement sur le graphique, tandis que les niveaux de Stop Loss et Take Profit basés sur l’ATR s
Gann Made Easy   est un système de trading Forex professionnel et facile à utiliser qui est basé sur les meilleurs principes de trading en utilisant la théorie de mr. WD Gann. L'indicateur fournit des signaux d'ACHAT et de VENTE précis, y compris les niveaux Stop Loss et Take Profit. Vous pouvez échanger même en déplacement en utilisant les notifications PUSH. VEUILLEZ ME CONTACTER APRÈS L'ACHAT POUR RECEVOIR GRATUITEMENT DES INSTRUCTIONS DE TRADING ET D'EXCELLENTS INDICATEURS SUPPLÉMENTAIRES! V
SMC Intraday Formula
VividMind Digital Solutions
5 (26)
Commençons par être honnêtes. Aucun indicateur ne vous rendra rentable à lui seul. Si quelqu’un vous dit le contraire, il vous vend un rêve. Tout indicateur qui affiche des flèches parfaites d’achat/vente peut être rendu impeccable — il suffit de zoomer sur la bonne partie de l’historique et de capturer uniquement les trades gagnants. Nous ne faisons pas cela.  SMC Intraday Formula est un outil. Il lit la structure du marché pour vous, identifie les zones de prix à la probabilité la plus élevée
Un nouveau Roi en ville - Indicateur + Gestion des ordres (TP1 + TP2 + TP3) + Envoi optionnel de signaux Telegram INCLUS (GRATUIT) (SYSTÈME COMPLET DE TRADING et DE SIGNAUX) Notre meilleur EA pour l’Or : Gold Slayer Cet indicateur inclut une stratégie avancée, un système de trading avec gestion des ordres personnalisable ainsi qu’un système de retour à la moyenne combinant des extensions d’enveloppes, soutenu par plusieurs filtres intelligents de confirmation comme le RSI afin de détecter des en
Neuro Poseidon MT5
Daria Rezueva
4.75 (52)
Neuro Poseidon is a new indicator by Daria Rezueva. It combines precise trading signals with adaptive TP/SL levels - creating best possible trades as a result! Message me and get  Neuro Poseidon Assistant  as a gift to automize your trading process! What makes it stand out? 1. Proven profitability on all assets and timeframes 2. Only confirmed BUY and SELL signals present on the chart 3. Adaptive TP & SL levels generated by the software for each trade 4. Easy to understand - suitable for al
Auto Optimized SpeedAngle est un système de vectorisation du momentum de niveau institutionnel qui élimine l'ajustement de courbe ( curve-fitting ) grâce à une optimisation continue par avancement ( Walk-Forward Optimization , WFO). Plutôt que de s'appuyer sur des entrées statiques qui se dégradent lorsque les régimes de marché changent, l'indicateur recalibre dynamiquement ses paramètres en utilisant une validation hors échantillon ( Out-of-Sample , OOS), garantissant ainsi que les signaux affi
La légende est de retour : Entry Points Pro 10. La relance de l'indicateur légendaire qui s'est maintenu 3 ans dans le Top-3 du MQL5 Market. Des centaines d'avis enthousiastes (589 sur les deux versions), des milliers de traders l'utilisent chaque jour, 31 000+ téléchargements de la démo   MT4+MT5 . J'ai lu chacun de vos avis publiés en cinq ans — et au lieu de promettre, j'ai intégré les réponses directement dans la version 10. Par un auteur présent sur les marchés depuis 1999, qui tient à l'ho
FiboSniper Pro
Van Minh Nguyen
5 (3)
FiboSniper Pro – Multi-Filter Fibonacci System with Auto SL/TP and Control Panel FiboSniper Pro est un indicateur technique qui combine des Fibonacci Envelopes dynamiques avec plusieurs filtres de confirmation afin de générer des signaux Buy et Sell sélectionnés. Les niveaux de Fibonacci sont calculés à partir de Moving Average et ATR, puis filtrés par ADX, EMA, RSI, ATR, Volume, Time et la structure des bougies. L’indicateur affiche directement sur le graphique les niveaux automatiques de Stop
Welcome to ENTRY IN THE ZONE AND SMC MULTI TIMEFRAME SPECIAL BENEFIT / FOR OUR MQL5 CUSTOMERS FREE ACCESS TO THE NEW TOOL  — COMING SOON — Learn more on our official website  : https://www.fableedge.net Entry In The Zone and SMC Multi Timeframe is a real-time market analysis tool based on Smart Money Concepts (SMC), designed to analyze market structure, price direction, and key trading zones. It supports both Single-Timeframe Analysis and Multi-Timeframe Analysis, providing a clearer view of the
Unix Scalper
Issam Kassas
4 (4)
Unix Scalper — MetaTrader 5 Après votre achat, envoyez-moi un message sur MQL5 pour recevoir GRATUITEMENT Smart Universal Expert Advisor, ainsi que le cours en ligne, le manuel PDF et l’accès au groupe privé. Repérez la configuration. Consultez le plan. Choisissez comment intervenir. UNIX Scalper réunit l’analyse du marché, les décisions BUY/SELL/WAIT et les niveaux Entry, Stop Loss, TP1 et TP2 dans un panneau organisé. VISUALISEZ LE SIGNAL ET LE PLAN • Des décisions claires : BUY, SELL ou WAIT.

M1 Sniper MT5
Oleg Rodin
5 (7)
M1 SNIPER   est un système d'indicateurs de trading facile à utiliser. Il s'agit d'un indicateur à flèche conçu pour l'unité de temps M1. Cet indicateur peut être utilisé seul pour le scalping sur l'unité de temps M1 ou intégré à votre système de trading existant. Bien que conçu spécifiquement pour le trading sur l'unité de temps M1, ce système peut également être utilisé avec d'autres unités de temps. Initialement, j'avais conçu cette méthode pour le trading du XAUUSD et du BTCUSD. Cependant, j
Adaptive Price Action Engine Achetez un indicateur, obtenez l'EA gratuitement Analyse auto-optimisée des tendances et des figures de chandeliers Multi-Timeframe Les marchés évoluent constamment, et tous les modèles de Price Action n’ont pas la même valeur dans toutes les conditions de marché. Adaptive Price Action Engine a été conçu pour s’adapter aux changements du marché en combinant structure de tendance, analyse Multi-Timeframe, figures de chandeliers et optimisation statistique au sein d’un
Tokyo mt5 Indicator
Vasiliy Strukov
5 (4)
Le Tokyo Indicator offre une vue d'ensemble visuelle et claire de l'orientation de la tendance, des signaux de trading potentiels et des conditions du marché. Sa ligne de tendance en escalier, codée par couleur, distingue les phases haussières (en bleu) des phases baissières (en magenta). Des flèches directionnelles associées mettent en évidence les opportunités d'achat et de vente potentielles lors des changements de tendance. Un tableau de bord intégré regroupe le signal actuel, l'orientation
Scalper Vault   est un système de scalpage professionnel qui vous fournit tout ce dont vous avez besoin pour un scalpage réussi. Cet indicateur est un système de trading complet qui peut être utilisé par les traders de forex et d'options binaires. Le délai recommandé est M5. Le système vous fournit des signaux fléchés précis dans le sens de la tendance. Il vous fournit également des signaux supérieurs et inférieurs et des niveaux de marché Gann. Les indicateurs fournissent tous les types d'alert
FX Trend MT5 NG
Daniel Stein
5 (6)
FX Trend NG : La Nouvelle Génération d’Intelligence de Tendance Multi-Marchés Vue d’ensemble FX Trend NG est un outil professionnel d’analyse de tendance multi-timeframe et de surveillance des marchés. Il vous permet de comprendre la structure complète du marché en quelques secondes. Au lieu de naviguer entre de nombreux graphiques, vous identifiez immédiatement quels instruments sont en tendance, où le momentum s’affaiblit et où plusieurs unités de temps sont alignées. Offre de Lancement – Ob
FX Power MT5 NG
Daniel Stein
5 (33)
FX Power : Analysez la force des devises pour des décisions de trading plus intelligentes Aperçu FX Power est l'outil essentiel pour comprendre la force réelle des principales devises et de l'or, quelles que soient les conditions du marché. En identifiant les devises fortes à acheter et les faibles à vendre, FX Power simplifie vos décisions de trading et révèle des opportunités à forte probabilité. Que vous suiviez les tendances ou anticipiez les retournements à l'aide de valeurs extrêmes de D
Smart Price Action Concepts — MetaTrader 5 Après votre achat, envoyez-moi un message sur MQL5 pour recevoir GRATUITEMENT Smart Universal Expert Advisor, ainsi que le cours en ligne, le manuel PDF et l’accès au groupe privé. Observez la structure. Identifiez les zones. Construisez votre plan de trading. Réunissez Smart Money Concepts (SMC), analyse de style ICT et action des prix sur un graphique organisé. Identifiez la structure du marché, les blocs d’ordres, les niveaux de référence de liquidit
Power Candles MT5
Daniel Stein
4.58 (12)
Power Candles V3 - Indicateur de force à optimisation automatique Power Candles V3 transforme la force des devises et des instruments en un plan de trading exploitable sur chaque graphique auquel il est associé. Au lieu de se contenter de colorer les bougies, il effectue une optimisation automatique en temps réel en arrière-plan et vous fournit les meilleurs niveaux de Stop Loss, Take Profit et seuils de signal pour le symbole que vous avez sous les yeux. Un simple clic suffit pour l'adopter en
M1 Quantum MT5
Hamed Dehgani
4.2 (10)
Signaux de Trading en Direct avec M1 Quantum : Signal   (L’opération est exécutée automatiquement par le Quantum Trade Assistant , inclus gratuitement avec ce produit.) Dernières nouvelles : La version 1.64 a été publiée. Toutes les transactions disposent désormais d’un Stop Loss placé derrière les zones de support/résistance correspondantes. La fonction Smart Close a également été améliorée afin d’augmenter les performances de l’EA dans cette version. Depuis le 9 août, le signal en direct fonc
Market Structure Order Block Dashboard MT5 est un indicateur MT5 conçu pour les traders qui veulent lire la structure de marché et les principales zones de réaction du prix directement sur le graphique. Il combine BOS, ChoCH, Order Blocks, Fair Value Gaps (FVG), Liquidité, Kill Zones, Volume Profile, et un dashboard compact pour une analyse rapide. Cet indicateur s'adresse aux traders qui utilisent la structure de marché, les concepts ICT et Smart Money comme cadre de décision. Il peut aider à r
Atomic Analyst MT5
Issam Kassas
4.47 (60)
Atomic Analyst — MetaTrader 5 Après votre achat, envoyez-moi un message sur MQL5 pour recevoir GRATUITEMENT Smart Universal Expert Advisor, ainsi que le cours en ligne, le manuel PDF et l’accès au groupe privé. Atomic Analyst réunit l’action des prix, la direction de la tendance, les signaux d’entrée et de sortie, le Stop Loss et plusieurs niveaux de Take Profit directement sur votre graphique. REPÉREZ LE SIGNAL. COMPRENEZ LA CONFIGURATION. Atomic Analyst présente son analyse sous forme d’inform
Crystal Heikin Ashi Signals
Muhammad Jawad Shabir
5 (4)
Crystal Heikin Ashi Signals—Professional Trend & Signal Detection Indicator Advanced Heikin Ashi Visualization with Intelligent Signal System for Manual & Automated Trading Final Price: $149 ---------> Price goes up $10 after every 10 sales . Limited slots available — act fast . Overview User Guide PDF Crystal Heikin Ashi Signals is a professional-grade MetaTrader 5 indicator that combines pure Heikin Ashi candle visualization with an advanced momentum-shift detection system. Designed for both m
Divergence Bomber
Ihor Otkydach
4.89 (94)
Chaque acheteur de cet indicateur reçoit également gratuitement : L’outil exclusif « Bomber Utility », qui accompagne automatiquement chaque opération de trading, fixe les niveaux de Stop Loss et de Take Profit, et clôture les positions selon les règles de la stratégie Des fichiers de configuration (set files) pour adapter l’indicateur à différents actifs Des set files pour configurer le Bomber Utility selon différents modes : « Risque Minimum », « Risque Équilibré » et « Stratégie d’Attente »
Quant Direction MT5
Georgios Kalomoiropoulos
Quant Direction est un outil d'analyse de marché 3D. Il fournit une analyse de marché parfaitement objective, basée sur un algorithme, en calculant des écarts précis en pourcentage sur différents paramètres. Développé à l'aide d'outils de modélisation avancés basés sur l'IA et soumis à des tests rigoureux, cet algorithme analyse le marché avec une précision inégalée. Vous pouvez analyser n'importe quelle paire de devises ou instrument financier sur la plateforme. Que vous pratiquiez le trading à
Smc Pro ToolKit
Talal N Z Aljarusha
5 (13)
SMC PRO TOOLKIT — SMART MONEY ANALYSIS & STRUCTURED TRADE PLANNING SMC Pro ToolKit is a professional Smart Money Concepts analysis workspace for MetaTrader 5. It combines market structure, multi-timeframe analysis, institutional price zones, setup evaluation, confirmation tools, volume context, alerts, and risk planning inside one organized chart environment. One workspace. Multiple layers of confirmation. One structured trading plan. OPEN COMPLETE USER GUIDE MULTI-CONDITION SETUP ENGINE At
Btmm state engine pro
Garry James Goodchild
5 (4)
BTMM State Engine Pro by G-Labs — Beat The Market Maker indicator for MetaTrader 5. Asian session range, London and New York kill zones, level progression (L1/L2/L3), peak formation detection (PFH/PFL), entry signals, and a multi-pair scanner from one chart. Stop scanning charts one pair at a time. The State Engine tracks the BTMM daily cycle automatically — Asian box, room boundaries, level blocks, peak formations, and filtered entries — while the scanner dashboard shows level, peak status, d
Plus de l'auteur
See Asia, London and New York as real high-low boxes, with optional fills and opening-window overlays. BrioQuant Trading Sessions draws Asia, London and New York as boxes fitted to each session's actual high and low. Choose broker time or GMT with automatic broker-offset handling, then add optional fills, labels and opening-window boxes. Features: - Boxes hug each session's real range, not arbitrary full-height bands - Optional background fills, auto-tinted from your session colours - Optional
FREE
BrioQuant Day and Week Separators draws clean daily separators with weekday labels, emphasises the first trading day of each week, and marks bank holidays from the MT5 economic calendar - filtered to your symbol's currencies by default, so the chart shows the holidays that matter to what you trade. Features: - Daily separators with weekday name labels; weekends skipped automatically - Week-start line in its own colour and weight, so Mondays stand out at a glance - Bank-holiday markers from the b
FREE
BrioQuant Dollar Index
Mitchell Dean Ede
5 (1)
The US Dollar Index on your chart, built live from your own broker's six currency pairs. The dollar index is the cleanest read there is on whether the dollar itself is moving, or whether it is the other side of your pair doing the work. When EURUSD falls you cannot tell from EURUSD alone whether the euro is weak or the dollar is strong. The index tells you. Put it under any chart and you are looking at the dollar on its own terms. It replicates the ICE US Dollar Index, widely quoted as DXY. Same
FREE
BrioQuant Break Even
Mitchell Dean Ede
5 (1)
One line showing where every open trade on this symbol, taken together, comes out flat. Scale into a position five times and the line tells you the price you need back, with the live P&L beside it. It is the break-even, not the average entry Averaging the entry prices is not the price that makes you flat. Swap accrues nightly and commission is charged on every lot, so the real break-even sits above the average entry on a long book and below it on a short one, and it drifts as swap builds. This s
FREE
Four pivot methods, three reference periods and labels that stay where you place them. BrioQuant Pivot Points plots Classic, Fibonacci, Camarilla or Woodie levels from the previous completed period. Choose Daily, Weekly or Monthly pivots, then place labels at the period start, after the newest candle, in the margin or at the chart edge. Features: Methods: Classic / Fibonacci / Camarilla / Woodie; periods: Daily / Weekly / Monthly Label placement: line start, after the newest candle, centred in t
FREE
BrioQuant Anchored VWAP plots the volume weighted average price from a chosen anchor point, with optional standard deviation bands. Alongside the usual calendar anchors it can re-anchor at the start of each trading session. Asia, London and New York each get their own developing VWAP, which resets when that session opens and stops when it closes. The hour inputs match the BrioQuant Trading Sessions indicator, so the two line up on the same chart. Anchor modes Session - Asia, London or New York,
FREE
Renko bricks drawn as time-anchored boxes on your ordinary chart, so brick structure and real time stay visible together. A renko brick prints when price moves a set distance, ignoring how long that takes. That strips out the sideways noise a time chart is full of. The usual way to see them is a separate offline chart, which loses the clock. This draws the same bricks over your normal candles instead, so you keep the time axis, your other indicators, and your orders. How the bricks are built Onl
FREE
Heiken Ashi candles drawn in the main chart window, with the option to hide the chart's own candles so only the Heiken Ashi bodies remain. Heiken Ashi averages each bar with the one before it. Direction changes less often than on standard candles, which makes a trend easier to hold and a stall easier to see. It is a different way of drawing the same price, not a signal. What it does Plots Heiken Ashi open, high, low and close as coloured candles Separate colours for rising and falling candles Op
FREE
Keep figures, halves and quarters visible without letting the grid take over the chart. BrioQuant Round Price Levels draws figures, halves and quarters as three clearly weighted tiers. The spacing adapts to the instrument, while separate line and label controls keep important prices readable on both light and dark charts. Features: Three tiers - figures (strongest), halves, quarters - each with its own colour, width and style Spacing adapts per instrument: gold, FX majors, JPY pairs, indices, cr
FREE
BrioQuant Position Monitor keeps your floating result where your eyes already are: beside the newest candle at the current price. Show this symbol's positions or the whole account, in cash and as a percentage of balance or equity, with optional entry lines and a per-position label for every open trade on the chart symbol. Features: - Floating readout rides the newest candle at current price height - no corner panel to glance away at - Scope: this symbol or the whole account; swap included or exc
FREE
Your risk, sized before the trade. Set risk once - percent of balance, percent of equity, or a fixed amount - and the panel computes the lot for every trade from your stop distance. Drag the ENTRY, SL and TP lines on the chart; each carries a live label with price, money at risk and R multiple, with shaded risk and reward zones. An entry line placed away from price becomes a pending order. Orders you can account for. Every order, market or pending, is written to a durable journal before it is se
FREE
The euro index on your chart, built live from your own broker's five euro pairs. When EURUSD falls you cannot tell from EURUSD alone whether the euro is weak or the dollar is strong. An index answers it. Put this under any chart and you are looking at the euro on its own terms, measured against the pound, the yen, the franc and the krona as well as the dollar. It uses the New York Board of Trade Euro Currency Index formula. EUR/USD 31.55% EUR/GBP 30.56% EUR/JPY 18.91% EUR/CHF 11.13% EUR/SEK 7.85
FREE
Compare POC and value-area placement across Asia, London and New York sessions. BrioQuant Session Volume Profile builds a profile for the selected Asia, London or New York session, or place one profile inside every recent session window. Compare how POC and value area move, overlap or remain stable from session to session while retaining the range modes for individual chart studies. Two session workflows in addition to the range modes: Session mode: Asia, London or New York. Auto follows the act
Filtrer:
CodeFaceCrunch
561
CodeFaceCrunch 2026.09.04 00:37 
 

L'utilisateur n'a laissé aucun commentaire sur la note

Répondre à l'avis