Market Profile TPO Multi Period Profiles MT4

Market Profile TPO

Market Profile TPO is a multi-period Time-Price-Opportunity (TPO) indicator for MetaTrader 4. It builds price profiles from time data and displays the Point of Control (POC), the Value Area (VAH and VAL), the Initial Balance (IB), Single Prints, a volume overlay and profile merging on the chart. It is written entirely in MQL4 and does not use DLLs or external files.

What the indicator draws

  • TPO profile: each price level is tagged with the time slice in which it traded. Displayed as letters or filled blocks.
  • POC (Point of Control): the price level where the market spent the most time during the profile period.
  • Value Area: the price range containing the configured percentage of TPO prints. VAH is the upper boundary, VAL is the lower boundary.
  • Initial Balance: the range of the first hour of the session.
  • Single Prints: price levels that were printed only once and not revisited.
  • Volume Value Area and Volume POC: volume-based versions of the Value Area and the POC, drawn alongside the TPO versions, so both views can be compared on the same profile.
  • Candle overlay: candlesticks or OHLC bars drawn over the profile. It can be switched off with one input.

How it works

The indicator divides each profile period into time slices. For example, a Daily profile uses 30-minute slices. Every price level touched during a slice receives that slice's tag, which forms the lettered profile shape. The level with the most tags becomes the POC. The Value Area is the band around the POC that contains the configured percentage of tags. Single Prints are levels that carry only one tag.

Render modes

The profile can be displayed in six modes, selected with one input:

  1. Profile: classic Market Profile shape.
  2. Unfolded: each time slice drawn separately.
  3. Profile (Histogram): histogram-style view.
  4. MP + VP Outline: TPO profile with volume outline.
  5. TPO Histograms: TPO prints stacked per price level.
  6. TPO H + VP Outline: TPO histogram with volume outline.

Profile periods

Eleven profile periods are supported: 1 minute, 5 minutes, 15 minutes, 30 minutes, 1 hour, 4 hours, Daily, Weekly, Monthly, Quarterly and Yearly. The period can be matched to the trading horizon of the chart.

Profile merging

Adjacent profiles of the same period can be merged into a single composite profile and unmerged again. The change is applied immediately, without reattaching the indicator.

Disk cache

Calculated profile data is saved to disk automatically. When the indicator is reloaded or the terminal is restarted, profiles are loaded from the cache instead of being recalculated. The cache is invalidated when the structural setup changes: profile period, session hours, tick size or days back.

Input parameters

The input parameters are grouped by function:

  • Profile: profile period, number of profiles, tick size, ticks per bar, Value Area percentage, session start and end (hours and minutes).
  • Display: show Initial Balance lines, show Single Prints, Singles outside Value Area only, merge and unmerge.
  • Render: render mode, TPO style (letters or blocks), normal profile width percentage.
  • Lines and fills: POC line color and width, VA line color and width, VA fill color, VP POC color, VP VA color, IB line color.
  • TPO colors: letter color inside the Value Area, letter color outside the Value Area, block colors, POC block color.
  • Candle overlay: candlestick, bar (OHLC) or off; bull color, bear color, open marker color, close marker color.
  • Volume outline: outline color and line width.

Setup

  1. Attach the indicator to a chart.
  2. Select the profile period (default is Daily).
  3. Set the tick size to match the symbol. This is a one-time setup per symbol; for example 0.0001 for many forex symbols and 0.1 for many index symbols.
  4. Optionally narrow the session hours for session-only profiles.
  5. POC, Value Area, Initial Balance lines, Single Prints and the candle overlay are enabled by default.

Compatibility

MetaTrader 4 only. All timeframes. Works on forex, indices, crypto, equities and commodities symbols.

Limitations

  • Tick size must match the symbol's tick, otherwise profile levels do not align with real prices. One-time setup per symbol.
  • Merging works between adjacent profiles of the same period, not across different period modes on the same chart.
  • Single Prints are reconstructed from the chart timeframe. If the chart timeframe is coarser than the profile's sub-period, detection accuracy depends on the available chart data.
  • The candle overlay is drawn over the profile and can be switched off with one input.

Please contact me after purchase via the MQL5 messaging system if you have any questions about setting up the indicator for your symbol. I respond to all messages.

Önerilen ürünler
İşlem hacimlerine ilişkin okumaları hesaplayan teknik bir gösterge. Histogram biçiminde, ticaret enstrümanının hareket gücünün birikimini gösterir. Yükseliş ve düşüş yönleri için bağımsız hesaplama sistemlerine sahiptir. Herhangi bir ticaret enstrümanı ve zaman dilimi üzerinde çalışır. Herhangi bir ticaret sistemini tamamlayabilir. Gösterge değerlerini yeniden çizmez, sinyaller mevcut mum üzerinde görünür. Kullanımı kolaydır ve grafiği yüklemez, ek parametre hesaplamaları gerektirmez. Değiştiril
Blahtech Market Profile
Blahtech Limited
4.53 (15)
Was: $249  Now: $99   Market Profile defines a number of day types that can help the trader to determine market behaviour. A key feature is the Value Area, representing the range of price action where 70% of trading took place. Understanding the Value Area can give traders valuable insight into market direction and establish the higher odds trade. It is an excellent addition to any system you may be using. Blahtech Limited presents their Market Profile indicator for the MetaTrader community. Ins
Volume Profile Sniper v11.1 – Piyasa analizi için kapsamlı bir araç  Ticarete profesyonel yaklaşım Volume Profile Sniper v11.1, piyasa durumunun kapsamlı değerlendirmesine dayalı olarak net sinyaller sağlayan tek bir göstergede 15'ten fazla temel filtreyi birleştirir.  Temel özellikler Hacim dengesizliği analizi – algoritma, her mumda alıcıların ve satıcıların oranını hesaplar ve bir tarafın baskın olduğunu bildirir (ayarlanabilir eşik %50 ile %90 arasındadır). Çok seviyeli sinyal filtreleme
Time Bubble ***Specialized for GBPJPY 1H time frame*** (tested for two years with success rates about 82%) Time Circle's smart algorithm detects the price circles with time . give strong signals at the right time as result of combine the price and time. our team spent months to develop this indicator specially for GBPJPY ..with high success rates about 82% win trades over two years .tested from December 2016 to November 2018. *** in last two years total signals 1012 with 829 Wins and 183 Lo
Money Flow Profile MT5 HERE   Here   our more valuable tools SMC Trend Trading   ,  Easy SMC Trading  ,  Institutional SMC Architect Volume Analysis Tools  ,  Volume flow Profile  ,  Market volume profile  , FVG with Volume  , Liquidity Heatmap Profile  ,  Volume Spread Analysis This Master Edition is engineered for clarity and speed, featuring a unique Auto-Theme Sync system that instantly beautifies your chart layout upon loading. Key Features: True Money Flow Calculation: Goes beyond stand
Simply The Best Pro
Szymon Palczynski
5 (1)
This indicator displays the histogram and arrows on chart. When Simple The Best Pro are placed on a chart, they identify the trend.  The color of may be blue or red. The blue color stands for upside moves and the red color stands for downside trends. The indicator offers to set Stop Loss (SL) and  Take Profit (TP)  setting. The default value is ATR. Indicator has automatic optimization. The STB is a unique indicator that shows the tendency (button Bars) of a particular signals. The STB tells us
Resmi BlueDigitsFx Ekosistemi Erişimi Altyapı güncellemelerine, işlem kaynaklarına, ürün yayınlarına ve resmi BlueDigitsFx ekosistemine erişim sağlayın. Telegram Ekosistemi Web Sitesi MT5 Sürümü BlueDigitsFx Spike And Strike Reversal MT4 — Piyasa Dönüşleri ve Momentum Analizi İçin Bileşik Osilatör BlueDigitsFx Spike And Strike Reversal , yatırımcıların potansiyel piyasa dönüşlerini, momentum değişimlerini ve tükenme koşullarını belirlemelerine yardımcı olmak için birden fazla gösterge sinyal
Volume Compair
Thiago Pereira Pinho
5 (1)
Professional Cumulative Delta & Volume Median Indicator Track   real buying/selling pressure   with this powerful volume analysis tool. The   Volume Compare Indicator   combines   Cumulative Delta   and   Volume Medians   to help you identify institutional activity, imbalances, and potential reversals. Key Features: Cumulative Delta Histogram   – Visualizes net buying vs. selling volume in real-time. Buy/Sell Volume Medians   – Horizontal lines showing average buy & sell volume levels. Smart Vo
First and foremost, the Insight Flow Indicator stands out as a Non-Repainting, Non-Redrawing, and Non-Lagging tool. This makes it a prime choice for both manual and algorithmic trading, ensuring reliable and consistent signals. User Manual: Settings, Inputs, and Strategy The Insight Flow Indicator leverages price action, strength, and momentum to provide a clear edge in the market. Equipped with advanced filters, it eliminates noise and false signals, enhancing trading potential. By using multip
We present you the indicator "Candle closing counter", which will become your indispensable assistant in the world of trading. That’s why knowing when the candle will close can help: If you like to trade using candle patterns, you will know when the candle will be closed. This indicator will allow you to check if a known pattern has formed and if there is a possibility of trading. The indicator will help you to prepare for market opening and market closure. You can set a timer to create a pre
Volume Profile, profesyonel ve kurumsal yatırımcılar tarafından kullanılan en güçlü analitik araçlardan biridir. Sadece ekranınızın alt kısmında işlemlerin ne zaman gerçekleştiğini gösteren geleneksel hacim göstergelerinin aksine Volume Profile, bu işlemlerin tam olarak hangi fiyat seviyelerinde gerçekleştiğini gösterir. Bu size piyasa yapısının net bir X-ışını vizyonunu vererek, akıllı paranın (smart money) ve kurumların pozisyonlarını tam olarak nerede biriktirdiğini veya dağıttığını görmenizi
Volume Profile: multi-mode, multi-profile, drawn on the price chart The indicator draws a volume profile directly on the price chart, together with the Point of Control (POC) line, the Value Area (VAH and VAL) and optional peaks and valleys. Instead of reading volume in a separate bottom panel, the volume is shown at the price levels where it was traded, so price and volume can be read in one place. What the indicator displays POC (Point of Control) line : the price level with the highest traded
Basic Support and Resistance Göstergimiz, teknik analizinizi artırmak için ihtiyacınız olan çözümdür.Bu gösterge, destek ve direnç seviyelerini grafikte yansıtmanıza olanak tanır/ MT5 sürümü Özellikler Fibonacci seviyelerinin entegrasyonu: Fibonacci seviyelerini destek ve direnç seviyelerinin yanı sıra görüntüleme seçeneğiyle, göstergemiz size piyasa davranışı ve olası tersine dönme alanları hakkında daha derin bir fikir verir. Performans Optimizasyonu: Genişletilmiş satırları yalnızca her ç
Market Profile 3
Hussien Abdeltwab Hussien Ryad
3 (2)
Market Profile 3 MetaTrader 4 indicator  — is a classic Market Profile implementation that can show the price density over time, outlining the most important price levels, value area, and control value of a given trading session. This indicator can be attached to timeframes between M1 and D1 and will show the Market Profile for daily, weekly, monthly, or even intraday sessions. Lower timeframes offer higher precision. Higher timeframes are recommended for better visibility. It is also possible t
FREE
Title : Market Bias Indicator - Oscillator-Based Trading Tool Introduction : Discover the potential of the "Market Bias Indicator," a revolutionary oscillator-based trading tool designed for precise market analysis. If you're in search of a robust alternative to traditional bias indicators, your quest ends here. Market Bias Indicator offers unparalleled accuracy in identifying market sentiment and is your gateway to confident trading decisions. Recommended Trading Pairs : Market Bias Indicator i
Here   our more valuable tools SMC Trend Trading   ,  Easy SMC Trading  ,  Institutional SMC Architect Volume Analysis Tools  ,  Volume flow Profile  ,  Market volume profile  , FVG with Volume  , Liquidity Heatmap Profile  ,  Volume Spread Analysis The Market Profile & Volume Profile Indicator is a powerful technical analysis tool designed to visualize market activity and price distribution over specific timeframes. Unlike standard technical indicators that focus solely on price over time, th
TWO PAIRS SQUARE HEDGE METER INDICATOR Try this brilliant 2 pairs square indicator It draws a square wave of the relation between your two inputs symbols when square wave indicates -1 then it is very great opportunity to SELL pair1 and BUY Pair2 when square wave indicates +1 then it is very great opportunity to BUY pair1 and SELL Pair2 the inputs are : 2 pairs of symbols         then index value : i use 20 for M30 charts ( you can try other values : 40/50 for M15 , : 30 for M30 , : 10 for H1 ,
Paid release: Delta Volume Profile Zones MT4 is a paid MetaCoderStore indicator. Use the product comments for setup questions, feature requests, and feedback for future updates. Delta Volume Profile Zones is a compact volume-profile indicator for traders who want price-level context without turning the chart into a crowded footprint screen. It builds a rolling profile from recent candles and marks the key zones traders usually watch: Point of Control, Value Area High, Value Area Low, high-volume
KT Double Top Bottom MT4
KEENBASE SOFTWARE SOLUTIONS
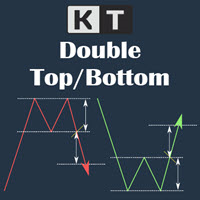
The double top bottom pattern is arguably one of the technical analysis's most popular chart patterns. These patterns are used to capitalize on recurring patterns and identify trend reversal patterns, thereby creating well-placed entry and exit levels. The KT Double Top Bottom is based on these patterns and fine-tunes the trade signal development process for traders. Features It's based on one of the most reliable trading patterns and brings some fine-tuning and automation to the process. Also
A tall upper shadow occurs when the price moves during the period, but goes back down, which is a bearish signal. A tall lower shadow forms when bears push the price down, but bulls pull it back up, which leaves a long line or shadow. This is considered a bullish signal. Some technical analysts believe a tall or long shadow means the stock will turn or reverse. Some believe a short or lower shadow means a price rise is coming. In other words, a tall upper shadow means a downturn is coming, while
NNFX Tool
Nguyen Thi Kieu Oanh
NNFX TOOL – The Essential Order Management Tool for the Modern Trader A "small but mighty" EA, designed to optimize your trading workflow: High Performance: Lightweight yet powerful operation, ensuring precise and efficient order execution. Versatile: Perfect for NNFX method followers, while being incredibly user-friendly for beginners and sophisticated enough for pro-traders. SPECIAL FEATURE - Mobile Trading Support: Automatically sets immediate Stop Loss (SL) and Take Profit (TP) for pending
FREE
VolumeProfile
Robert Hess
3.8 (5)
Descption: The Volume Profile displays detailed informations of historical trading activities at certain price levels (Market Profile). So you can locate the areas with the best prices in the market and get an advantage about other market participants. Features: Customizable Volume Profile / Market Profile Shows the "fair" Value Area with 70% of all Volume Shows critical low volume zones Shows VPOC, VAL and VAH Points Works on all timeframes Also available for MT5 ( https://www.mql5.com/en/mark
The Indicator show Daily Pivot Points. It is possible to specify the number of days to display. For forex it doesn't consider the sunday session data. It is possibile to modify the color, style and  width for every level.It is better to use this indicator with timeframe not higher than Н1. 4 Levels of support and resistance with also Intermediate Levels that is possible to hide. Pivot trading: 1.pp pivot 2. r1 r2 r3, s1 s2 s3 Pivot points have been a trading strategy for a long time, orig
Support and Resistance Zones MultiTimeframe
Mohamed Gamal Abdelnasser Yous Hashesh
A powerful indicator that highlights key market zones and helps traders identify potential opportunities across multiple timeframes. Designed for clarity and efficiency, it provides real-time alerts to keep you informed of important price levels. Key Features: Works on multiple timeframes: M1, M5, M15, M30, H1, H4, D1, W1, MN1. Customizable zone colors for each timeframe. Real-time alerts and notifications when price reaches significant zones. Automatically manages chart objects to keep your wo
-  Real price is 70$ - 50% Discount (It is 35$ now) Contact me for instruction, any questions! - New Update - Lifetime update free - Non-repaint - I just sell my products in Elif Kaya Profile, any other websites are stolen old versions, So no any new updates or support. Introduction Breakout Trend Scanner indicator works based on the Elliott Wave in technical analysis describes price movements in the financial market that are related to changes in trader sentiment and psychology and finds end o
Structural Equilibrium: A New Era of Adaptive Market Analysis As information technology advances and market participation grows, traditional analytical tools often face declining efficiency. Standard technical indicators frequently struggle to interpret the complexities of modern, algorithm-driven market structures. Structural Equilibrium was developed as a high-performance solution featuring a multi-level adaptive smoothing mechanism. This core logic allows the tool to maintain its analytical r
Smart Ai Levels Pro+ Wyckoff Theory. Volume Profile. Machine Learning. Institutional Zone Intelligence for Serious Traders This is a sophisticated trading indicator that combines Wyckoff theory, volume profile analysis, machine learning predictions, and multiple timeframe zone calculations. AI-powered Wyckoff zone indicator with real-time volume profile, machine learning reliability predictions, and multi-timeframe cycle analysis. Features 26+ dynamic S/R zones, priority strength markers, volum
Bu, bir mumun kapanış fiyatını tahmin eden bir göstergedir. Gösterge öncelikle D1 çizelgelerinde kullanılmak üzere tasarlanmıştır. Bu gösterge hem geleneksel forex ticareti hem de ikili opsiyon ticareti için uygundur. Gösterge, bağımsız bir ticaret sistemi olarak kullanılabilir veya mevcut ticaret sisteminize ek olarak hareket edebilir. Bu gösterge, mevcut mumu analiz ederek mumun gövdesi içindeki belirli güç faktörlerini ve önceki mumun parametrelerini hesaplar. Böylece gösterge, piyasa hareket
Here   our more valuable tools SMC Trend Trading   ,  Easy SMC Trading  ,  Institutional SMC Architect Volume Analysis Tools  ,  Volume flow Profile  ,  Market volume profile  , FVG with Volume  , Liquidity Heatmap Profile  ,  Volume Spread Analysis Trend Identification: Look for the color change. When candles turn Green , look for Buy opportunities. When they turn Red , look for Sell opportunities. Entry: Enter on the break of the trend line or on the pullback to the line. Stop Loss: Use the
Supply and Demand Indicator + FREE Currency Strength Meter ADD-ON Looking for a powerful tool that can help you identify the most reactive zones in the forex market? Our supply and demand indicator for MetaTrader 4 and 5 is exactly what you need. With its advanced algorithms and real-time analysis, this indicator helps traders of all experience levels make informed trading decisions. The supply and demand indicator is a cutting-edge tool that helps traders identify areas where buyers and seller
Bu ürünün alıcıları ayrıca şunları da satın alıyor
Trend SniperX MT4
Sarvarbek Abduvoxobov
5 (5)
Trend Sniper X , işlemcilerin trend yönünü ve olası dönüş noktalarını netlik ve hassasiyetle belirlemelerine yardımcı olan MetaTrader 5 için çoklu zaman dilimli bir trend takip göstergesidir. MT5 İçin: https://www.mql5.com/en/market/product/181101 Fiyat Bilgisi: Mevcut fiyat tanıtım amaçlıdır ve gelecek güncellemeler ile yeni özellikler eklendikçe değişebilir. Code2Profit Kanalı Çoklu Zaman Dilimi Analizi ile Piyasaya Hakim Olun! Trend Sniper X ile Kazanma Oranınızı Nasıl En Üst Düzeye Çıkarırsı
Scalper Vault
Oleg Rodin
5 (40)
Scalper Vault, gün içi işlemlerde istikrar yakalamak isteyen yatırımcılar için tasarlanmış, güçlü ve tam donanımlı bir alım satım sistemidir. Bu yüksek hassasiyetli gösterge; hem Forex hem de İkili Opsiyon yatırımcıları için kurumsal düzeyde analizler sunan, bağımsız ve eksiksiz bir alım satım sistemi işlevi görür. SATIN ALIM İŞLEMİNDEN SONRA BENİMLE İLETİŞİME GEÇİN; ALIM SATIM İPUÇLARIMI VE HARİKA BİR BONUSU ALIN! Tahmin yürütme zorunluluğunu ve karmaşık manuel analiz süreçlerini ortadan kaldır
Atomic Analyst
Issam Kassas
5 (14)
Atomic Analyst — MetaTrader 4 Ürün soruları, kurulum rehberliği veya teknik destek için bana doğrudan MQL5 üzerinden mesaj gönderin. İndikatör, karmaşık piyasa hesaplamalarını basit görsel sinyallere, renk kodlu mumlara, trend okumalarına, stop-loss seviyelerine ve traderların hızlıca anlayıp gerçek piyasa koşullarında kullanabileceği çoklu take-profit bölgelerine dönüştürür. Ana trading kullanım alanları: Scalping ve gün içi işlem: Hızlı karar alma, net oklar, uyarılar, mum renkleri ve yapılan
M1 Sniper
Oleg Rodin
4.97 (30)
M1 SNIPER kullanımı kolay bir işlem göstergesi sistemidir. M1 zaman dilimi için tasarlanmış bir ok göstergesidir. Gösterge, M1 zaman diliminde scalping için bağımsız bir sistem olarak kullanılabilir ve mevcut işlem sisteminizin bir parçası olarak kullanılabilir. Bu işlem sistemi özellikle M1'de işlem yapmak için tasarlanmış olsa da, diğer zaman dilimleriyle de kullanılabilir. Başlangıçta bu yöntemi XAUUSD ve BTCUSD ticareti için tasarladım. Ancak bu yöntemi diğer piyasalarda işlem yaparken de ya
PRO Renko Sistemi, RENKO grafikleri ticareti için özel olarak tasarlanmış son derece hassas bir ticaret sistemidir. Bu, çeşitli ticaret araçlarına uygulanabilen evrensel bir sistemdir. Sistemi etkin piyasa sana doğru ters sinyallerine erişim hakkı denilen ses nötralize eder. Göstergenin kullanımı çok kolaydır ve sinyal üretiminden sorumlu tek bir parametreye sahiptir. Aracı, seçtiğiniz herhangi bir ticaret aracına ve renko çubuğunun boyutuna kolayca uyarlayabilirsiniz. Yazılımımla karlı bir
Currency Strength Wizard , başarılı ticaret için size hepsi bir arada çözüm sağlayan çok güçlü bir göstergedir. Gösterge, birden çok zaman dilimindeki tüm para birimlerinin verilerini kullanarak şu veya bu forex çiftinin gücünü hesaplar. Bu veriler, şu veya bu para biriminin gücünü görmek için kullanabileceğiniz, kullanımı kolay para birimi endeksi ve para birimi güç hatları biçiminde temsil edilir. İhtiyacınız olan tek şey, işlem yapmak istediğiniz tabloya göstergeyi eklemektir ve gösterge size
Smart Trend Trading System, trend bilgilerini, giriş ve çıkış sinyallerini ve fiyat seviyelerini tek bir grafikte birleştiren bir MetaTrader 4 göstergesidir. Trend tespiti, dönüş bölgeleri, Smart Cloud, trailing stop mantığı, destek ve direnç, mum renklendirme, uyarılar ve çoklu zaman dilimi analizi dahil olmak üzere 10’dan fazla trading aracını tek bir sistemde birleştirir. Sistem, farklı piyasa koşullarında işlem yapmanıza yardımcı olmak için tasarlanmıştır: Trend piyasaları: Ana trendi belir
Neuro Poseidon MT4
Daria Rezueva
4.74 (46)
Neuro Poseidon is a new indicator by Daria Rezueva. It combines precise trading signals with adaptive TP/SL levels - creating best possible trades as a result! Message me and get  Neuro Poseidon Assistant  as a gift to automize your trading process! What makes it stand out? 1. Proven profitability on all assets and timeframes 2. Only confirmed BUY and SELL signals present on the chart 3. Adaptive TP & SL levels generated by the software for each trade 4. Easy to understand - suitable for all
Gann Made Easy
Oleg Rodin
4.84 (173)
Gann Made Easy , bay teorisini kullanarak ticaretin en iyi ilkelerine dayanan, profesyonel ve kullanımı kolay bir Forex ticaret sistemidir. WD Gann. Gösterge, Zararı Durdur ve Kâr Al Seviyeleri dahil olmak üzere doğru SATIN AL ve SAT sinyalleri sağlar. PUSH bildirimlerini kullanarak hareket halindeyken bile işlem yapabilirsiniz. Satın alma işleminden sonra, alım satım talimatlarını ve harika ek göstergeleri ücretsiz olarak almak için lütfen benimle iletişime geçin! Muhtemelen Gann ticaret yöntem
SR Liquidity
Oleg Rodin
5 (2)
SR Liquidity , piyasa likiditesinin yoğunlaştığı ve fiyatın en güçlü tepkiyi verdiği gizli bölgeleri ortaya çıkarmak için tasarlanmış bir alım-satım göstergesidir. Bu özel likidite alanları güçlü destek ve direnç seviyeleri işlevi görerek, piyasanın yön değiştirme ihtimalinin en yüksek olduğu yerlere dair size net bir harita sunar. SR Liquidity, sıradan Destek/Direnç çizgileri çizmek yerine, alım ve satım baskısının yoğunlaştığı bölgeleri tespit etmek için gerçek fiyat hareketlerini analiz eder.
AW Prime Oscillator
AW Trading Software Limited
5 (1)
İki osilatörün birleşimi. Birincisi giriş noktalarını, ikincisi ise mevcut trendi gösterir. Gösterge, osilatör sinyallerini iki modda oklarla görüntüleyebilir; tüm hızlı osilatör sinyalleri veya yalnızca mevcut trend yönündeki sinyaller. Çok zaman dilimli bir panele ve üç tür sinyal bildirimine sahiptir. Faydalar: Günlük ve scalping ticaretine uygundur Trend filtreleme Basit ve hassas kurulum Çoklu zaman dilimi paneli Bir danışmana entegrasyona uygundur. Herhangi bir sembol ve herhangi bir zaman
PZ Harmonacci Patterns
PZ TRADING SLU
3.17 (6)
Trade smarter, not harder: Empower your trading with Harmonacci Patterns This is arguably the most complete harmonic price formation auto-recognition indicator you can find for the MetaTrader Platform. It detects 19 different patterns, takes fibonacci projections as seriously as you do, displays the Potential Reversal Zone (PRZ) and finds suitable stop-loss and take-profit levels. [ Installation Guide | Update Guide | Troubleshooting | FAQ | All Products  ] It detects 19 different harmonic pric
Top Bottom Tracker , piyasa trendini analiz eden ve trendin en yüksek ve en düşük seviyelerini tespit edebilen sofistike algoritmalara dayanan bir göstergedir / MT5 sürümü . Fiyat 500$'a ulaşana kadar kademeli olarak artacaktır. Sonraki fiyat --> $99 Özellikler Yeniden boyama yok Bu gösterge, yeni veriler geldiğinde değerlerini değiştirmez İşlem çiftleri Tüm forex çiftleri Zaman Dilimi Tüm zaman dilimleri Parametreler ==== Gösterge yapılandırması ==== Konfigürasyon parametresi // 40
Cycles Predictor Indicator This indicator uses past market cycles to predict future price movements. The indicator scans through past data and considers  combinations  of cycles. When cycles  coincide  at the same future date/time then it is considered a valid future prediction. The predictions are drawn as vertical lines on the right side of the chart in the future. A prediction will often result in type of candle (ex. bull or bear) and/or a reversal point (ex. bottom or top) forming at this ex
SIO Oscillator: Kendi Kendini Optimize Eden Yarı Varyans Dengesizlik Osilatörü İndikatörü satın alın, ona dayalı Uzman Danışmanı (EA) ÜCRETSİZ edinin. Çoğu osilatör, tüm fiyat hareketlerini aynı şekilde değerlendirir. SIO ise yükseliş ve düşüş baskısını birbirinden ayırır ve aralarındaki dengesizliği ölçerek piyasayı gerçekte kimin kontrol ettiğini gösterir: alıcılar mı, satıcılar mı. Dengesizlik bir uç noktaya ulaştığında SIO, giriş, Stop Loss ve Take Profit seviyeleriyle birlikte net bir sinya
GoldRush Trend Ok Sinyali GoldRush Trend Ok Sinyali göstergesi, XAU/USD'de yüksek hızlı, kısa vadeli scalperlar için özel olarak tasarlanmış hassas, gerçek zamanlı trend analizi sağlar. 1 dakikalık zaman dilimi için özel olarak tasarlanan bu araç, net giriş noktaları için yön okları gösterir ve scalper'ların değişken piyasa koşullarında güvenle hareket etmelerini sağlar. Gösterge, PRIMARY ve SECONDARY uyarı oklarından oluşur. PRIMARY sinyalleri, trend yönündeki değişikliği gösteren Beyaz ve
ForexTrendMT4
Andriy Sydoruk
5 (1)
ForexTrendMT4 Indicator: A Reliable Tool for Market Tracking The ForexTrendMT4 indicator offers reliable market trend tracking, filtering out sudden fluctuations and market noise. This tool helps identify trends and signals favorable entry points into the market using arrows. It is suitable for both scalping on shorter timeframes and long-term trading strategies. Based on the principles of technical analysis, ForexTrendMT4 takes into account the cyclical nature of the market. Key Features and A
Super Signal – Skyblade Edition Profesyonel No-Repaint / Gecikmesiz Trend Sinyal Sistemi, Olağanüstü Kazanma Oranı ile | MT4 / MT5 için 1 dakika, 5 dakika ve 15 dakika gibi daha düşük zaman dilimlerinde en iyi şekilde çalışır. Temel Özellikler: Super Signal – Skyblade Edition, özellikle trend bazlı işlemler için geliştirilmiş akıllı bir sinyal sistemidir. Yalnızca güçlü, yönlü ve gerçek momentum destekli piyasa hareketlerini tespit etmek amacıyla çok katmanlı bir filtreleme yapısı kullanır. Bu s
ŞU ANDA %40INDIRIMLI Yeni Başlayanlar veya Uzman Tüccarlar için En İyi Çözüm! Bu Gösterge benzersiz, yüksek kaliteli ve uygun fiyatlı bir ticaret aracıdır çünkü bir dizi tescilli özellik ve yeni bir formül ekledik. Sadece BİR grafik ile 28 Forex çifti için Döviz Gücünü okuyabilirsiniz! Yeni bir trendin veya scalping fırsatının tam tetik noktasını belirleyebildiğiniz için ticaretinizin nasıl gelişeceğini hayal edin? Kullanım kılavuzu: buraya tıklayın Bu ilk olan, orijinal! Değersiz bir özent
Introducing Volume Orderflow Profile , a versatile tool designed to help traders visualize and understand the dynamics of buying and selling pressure within a specified lookback period. Perfect for those looking to gain deeper insights into volume-based market behavior! MT5 Version -  https://www.mql5.com/en/market/product/122657 The indicator gathers data on high and low prices, along with buy and sell volumes, over a user-defined period. It calculates the maximum and minimum prices during this
Trend Lines PRO
Roman Podpora
5 (2)
TREND ÇİZGİLERİ PRO     Piyasanın gerçek yön değişimini anlamaya yardımcı olur. Gösterge, gerçek trend dönüşlerini ve büyük oyuncuların piyasaya yeniden girdiği noktaları gösterir. Anlıyorsun     BOS hatları  Daha yüksek zaman dilimlerindeki trend değişiklikleri ve önemli seviyeler, karmaşık ayarlar veya gereksiz gürültü olmadan gösterilir. Sinyaller yeniden çizilmez ve çubuk kapandıktan sonra grafikte kalır. VERSION MT 5     -    RFI LEVELS PRO  göstergesiyle birlikte kullanıldığında maksimum p
Şu anda %30 İNDİRİMLİ! Herhangi bir Acemi veya Uzman Tüccar için En İyi Çözüm! Bu gösterge paneli yazılımı 28 döviz çifti üzerinde çalışıyor. Ana göstergelerimizden 2'sine (Gelişmiş Para Birimi Gücü 28 ve Gelişmiş Para Birimi Dürtüsü) dayanmaktadır. Tüm Forex piyasasına harika bir genel bakış sağlar. Gelişmiş Para Birimi Gücü değerlerini, para birimi hareket hızını ve tüm (9) zaman dilimlerinde 28 Forex çifti için sinyalleri gösterir. Trendleri ve / veya scalping fırsatlarını belirlemek için
Advanced Supply Demand
Bernhard Schweigert
4.91 (302)
Özel Ticaret –%30 İndirim Yeni Başlayanlar veya Uzman Yatırımcılar İçin En İyi Çözüm! Bu gösterge, bir dizi özel özellik ve yeni bir formül içerdiği için benzersiz, yüksek kaliteli ve uygun fiyatlı bir işlem aracıdır. Bu güncelleme ile çift zaman dilimi bölgeleri gösterebileceksiniz. Sadece daha yüksek bir zaman dilimini değil, hem grafik zaman dilimini hem de daha yüksek zaman dilimini gösterebileceksiniz: İÇ İÇE GEÇMİŞ BÖLGELER GÖSTERİYOR. Tüm Arz Talep yatırımcıları buna bayılacak. :) Önem
This is a professional chart indicator designed for traders focused on stability and clear price action. It helps filter market noise and provides clear visual entry and exit zones for your trading decisions. Core Features: Strictly Non-Repainting: The system is built with strict non-repaint logic. What you see on the chart is the true historical performance. Confirmed Signals: Signals are triggered and confirmed only after the candle closes . Once a trading arrow appears on a closed candle, it
DayTrader PRO MT4
Davit Beridze
4.6 (10)
DayTrader PRO MT5:  https://www.mql5.com/en/market/product/186222 DayTrader PRO, John Ehlers'in Laguerre filtresini güçlü bir otomatik optimizasyon motoruyla birleştiren gelişmiş bir alım satım indikatörüdür. Sabit parametreler kullanmak yerine, indikatör yakın piyasa koşullarına göre en iyi ayarları otomatik olarak arar ve sürekli manuel ayarlamalar yapmadan değişen piyasa volatilitesine uyum sağlamanıza yardımcı olur. İndikatör, net ALIM (BUY) ve SATIM (SELL) sinyallerinin yanı sıra mevcut piy
Indicator plots price cycle blocks and sends signals with smart volume confirmation. Price cycles and fractals are combined to determine the demand/supply blocks. The indicator can be used alone or combined with other Cycle Indicators Inputs: Period: Recommended value is between 35 and 55( Which are Set 1 and Set 2 periods of cycle sniper ) Engulfing: If true, you will be able to see the engulfing bar confirmation. Volume Filter: True (The  arrow comes with volume confirmation ) Videos with dif
Currency Strength Exotics
Bernhard Schweigert
4.88 (33)
ŞU ANDA %20 INDIRIMLI! Herhangi bir Acemi veya Uzman Tüccar için En İyi Çözüm! Bu Gösterge, Egzotik Çiftler Emtialar, Endeksler veya Vadeli İşlemler gibi herhangi bir sembol için para birimi gücünü göstermek için uzmanlaşmıştır. Türünün ilk örneğidir, Altın, Gümüş, Petrol, DAX, US30, MXN, TRY, CNH vb. gerçek para birimi gücünü göstermek için 9. satıra herhangi bir sembol eklenebilir. Bu benzersiz, yüksek kaliteli ve uygun fiyatlı bir ticaret aracıdır çünkü bir dizi tescilli özelliği ve yeni b
Scalper Inside PRO
Alexey Minkov
4.74 (69)
Scalper Inside PRO helps you read the intraday trend and plan a trade before you enter the market. It is built around three exclusive strategies for a sharper read of the market. The moment a signal appears, the indicator evaluates market direction and calculates the key levels, so you see the potential entry, the expected stop-loss and several profit-taking levels in advance. Detailed performance statistics show how different instruments and strategies performed in history and help you pick ass
Cumulative Delta Pro
Stanislav Konin
5 (2)
Cumulative Delta Pro , alıcı veya satıcı baskısının tükendiği yerlerde dönüşleri bulmak için geliştirilmiş bir kümülatif delta göstergesidir. Çoğu delta göstergesi yalnızca bir histogram gösterir. Sonrasında trader uyumsuzlukları kendisi arar, baskının nerede aşırı ısındığına kendisi karar verir ve giriş anını kendisi tahmin eder. Cumulative Delta Pro işin bu kısmını üstlenir: fiyatın etrafında uyarlanabilir bir delta kanalı oluşturur, baskının sınıra ulaştığı uç bölgeleri gösterir ve bir ila üç
Arrow Micro Scalper , ölçeklendirme ve kısa vadeli ticaret için tasarlanmış, herhangi bir grafiğe ve finansal araca (Para birimleri, kripto, hisse senetleri, metaller) entegre edilmiş bir göstergedir. Çalışmasında dalga analizi ve trend yönü filtresini kullanıyor. M1'den H4'e kadar Zaman Çerçevelerinde kullanılması önerilir. Göstergeyle nasıl çalışılır. Gösterge, ayarları değiştirmek için 2 harici parametre içerir, geri kalanı zaten varsayılan olarak yapılandırılmıştır. Büyük oklar trend yönün
Yazarın diğer ürünleri
Market Profile TPO Market Profile TPO is a multi-period Time-Price-Opportunity (TPO) indicator for MetaTrader 5. It builds price profiles from time data and displays the Point of Control (POC), the Value Area (VAH and VAL), the Initial Balance (IB), Single Prints, a volume overlay and profile merging on the chart. It is written entirely in MQL4 and does not use DLLs or external files. What the indicator draws TPO profile: each price level is tagged with the time slice in which it traded. Display
Volume Profile: multi-mode, multi-profile, drawn on the price chart The indicator draws a volume profile directly on the price chart, together with the Point of Control (POC) line, the Value Area (VAH and VAL) and optional peaks and valleys. Instead of reading volume in a separate bottom panel, the volume is shown at the price levels where it was traded, so price and volume can be read in one place. What the indicator displays POC (Point of Control) line : the price level with the highest traded
Volume Bubbles version MT5
Cesar Sebastian Rosales Ibarra
Volume Bubbles  See the volume outliers and divergence bars — before they reverse on you. Volume Bubbles — on-chart volume spike detector with divergence arrows. Most volume tools dump a histogram at the bottom of your screen and leave you to guess which bars actually mattered. Volume Bubbles puts the answer directly on the chart: a bubble on the bar, sized by how unusual the volume was, colored by what that volume means, with an arrow when the volume story disagrees with the price story. Wha
Anchored VWAP plus Bands MT4
Cesar Sebastian Rosales Ibarra
Anchored VWAP — 5 draggable anchors with deviation bands Volume-weighted average price anchored to user-defined points on the chart. Drop an anchor where you want the VWAP to start — earnings, swing high/low, session open, any event — and the indicator recalculates from that bar forward. This indicator is available free of charge. What it does: Up to 5 independent anchors, each with its own VWAP line and color, running simultaneously on the same chart 2 configurable σ deviation bands (default ±1
FREE
Anchored VWAP plus Bands MT5
Cesar Sebastian Rosales Ibarra
Anchored VWAP — 5 draggable anchors with deviation bands Volume-weighted average price anchored to user-defined points on the chart. Drop an anchor where you want the VWAP to start — earnings, swing high/low, session open, any event — and the indicator recalculates from that bar forward. This indicator is available free of charge. What it does: Up to 5 independent anchors, each with its own VWAP line and color, running simultaneously on the same chart 2 configurable σ deviation bands (default ±1
FREE
Daily VWAP plus Bands MT4
Cesar Sebastian Rosales Ibarra
VWAP - Volume Weighted Average Price Stop guessing the day's fair price. See it. P eriod VWAP with deviation bands and forward projection — for traders who need institutional reference levels on every timeframe. VWAP is the single most-watched level by institutions, prop desks, and algorithmic traders. Not because it's magic — because it's the price the market actually paid. This indicator puts 5 VWAP period modes (Daily / Weekly / Monthly / Quarterly / Yearly) on your chart with 4 deviation ban
Volume Bubbles MT4
Cesar Sebastian Rosales Ibarra
Volume Bubbles  See the volume outliers and divergence bars — before they reverse on you. Volume Bubbles — on-chart volume spike detector with divergence arrows. Most volume tools dump a histogram at the bottom of your screen and leave you to guess which bars actually mattered. Volume Bubbles puts the answer directly on the chart: a bubble on the bar, sized by how unusual the volume was, colored by what that volume means, with an arrow when the volume story disagrees with the price story. What
Dynamic Volume Profile MT4
Cesar Sebastian Rosales Ibarra
Box Volume Profile Box Volume Profile draws a volume histogram inside any rectangle you place on the chart. Choose a time window and a price range, and the indicator shows how much volume was traded at each price level inside that zone. It also plots the Point of Control (POC) and the Value Area boundaries (VAH and VAL). How to use Press the draw hotkey (the letter V by default) and drag a rectangle anywhere on the chart. The volume profile appears immediately inside the box. Move or resize the
Daily VWAP plus Bands MT5
Cesar Sebastian Rosales Ibarra
VWAP - Volume Weighted Average Price Stop guessing the day's fair price. See it. Period VWAP with deviation bands and forward projection — for traders who need institutional reference levels on every timeframe. VWAP is the single most-watched level by institutions, prop desks, and algorithmic traders. Not because it's magic — because it's the price the market actually paid. This indicator puts 5 VWAP period modes (Daily / Weekly / Monthly / Quarterly / Yearly) on your chart with 4 deviation ba
Volume Profile  Stop guessing where the real money traded. See it. Volume Profile — multi-mode, multi-profile, with POC / Value Area / Peaks & Valleys drawn directly on your chart. Most volume tools dump a histogram at the bottom of your screen and make you guess which price level actually carried the volume. Volume Profile puts the volume where the price is — on the chart, at the price levels where money actually changed hands. You see the value area, the control point, the rejection tails, an
Dynamic Volume Profile MT5
Cesar Sebastian Rosales Ibarra
Box Volume Profile Box Volume Profile draws a volume histogram inside any rectangle you place on the chart. Choose a time window and a price range, and the indicator shows how much volume was traded at each price level inside that zone. It also plots the Point of Control (POC) and the Value Area boundaries (VAH and VAL). How to use Press the draw hotkey (the letter V by default) and drag a rectangle anywhere on the chart. The volume profile appears immediately inside the box. Move or resize the
Filtrele:
Değerlendirme yok
Değerlendirmeye yanıt