KCI Candle
- Göstergeler
- Sürüm: 1.0

KCI Candle: Advanced Kinematics Price Action
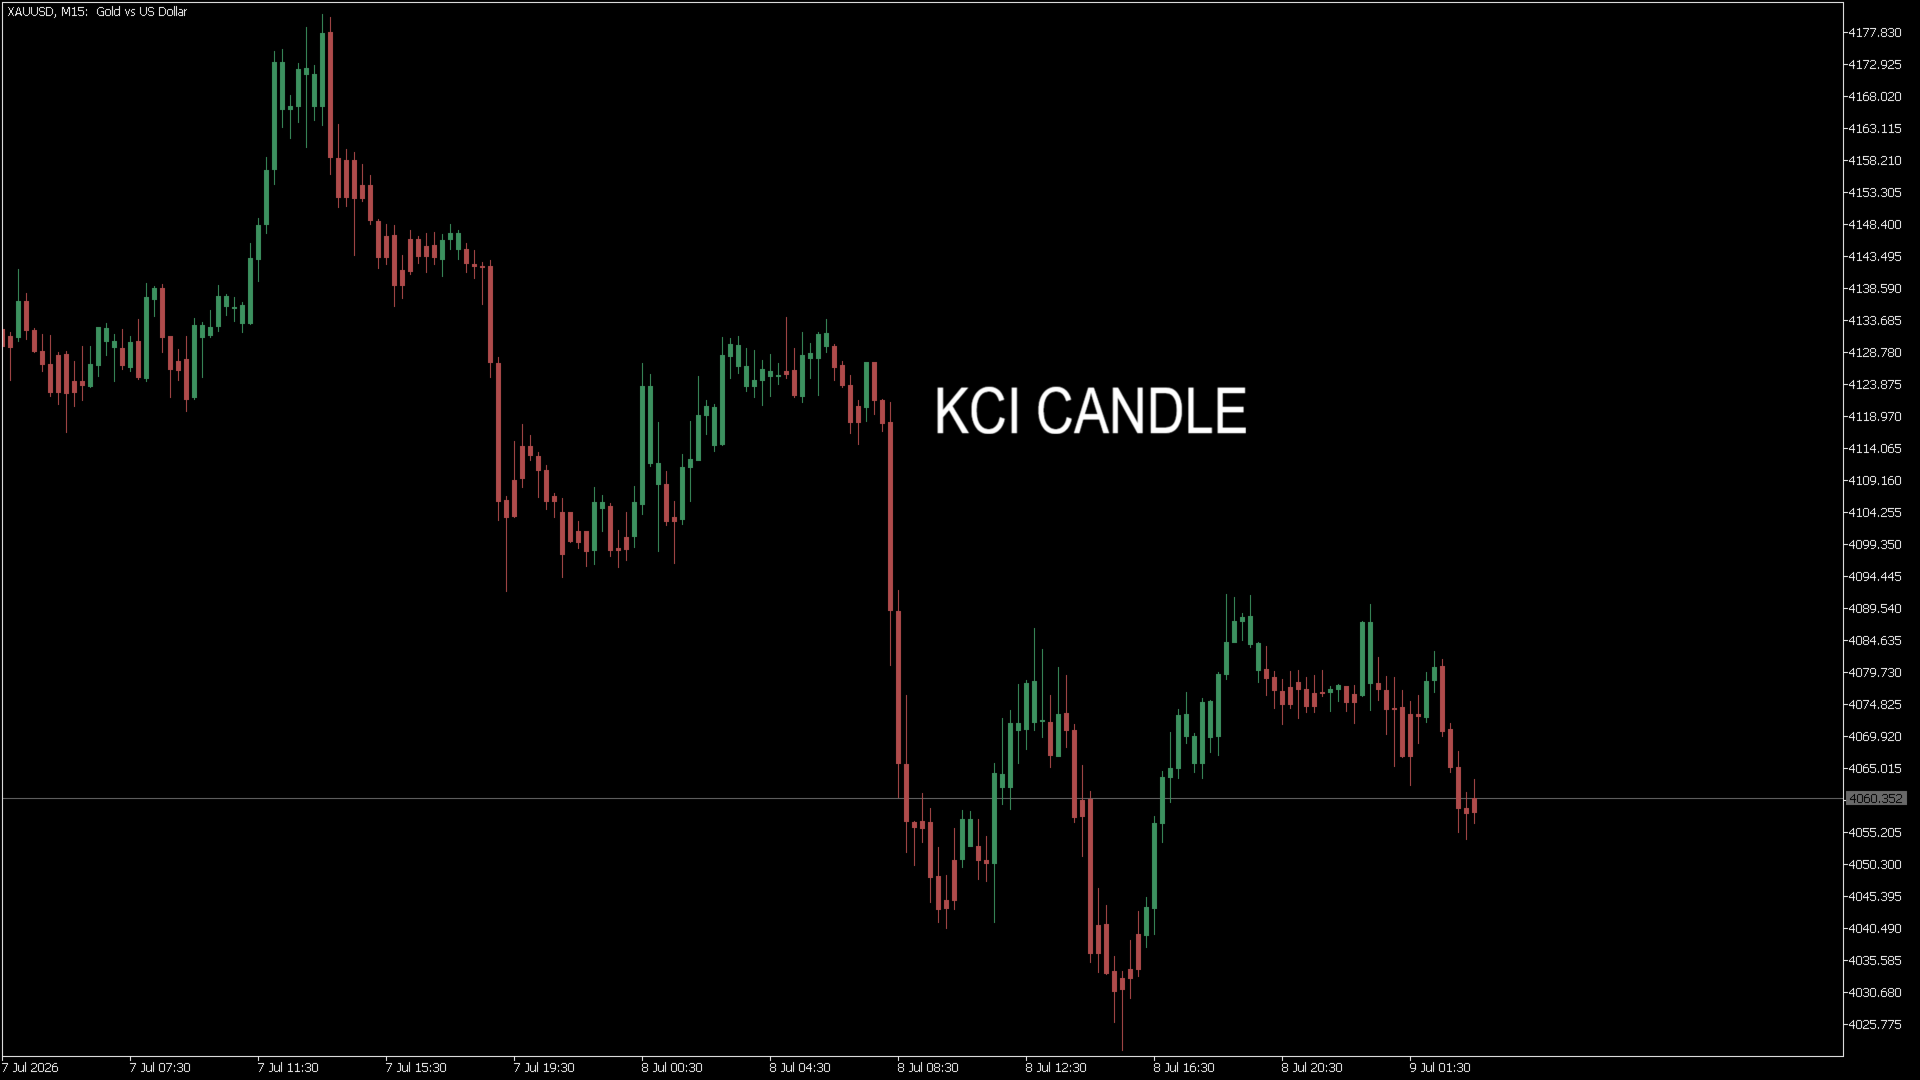
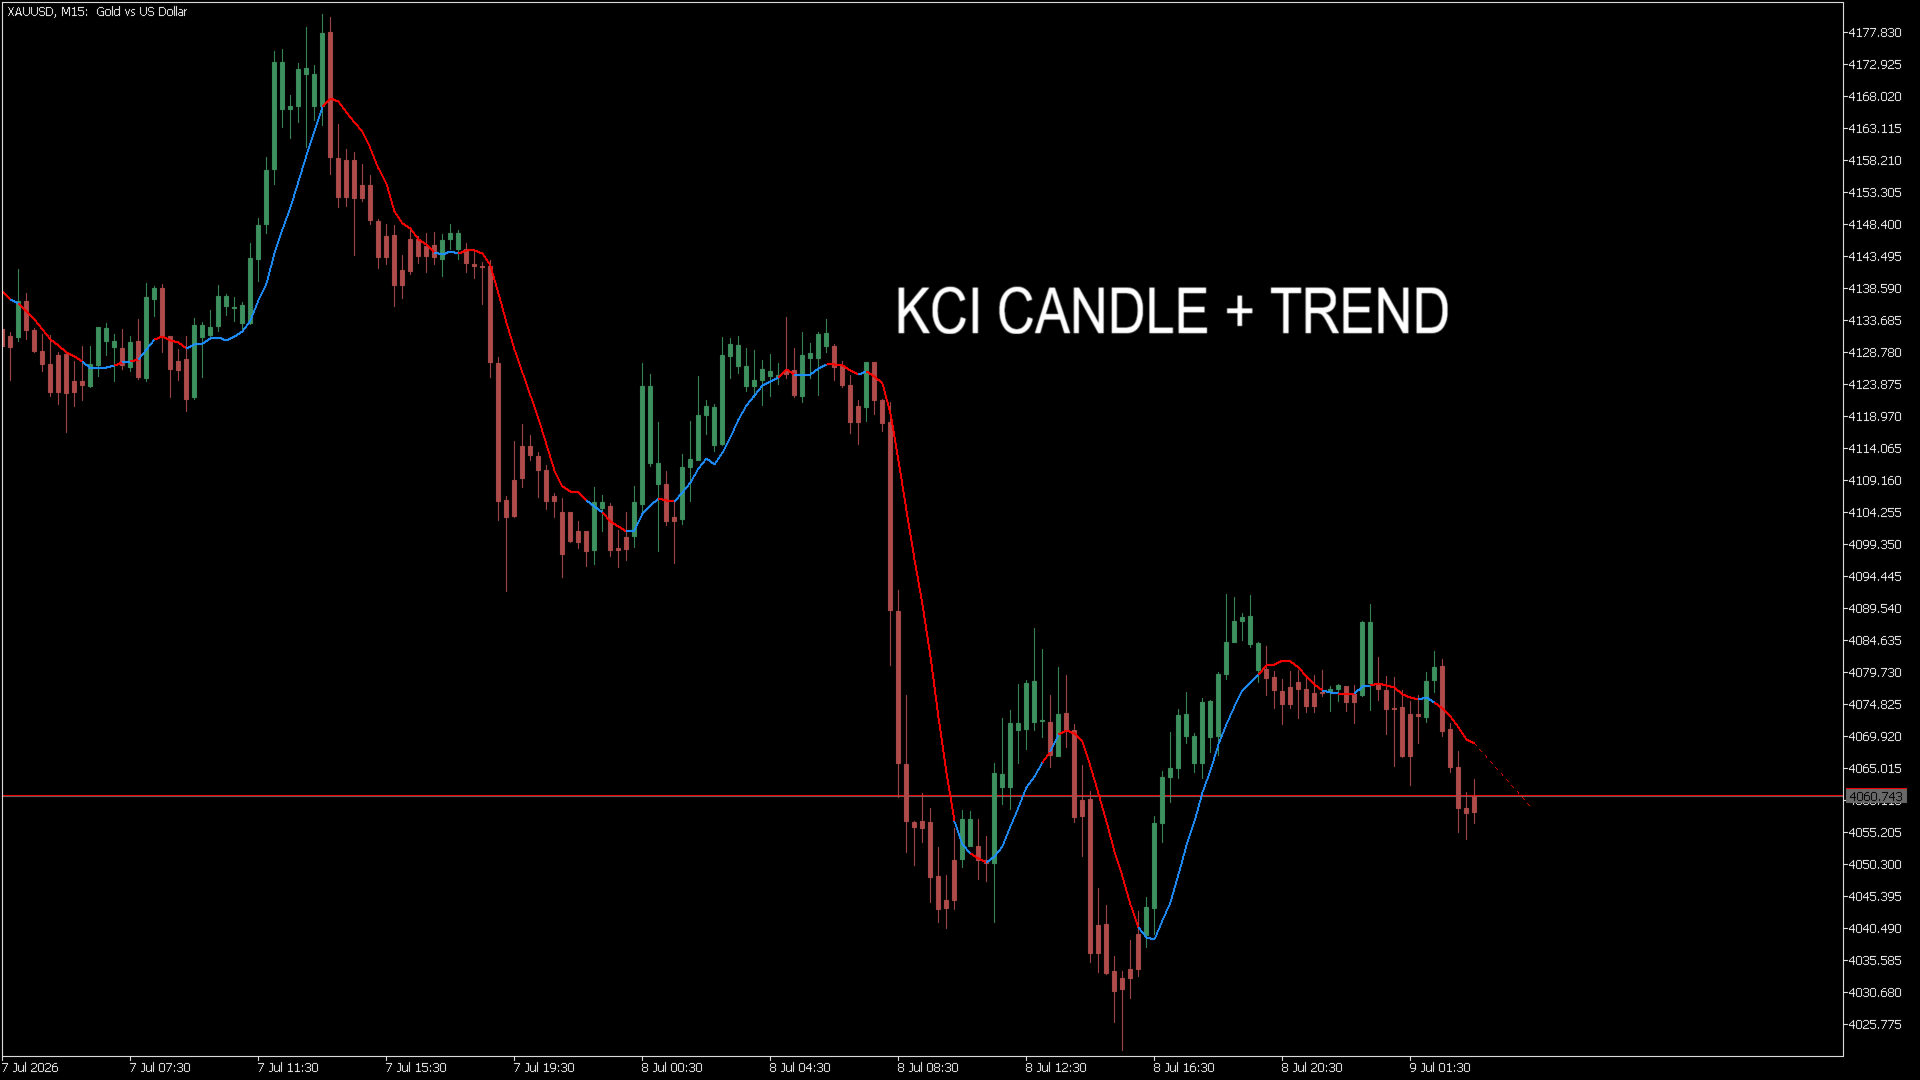
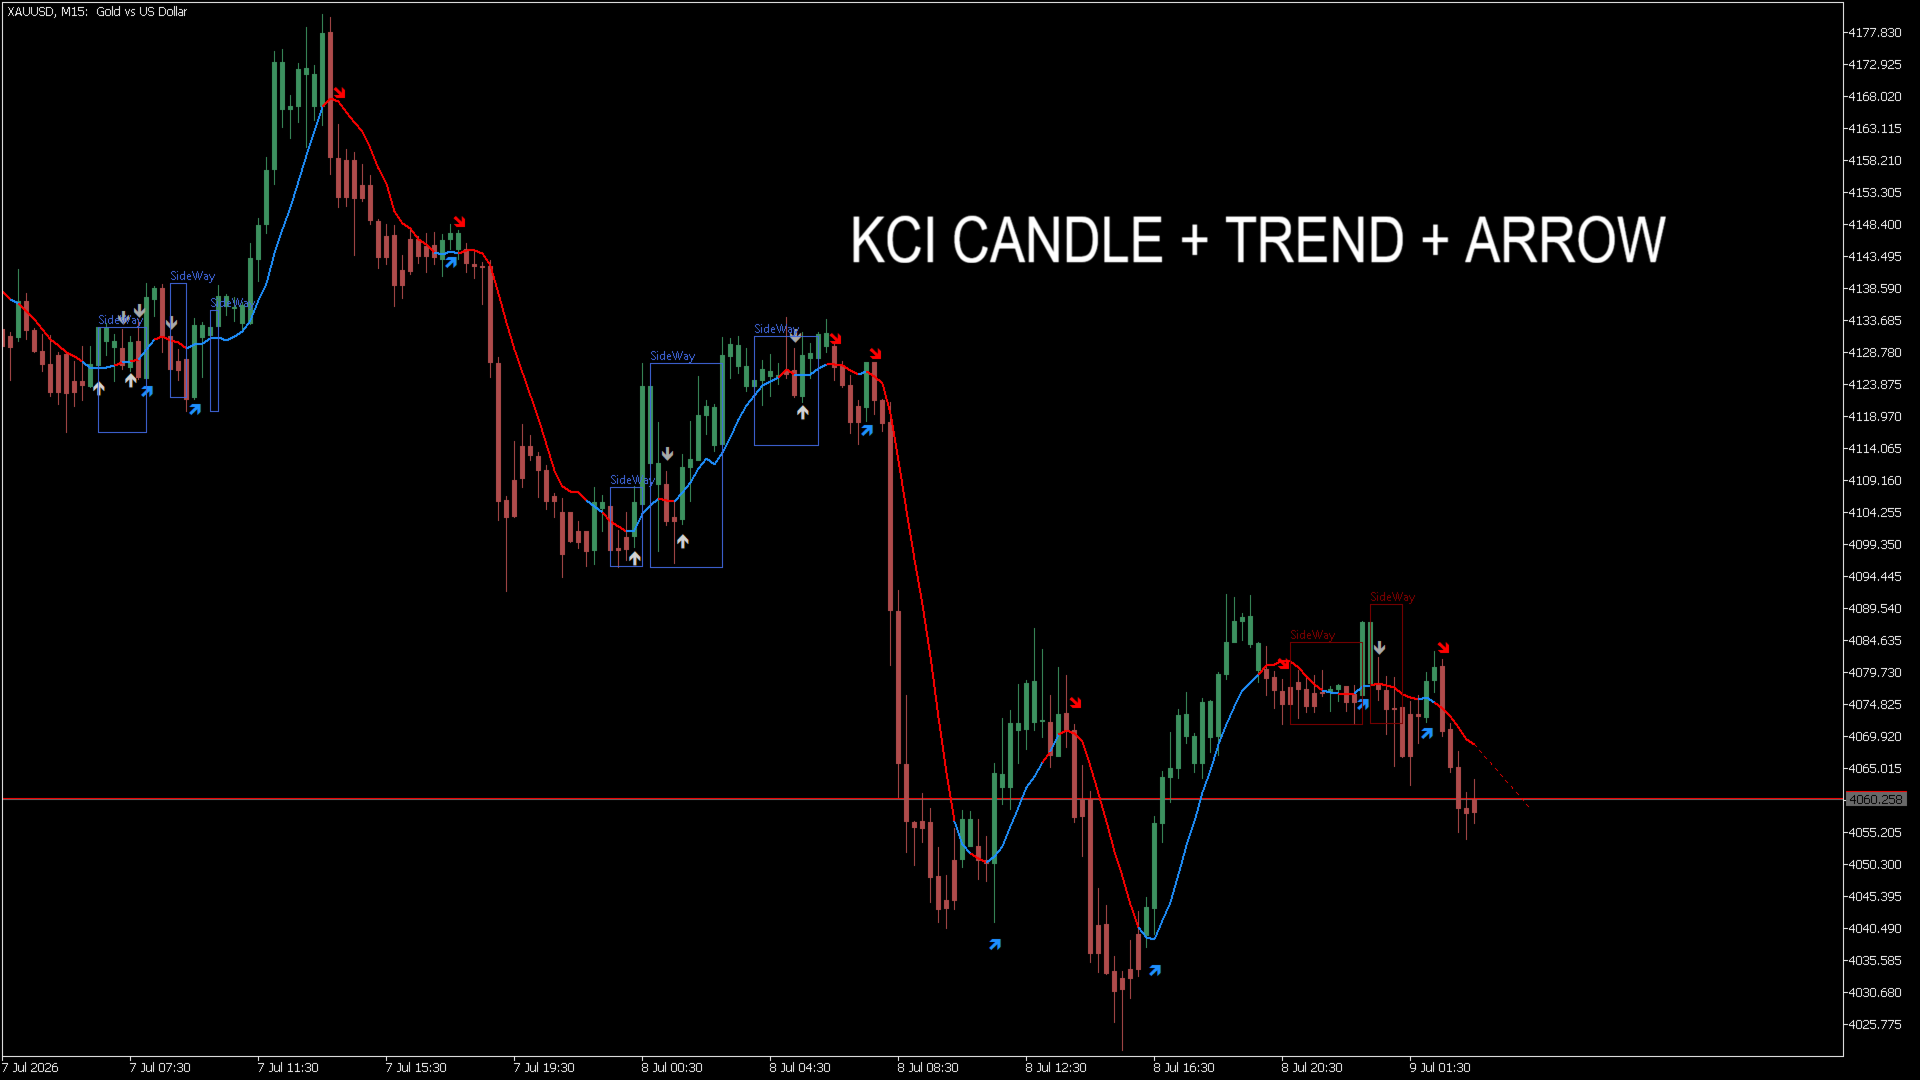
The KCI (Kinematics Computing Index) Candle is a next-generation analytical tool designed to transform raw market data into crystal-clear visual intelligence. By painting the chart's candles based on deep mathematical kinematics, this indicator provides traders with an immediate, unambiguous reading of the current market direction and momentum.
Built for professional traders who demand clean charts and pure data, the KCI Candle eliminates second-guessing. A blue candle indicates bullish kinematics control, while a red candle signifies bearish dominance.
Core Advantages & Key Features:
- Advanced Kinematics Engine: Instead of simple price averaging, the KCI core calculates the true physics of price action—analyzing velocity, net distance, path length, and statistical variance to determine the true market intent.
- Dynamic Z-Score Normalization: The algorithm constantly standardizes market volatility using a rolling Z-Score window. This allows the indicator to adapt instantly to any asset class (Forex, Metals, Indices, or Crypto) and any timeframe without requiring constant parameter tweaking.
- Exponential Noise Compression: Equipped with a mathematical decay constant and compression threshold, the KCI effectively filters out market "noise" and sudden, meaningless price spikes, preventing false signals and fakeouts.
- Institutional-Grade Performance: Coded with extreme efficiency in mind. Utilizing single-pass calculations and native memory management, the KCI Candle runs with zero lag, ensuring your CPU remains exceptionally light even when loaded across multiple charts.
- Professional Visual Themes: Trading screen aesthetics matter for psychological focus. The KCI Candle comes with built-in, meticulously designed color profiles (Professional, Institution, Soft Eye, Galaxy, Futuristic, etc.) tailored for long trading sessions and reduced eye strain.
Who is this for?
The KCI Candle is built for serious price-action traders, algorithmic system developers, and prop-firm traders who require an ultra-fast, mathematically sound directional bias layered directly onto the price itself, keeping the chart free from distracting sub-windows.