Keltner Global

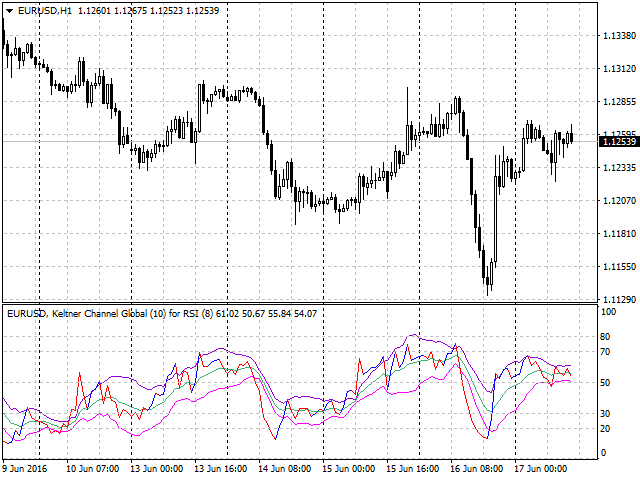
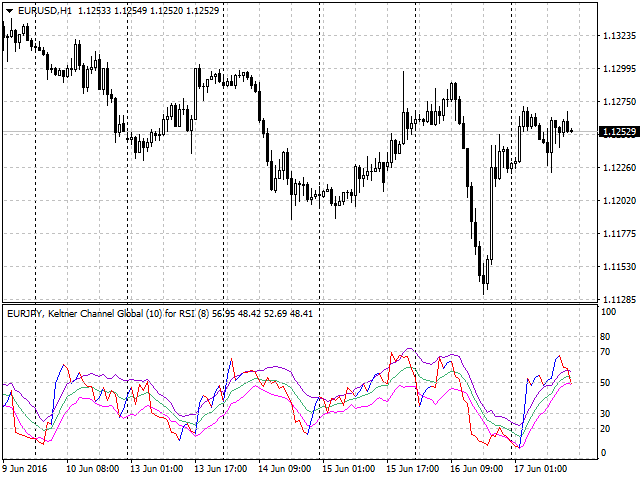
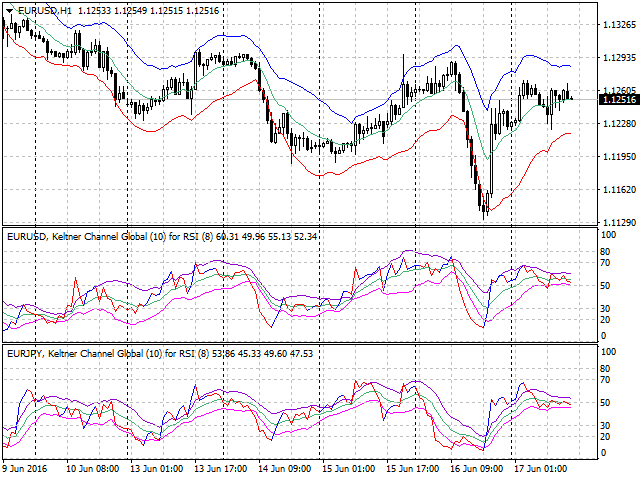
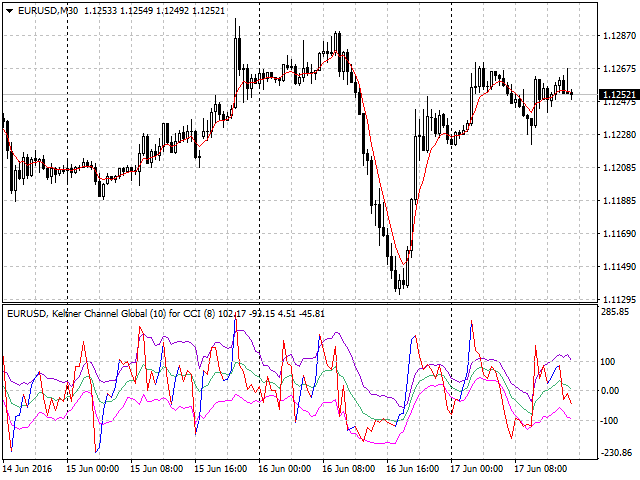
Keltner's colored channel indicator, also called STARC band, drawn in an additional chart window for any of the five basic indicators included into the MetaTrader 4 platform.

The indicator uses the calculation technique of the three drawing options: basic, improved and modified. The first two were proposed by Keltner, the third one - by a successful trader L. Rakshe.

You can search for your own optimal parameters of the indicator. It is also possible to color the upper, middle and lower bands, as well as the bullish and bearish sentiments of the basic indicator.


Purpose

The indicator can be used for manual or automated trading within an Expert Advisor. Values of indicator buffer of the double type can be used for automated trading:

  1. The middle line of the indicator - buffer 2.
  2. The upper line of the indicator - buffer 0.
  3. The lower line of the indicator - buffer 1.
  4. The bearish sentiment of the basic indicator - buffer 4, must not be equal to EMPTY_VALUE.
  5. The bullish sentiment of the basic indicator - buffer 3, must not be equal to EMPTY_VALUE.
  6. The main line of the basic indicator - buffer 5.
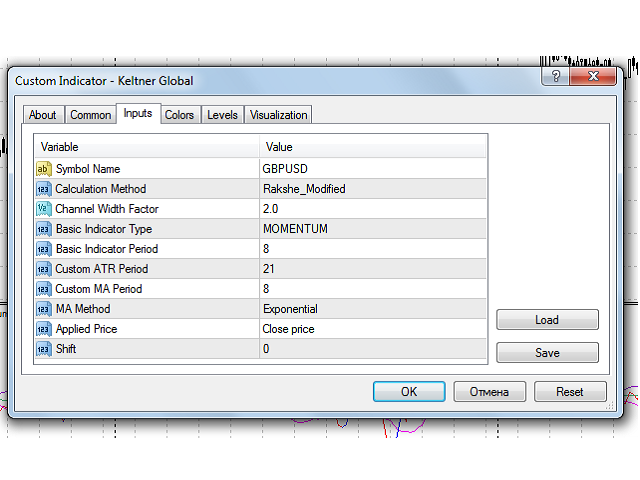

Inputs

  1. Symbol Name - the name of the financial instrument.
  2. Calculation Method - indicator calculation method:
    1. basic (by Keltner)
    2. improved (by Keltner)
    3. modified (by L.Rakshe)
    4. custom - for the following parameters specified by the user.
  3. Channel Width Factor
  4. Basic Indicator Type
    • FORCE.
    • MOMENTUM.
    • CCI.
    • RSI.
    • StdDev.
  5. Basic Indicator Period - calculation period of the basic indicator.
  6. Custom ATR Period - custom period for the ATR (Average True Range) line calculation.
  7. Custom MA Period - custom period for the MA averaging.
  8. MA Method - MA averaging method.
  9. Applied Price - price used for calculation.
  10. Shift - shift of the indicator in relation to the price chart.
Önerilen ürünler
PABT Pattern Indicator - it's classical system one of the signal patterns. Indicator logic - the Hi & Lo of the bar is fully within the range of the preceding bar, look to trade them as pullback in trend. In the way if indicator found PABT pattern it's drawing two lines and arrow what showing trend way.  - First line - it's entry point and drawing at: 1. On the high of signal bar or on middle of the signal bar (depending from indicator mode) for buy; 2. On the low of signal bar or on middle of t
Infinity Trend Pro
Yaroslav Varankin
1 (1)
This is a trend indicator without redrawing Developed instead of the binary options strategy (by the color of the Martingale candlestick) Also works well in forex trading When to open trades (binary options) A signal will appear in the place with a candle signaling the current candle It is recommended to open a deal for one candle of the current timeframe M1 and M5 When a blue dot appears, open a deal up When a red dot appears, open a trade down. How to open trades on Forex. When a signal is rec
Mirror Dominance Назначение: визуально сравнить силу двух валютных пар и ловить моменты смены доминирования. Индикатор строит в отдельном окне две зеркальные линии для выбранных пар, показывает их схождение/расхождение и даёт сигналы на пересечениях (маркеры на основном графике). Есть Alert и Push-уведомления (по желанию), а также мини-метка виртуальной прибыли последнего сигнала. Автор: Alexander Lapin | Платформа: MT4 Входные параметры (основные) Pair1 / Pair2 — выбор двух валютных пар из
Trend Map
Maryna Shulzhenko
The Trend Map indicator is designed to detect trends in price movement and allows you to quickly determine not only the direction of the trend, but also to understand the levels of interaction between buyers and sellers. It has no settings and therefore can be perceived as it signals. It contains only three lines, each of which is designed to unambiguously perceive the present moment. Line # 2 characterizes the global direction of the price movement. If we see that the other two lines are above
Wave Wolf MT4
Andrei Salanevich
Forex Dalga Kurt MT4 göstergesi, Wolf dalgalarını aramak ve mevcut ticaret terminali penceresinde görüntülemek için tasarlanmıştır. Ticarette Wolfe dalgalarını kullanan tüccarlar için mükemmel bir gösterge. Ticaret stratejilerinde kullanımı, verimliliğini ve karlılığını önemli ölçüde artıracaktır. GÖSTERGE BİLGİSİ Diğer Wolf dalga göstergelerinin aksine, forex Wave Wold MT4 göstergesinin etkinliğini önemli ölçüde artıran birçok özelliği vardır: Birincisi, Açık Windows 5Point (true) ayarı bilg
Break Moment
Svyatoslav Kucher
5 (2)
Break Moment is a unique proprietary indicator with extensive capabilities and a variety of settings. It can be used as a signal generator or as an auxiliary tool. For the calculations, the price channel is determined. When it is broken, if all conditions of the additional filter are met, it displays a signal in the form of a histogram. Break Moment can be used to determine the main trend, as it has 2 filters for determining it in addition to everything else. If these filters are activated, the
VR Cub
Vladimir Pastushak
VR Cub , yüksek kaliteli giriş noktaları elde etmenin bir göstergesidir. Gösterge, matematiksel hesaplamaları kolaylaştırmak ve bir pozisyona giriş noktalarının aranmasını basitleştirmek için geliştirildi. Göstergenin yazıldığı ticaret stratejisi uzun yıllardan beri etkinliğini kanıtlamaktadır. Ticaret stratejisinin basitliği, acemi yatırımcıların bile başarılı bir şekilde ticaret yapmasına olanak tanıyan büyük avantajıdır. VR Cub, pozisyon açılış noktalarını ve Kâr Al ve Zararı Durdur hedef sev
Trendiness Index
Libertas LLC
5 (3)
"The trend is your friend" is one of the best known sayings in investing, because capturing large trendy price movements can be extremely profitable. However, trading with the trend is often easier said than done, because many indicators are based on price reversals not trends. These aren't very effective at identifying trendy periods, or predicting whether trends will continue. We developed the Trendiness Index to help address this problem by indicating the strength and direction of price trend
Crypto_Forex Göstergesi HTF Ichimoku MT4 için. - Ichimoku göstergesi en güçlü trend göstergelerinden biridir. HTF - Daha Yüksek Zaman Çerçevesi anlamına gelir. - Bu gösterge Trend Yatırımcıları için mükemmeldir ve Fiyat Hareketi girişleriyle birleştirilebilir. - HTF Ichimoku Göstergesi, daha yüksek zaman çerçevesinden Ichimoku'yu mevcut grafiğinize eklemenizi sağlar. - Yukarı trend - mavi olanın üzerindeki kırmızı çizgi (ve her iki çizgi de bulutun üzerindedir) / Aşağı trend - mavi olanın altı
Great Indicator
Ruben David Santana Rodriguez
Les presento un indicador que funciona como estrategia por si solo , trabaja muy bien en periodos de 4 horas pero puedes aplicarlo a cualquier timeframe , las señales son muy faciles de interpretar , en momento en que la linea naranja pasa hacia arriba las media azul y roja , se entra en largos , la operativa se mantiene abierta hasta que la linea naranja cruce la media mas cercana ya sea la azul o la roja , si la operacion era long y la linea azul cruza hacia arriba la linea roja y la naranja c
The indicator detects and displays Shark harmonic pattern (see the screenshot). The pattern is plotted by the extreme values of the ZigZag indicator (included in the resources, no need to install). After detecting the pattern, the indicator notifies of that by a pop-up window, a mobile notification and an email. The indicator highlights the process of the pattern formation and not just the complete pattern. In the former case, it is displayed in the contour triangles. After the pattern is comple
Dynamic Forex28 Navigator
Bernhard Schweigert
4.43 (7)
Dynamic Forex28 Navigator - Yeni Nesil Forex Ticaret Aracı. ŞU ANDA %49 İNDİRİM. Dynamic Forex28 Navigator, uzun zamandır popüler olan göstergelerimizin evrimidir ve üçünün gücünü tek bir göstergede birleştirir: Gelişmiş Döviz Gücü28 Göstergesi (695 inceleme) + Gelişmiş Döviz İMPULS ve UYARI (520 inceleme) + CS28 Kombo Sinyalleri (Bonus). Gösterge hakkında ayrıntılar https://www.mql5.com/en/blogs/post/758844 Yeni Nesil Güç Göstergesi Ne Sunuyor?  Orijinallerde sevdiğiniz her şey, şimdi yeni
This is a combination of multiple oscillators into a single divergence system that creates the impression of a more reliable divergence indicator. It is multi-currency based and works best on 15 minutes timeframe and above. Every time a signal is generated, it shows an alert to the user. It is more ideal if combined with other price action indicators or trading systems.
The indicator displays the data of the Stochastic oscillator from a higher timeframe on the chart. The main and signal lines are displayed in a separate window. The stepped response is not smoothed. The indicator is useful for practicing "manual" forex trading strategies, which use the data from several screens with different timeframes of a single symbol. The indicator uses the settings that are identical to the standard ones, and a drop-down list for selecting the timeframe. Indicator Paramet
This indicator is the undisputed leader among the indicators. And for this statement there is a good reason. The indicator builds a very high quality channel in which it generates signals to enter! What is the ideal strategy for the trader, since the trader always hesitates when choosing a strategy for the job. That is, this indicator will allow you to solve the dilemma of choosing a job by trend or to the channel, since it combines these two basic concepts. Working with the indicator is very
Rainbow Price Visualizer v1.21 See where the market really breathes. Turns your MT4 chart into an ultra-precise heatmap that highlights price zones favored by big players. Why it matters 300 price levels at 0.2‑pip resolution — microscopic detail. 8 visual themes (Rainbow, Fire, Ocean…) for instant readibility. Smart opacity: low noise fades, real zones pop. Lightweight rendering with automatic cleanup. Fully customizable: saturation, opacity, resolution, history depth. Bands project into the f
Super Reversal Pattern
Parfait Mujinga Ndalika
Super Reversal Pattern Indicator Unlock the power of advanced pattern recognition with our Super Reversal Pattern Indicator. Designed for traders seeking precision and reliability, this indicator identifies one of the most effective reversal patterns in technical analysis, offering a significant edge in your trading strategy. Key Features: Non-Repainting Accuracy: Enjoy the confidence of non-repainting technology. Once a Super Reversal Pattern is detected, it remains static, providing consiste
Ultimate Volatility Insight is a highly professional tool for analyzing and fully understanding market activity based on an advanced ATR with improved algorithms and calculation formulas. The indicator helps traders accurately assess market dynamics, identify key support and resistance levels, and effectively manage risks. Ultimate Volatility Insight works only with real data using live statistics. The indicator has been developed for over two years, and its effectiveness has been proven through
Power Renko is an indicator which plots Renko bricks underneath the chart using a histogram. You can select the brick size and the timeframe of the Renko bricks as well as whether or not to use the close price or the high/low price of the candles. Renko bricks are based on price alone, not time, therefor the Renko bricks will not be aligned with the chart's time. They are extremely useful for trend trading and many different strategies can be formed from them. Buffers are provided allowing you t
The   Trendlines Oscillator   helps traders identify trends and momentum based on the normalized distances between the current price and the most recently detected bullish and bearish trend lines. The indicator features bullish and bearish momentum, a signal line with crossings, and multiple smoothing options. USAGE The   Trendlines Oscillator   works by systematically: Identifying pivot highs and lows. Connecting pivots to form bullish (support) and bearish (resistance) trendlines. Measuring
The Magic MA Moving Average Indicator is a market analysis tool that has more than 30 types of moving averages that the trader can use to gauge the market trend. Among the types of moving averages that the trader can visualize are the most common MAs (SMA, EMA and SMMA), adaptive moving averages such as FRAMA and KAMA and other MAs based on innovative calculation and analysis methods such as LSMA, ZLEMA and others. The indicator is designed to display all these moving averages on a single cha
Trend PA
Mikhail Nazarenko
5 (3)
The Trend PA indicator uses   Price Action   and its own filtering algorithm to determine the trend. This approach helps to accurately determine entry points and the current trend on any timeframe. The indicator uses its own algorithm for analyzing price changes and Price Action. Which gives you the advantage of recognizing, without delay, a new nascent trend with fewer false positives. Trend filtering conditions can be selected in the settings individually for your trading style. The indicator
ADX Pointer is an indicator which is based on "Average Directional Index" and draws three numbers in chart window depending on the value of ADX. In ADX Pointer you can set "ADX_Period" which is of course period of Average Directional Index and you can also set 3 levels. When ADX value exceed first level ("ADX_Level1") in chart window appears number "1", when ADX exceed second level ("ADX_Level2") appears "2" and when ADX exceed third level ("ADX_Level3") appears "3". Simple. ADX Pointer works on
OP CD LTB (Opposite Prices Convergence/Divergence Low Top Bottom) is an indicator of convergence/divergence of the bullish sentiment among the mirrored financial instruments. The indicator is the second out of the two possible versions (LBT and LTB) of the bullish convergence/divergence origins. Multiple use of the indicator allows you to find convergences/divergences between the price of the main financial instrument and any other financial instruments simultaneously. Users can select the sell
Insider Scalper Binary This tool is designed to trade binary options. for short temporary spends. to make a deal is worth the moment of receiving the signal and only 1 candle if it is m1 then only for a minute and so in accordance with the timeframe. for better results, you need to select well-volatile charts.... recommended currency pairs eur | usd, usd | jpy .... the indicator is already configured, you just have to add it to the chart and trade .... The indicator signals the next candle.
"Auto FIBO Pro" Crypto_Forex göstergesi - ticarette harika bir yardımcı araçtır! - Gösterge, Fibo seviyelerini ve yerel trend çizgilerini (kırmızı renk) otomatik olarak hesaplar ve grafikte yerleştirir. - Fibonacci seviyeleri, fiyatın tersine dönebileceği önemli alanları gösterir. - En önemli seviyeler %23,6, %38,2, %50 ve %61,8'dir. - Ters scalping veya bölge ızgara ticareti için kullanabilirsiniz. - Auto FIBO Pro göstergesini kullanarak mevcut sisteminizi geliştirmek için birçok fırsat vardır
Swing Breakout Pending EA for XAUUSD (H4) This Expert Advisor is designed specifically for XAUUSD on the H4 timeframe , using a breakout continuation approach based on fresh swing structures and pending stop orders. The EA focuses on disciplined execution with controlled risk management and avoids dangerous recovery systems. Main Features Optimized for XAUUSD H4 Uses Buy Stop and Sell Stop orders Fresh structure breakout logic Fully automatic trading Auto-compounding lot size Default risk setti
Осциллятор   Чайкина   ( Chaikin   Oscillator ) — это индикатор импульса, созданный Марком   Чайкиным , и, очевидно, индикатор назван в честь своего создателя. Он измеряет импульс линии распределения и накопления, используя формулу схождения-расхождения скользящих средних (MACD). На основе данных об этом импульсе мы можем получить представление о направленных изменениях в линии распределения и накопления.
This indicator is another variant of the famous powerful indicator Fibonacci-SS https://www.mql5.com/en/market/product/10136 but has different behaviour in placing Pending Order and TP Line. Automatically places Fibonacci retracement lines from the last highest and lowest visible bars on the chart with: An auto Pending Order (Buy/Sell). Taking Profit 1, Taking Profit 2 is pivot point and Taking Profit 3 for extended reward opportunity. The best risk and reward ratio. Simple and powerful indicat
Based on MACD indicator waves with standard parameters Applies Fibonacci levels to the last two MACD waves, positive and negative respectively, if at the moment the MACD indicator runs out of negative Wave - the color is green, if at the moment the MACD indicator runs out of positive Wave - the color is red. The Wave termination criterion is two ticks with a different MACD sign. Applies trend lines on the last four MACD Waves. Works well with the expert Figures MACD   https://www.mql5.com/ru/mar
Bu ürünün alıcıları ayrıca şunları da satın alıyor
Neuro Poseidon MT4
Daria Rezueva
4.95 (37)
Neuro Poseidon is a new indicator by Daria Rezueva. It combines precise trading signals with adaptive TP/SL levels - creating best possible trades as a result! Message me and get  Neuro Poseidon Assistant  as a gift to automize your trading process! What makes it stand out? 1. Proven profitability on all assets and timeframes 2. Only confirmed BUY and SELL signals present on the chart 3. Adaptive TP & SL levels generated by the software for each trade 4. Easy to understand - suitable for all
Gann Made Easy
Oleg Rodin
4.84 (165)
Gann Made Easy , bay teorisini kullanarak ticaretin en iyi ilkelerine dayanan, profesyonel ve kullanımı kolay bir Forex ticaret sistemidir. WD Gann. Gösterge, Zararı Durdur ve Kâr Al Seviyeleri dahil olmak üzere doğru SATIN AL ve SAT sinyalleri sağlar. PUSH bildirimlerini kullanarak hareket halindeyken bile işlem yapabilirsiniz. Satın alma işleminden sonra, alım satım talimatlarını ve harika ek göstergeleri ücretsiz olarak almak için lütfen benimle iletişime geçin! Muhtemelen Gann ticaret yöntem
Trend Catcher ind
Ramil Minniakhmetov
5 (3)
TREND YAKALAYICI GÖSTERGE Trend Yakalayıcı Gösterge, yazarın tescilli ve özelleştirilmiş uyarlanabilir trend analiz göstergelerinin bir kombinasyonunu kullanarak piyasa fiyat hareketlerini analiz eder. Kısa vadeli gürültüyü filtreleyerek ve temel momentum gücüne, volatilite genişlemesine ve fiyat yapısı davranışına odaklanarak gerçek piyasa yönünü belirler. Ayrıca, hareketli ortalamalar, RSI ve volatilite filtreleri gibi yumuşatma ve trend filtreleme özelleştirilmiş göstergelerinin bir kombina
M1 Sniper
Oleg Rodin
5 (24)
M1 SNIPER kullanımı kolay bir işlem göstergesi sistemidir. M1 zaman dilimi için tasarlanmış bir ok göstergesidir. Gösterge, M1 zaman diliminde scalping için bağımsız bir sistem olarak kullanılabilir ve mevcut işlem sisteminizin bir parçası olarak kullanılabilir. Bu işlem sistemi özellikle M1'de işlem yapmak için tasarlanmış olsa da, diğer zaman dilimleriyle de kullanılabilir. Başlangıçta bu yöntemi XAUUSD ve BTCUSD ticareti için tasarladım. Ancak bu yöntemi diğer piyasalarda işlem yaparken de ya
MetaBands M4
Vahidreza Heidar Gholami
3.5 (6)
MetaBands uses powerful and unique algorithms to draw channels and detect trends so that it can provide traders with potential points for entering and exiting trades. It’s a channel indicator plus a powerful trend indicator. It includes different types of channels which can be merged to create new channels simply by using the input parameters. MetaBands uses all types of alerts to notify users about market events. Features Supports most of the channel algorithms Powerful trend detection algorith
Advanced Supply Demand
Bernhard Schweigert
4.91 (300)
Özel Ticaret –%30 İndirim Yeni Başlayanlar veya Uzman Yatırımcılar İçin En İyi Çözüm! Bu gösterge, bir dizi özel özellik ve yeni bir formül içerdiği için benzersiz, yüksek kaliteli ve uygun fiyatlı bir işlem aracıdır. Bu güncelleme ile çift zaman dilimi bölgeleri gösterebileceksiniz. Sadece daha yüksek bir zaman dilimini değil, hem grafik zaman dilimini hem de daha yüksek zaman dilimini gösterebileceksiniz: İÇ İÇE GEÇMİŞ BÖLGELER GÖSTERİYOR. Tüm Arz Talep yatırımcıları buna bayılacak. :) Önem
Scalper Inside PRO
Alexey Minkov
4.68 (69)
Scalper Inside PRO Scalper Inside PRO is an intraday trend and scalping indicator that uses exclusive built-in algorithms to evaluate market direction and key target levels. The indicator automatically calculates entry and exit points and several profit target levels, and it shows detailed performance statistics, so you can see how different instruments and strategies behaved on historical data. This helps you select instruments that fit current market conditions. You can also connect your own a
Genesis Matrix Pro is a professional multi-timeframe trend detection indicator designed to help traders identify high-quality market alignment with clarity and structure. It combines 12 different technical indicators into one visual alignment matrix, allowing traders to quickly see when market conditions are bullish, bearish, or neutral. A signal is generated only when the selected strategies are aligned, helping reduce noise and improve decision-making. PLEASE CONTACT ME AFTER PURCHASE TO GET
Gann Kare Göstergesi, W.D. Gann tarafından yazılan "Piyasa Tahminleri için Matematiksel Formül" makalesine dayalı güçlü bir piyasa analizi aracıdır. Bu araç, piyasa analizi için matematiksel ve Gann teorilerini kullanarak hassas analizler gerçekleştirir. 144, 90, 52 karelerini ve ayrıca 9 karesini kullanır. Ayrıca, 'ın 9 karesi ve bu kareyle ilişkili kanallar ve yıldız modelleri için yöntemini içerir. Kullanıcı Kılavuzu ve Uygulama: Bu göstergeleri kullanmadan önce, kullanıcı kılavuzunu okumanız
Breakout Arrows Mt4
Michael Oko Oboh
5 (1)
Trend Breakout Arrows Indicator The Trend Breakout Arrows Indicator is a momentum-based signal tool designed to identify potential bullish and bearish breakout opportunities. It displays clear arrow signals directly on the price chart, helping traders quickly recognize possible trend changes and continuation setups. Up Arrow (Buy Signal) A magenta up arrow appears below a candle when bullish momentum begins to strengthen. This signal indicates that buying pressure may be overtaking selling press
Neo Wave PRO
Nikolay Raykov
5 (1)
Price & Time Market Structure Indicator A professional market structure tool that analyzes waves through both price and time — not price alone. Main Description NeoWave PRO is a professional market structure indicator for MetaTrader 4 designed for traders who want to move beyond traditional one-dimensional wave tools such as ZigZag, swing indicators, and basic high/low systems. Most wave indicators analyze only one thing: Price. But a real market wave is not only a price movement. A true wave de
Bu ürün 2026 piyasası için güncellendi ve en son MT5 sürümleri için optimize edildi. FİYAT GÜNCELLEME BİLDİRİMİ: Smart Trend Trading System şu anda $99 fiyatıyla sunulmaktadır. Sonraki 30 satın alma işleminden sonra fiyat $199 olacaktır. ÖZEL TEKLİF: Smart Trend Trading System satın aldıktan sonra bana özel mesaj gönderin, Smart Universal EA’yı ÜCRETSİZ olarak alın ve Smart Trend sinyallerinizi otomatik işlemlere dönüştürün. Smart Trend Trading System, daha temiz sinyaller, daha iyi trend yönü
BTMM State Engine Pro is a MetaTrader 4 indicator for traders who use the Beat The Market Maker approach: Asian session context, kill zone timing, level progression, peak formation detection, and a multi-pair scanner from a single chart. It combines cycle state logic with a built-in scanner dashboard so you do not need the same tool on many charts at once. What it does Draws the Asian session range; session times can follow broker server offset or be set in inputs. Tracks level progression (L
IQ FX Gann Levels a precision trading indicator based on W.D. Gann’s square root methods . It plots real-time, non-repainting support and resistance levels to help traders confidently spot intraday and scalping opportunities with high accuracy. William Delbert Gann (W.D. Gann) was an exceptional market analyst, whose trading technique was based on a complex blend of mathematics, geometry, astrology, and ancient mathematics which proved to be extremely accurate. Setup & Guide:  Download  MT5 Ver
PRO Renko Sistemi, RENKO grafikleri ticareti için özel olarak tasarlanmış son derece hassas bir ticaret sistemidir. Bu, çeşitli ticaret araçlarına uygulanabilen evrensel bir sistemdir. Sistemi etkin piyasa sana doğru ters sinyallerine erişim hakkı denilen ses nötralize eder. Göstergenin kullanımı çok kolaydır ve sinyal üretiminden sorumlu tek bir parametreye sahiptir. Aracı, seçtiğiniz herhangi bir ticaret aracına ve renko çubuğunun boyutuna kolayca uyarlayabilirsiniz. Yazılımımla karlı bir
GOLD Impulse with Alert
Bernhard Schweigert
4.67 (12)
Bu gösterge, 2 ürünümüz Advanced Currency IMPULSE with ALERT  +   Currency Strength Exotics  'in süper bir kombinasyonudur. Tüm zaman dilimleri için çalışır ve 8 ana para birimi artı bir Sembol için grafiksel olarak güç veya zayıflık dürtüsünü gösterir! Bu Gösterge, Altın, Egzotik Çiftler, Emtialar, Endeksler veya Vadeli İşlemler gibi herhangi bir sembol için para birimi gücü ivmesini göstermek için uzmanlaşmıştır. Türünün ilk örneğidir, Altın, Gümüş, Petrol, DAX, US30, MXN, TRY, CNH vb. içi
ŞU ANDA %40INDIRIMLI Yeni Başlayanlar veya Uzman Tüccarlar için En İyi Çözüm! Bu Gösterge benzersiz, yüksek kaliteli ve uygun fiyatlı bir ticaret aracıdır çünkü bir dizi tescilli özellik ve yeni bir formül ekledik. Sadece BİR grafik ile 28 Forex çifti için Döviz Gücünü okuyabilirsiniz! Yeni bir trendin veya scalping fırsatının tam tetik noktasını belirleyebildiğiniz için ticaretinizin nasıl gelişeceğini hayal edin? Kullanım kılavuzu: buraya tıklayın Bu ilk olan, orijinal! Değersiz bir özent
The indicator scans for Dinapoli thrust pattern in multiple timeframes for the all markets filtered and shows the results on Dashboard. Key Features Dashboard can be used for all markets It can scan for thrust pattern on MN1, W1, D1, H4, H1, M30, M15 ,M5, M1 timeframes Ability to choose number of bars required above/below displaced moving average to define thrust Parameters UseMarketWatch: Set true to copy all symbols available in market watch MarketWatchCount : Set the number of symbols that
Enigmera
Ivan Stefanov
5 (8)
ENIGMERA: Pazarın Kalbi Önemli: MQL5.com demosu Strategy Tester'da çalışır ve Enigmera'nın tüm işlevlerini tam olarak yansıtmayabilir. Daha fazla bilgi için açıklamayı, ekran görüntülerini ve videoyu kontrol edin. Herhangi bir sorunuz varsa, bana mesaj göndermekten çekinmeyin! Göstergenin kodu tamamen yeniden yazılmıştır. 3.0 sürümü, yeni işlevler ekler ve göstergenin başlangıcından bu yana biriken hataları giderir. Giriş Bu gösterge ve ticaret sistemi, finansal piyasalara dikkat çekici bir ya
Bu gösterge, pratik ticaret için mükemmel olan otomatik dalga analizine yönelik bir göstergedir! Dava... Not:   Dalga sınıflandırması için Batılı isimleri kullanmaya alışkın değilim. Tang Lun'un (Tang Zhong Shuo Zen) adlandırma kuralının etkisiyle, temel dalgayı   kalem   , ikincil dalga bandını ise   segment   olarak adlandırdım. aynı zamanda segmentin trend yönü vardır. Adlandırma   esas olarak trend segmentidir   (bu adlandırma yöntemi gelecekteki notlarda kullanılacaktır, öncelikle söyleyey
Introduction Harmonic Patterns are best used to predict potential turning point. Traditionally, Harmonic Pattern was identified manually connecting peaks and troughs points in the chart. Manual harmonic pattern detection is painfully tedious and not suitable for everyone. You are often exposed under subjective pattern identification with manual pattern detection. To avoid these limitations, Harmonic Pattern Plus was designed to automate your harmonic pattern detection process. The functionality
Current event:  https://c.mql5.com/1/326/A2SR2025_NoMusic.gif A. A2SR nedir ?   * Önde gelen bir teknik göstergedir (yeniden boyama yok, gecikme yok). -- Rehberlik : -- https://www.mql5.com/en/blogs/post/734748/page4#comment_16532516 adresinde -- ve https://www.mql5.com/en/users/yohana/blog A2SR, Destek (talep) ve Direnç (arz) seviyelerini belirlemede özel bir tekniğe sahiptir. İnternette gördüğümüz sıradan yoldan farklı olarak A2SR, gerçek SR seviyelerini belirlemede özgün bir konsepte sahi
KT Alpha Hunter Arrows MT4
KEENBASE SOFTWARE SOLUTIONS
Çoğu ok göstergesi size yalnızca bir sinyal verir ve geri kalan her şeyi sizin çözmenizi bekler. KT Alpha Hunter Arrows ise size eksiksiz bir işlem planı sunar. Her sinyal oku, grafikte hazır bir planla birlikte görünür: giriş çizgisi, stop loss, dört take profit seviyesi ve bu sembol ile zaman diliminin o anda işlem yapmaya değer olup olmadığını gösteren canlı edge kararı. Pakete dahil olan Trade Manager EA, siz işleme girdikten sonra yönetimi üstlenir. Böylece piyasa hareketli ve duygusal açıd
Market Structure Patterns MT4
Samuel Manoel De Souza
5 (18)
Market Structure Patterns ,   smart money concepts   (akıllı para kavramları) temelinde geliştirilen ve   SMC/ICT   öğelerini grafik üzerinde gösteren bir göstergedir. Bu öğeler, işlem kararlarınızı bir üst seviyeye taşımanıza yardımcı olur. Grafikte bir unsur oluştuğunda, fiyat bir seviyeyi geçtiğinde veya bir kutu/bölgeye girdiğinde,   uyarılar ,   bildirimler   ve   e-posta mesajları   aracılığıyla anında bilgilendirilirsiniz. Geliştiriciler,   global variables   (küresel değişkenler) aracılı
PZ ABCD Retracement
PZ TRADING SLU
4 (5)
Identify precise entry and exit points with AB=CD patterns This indicator finds AB=CD retracement patterns. The AB=CD Retracement pattern is a 4-point price structure where the initial price segment is partially retraced and followed by an equidistant move from the completion of the pullback, and is the basic foundation for all harmonic patterns. [ Installation Guide | Update Guide | Troubleshooting | FAQ | All Products   ] Customizable pattern sizes Customizable AC and BD ratios Customizable b
Trend Lines PRO
Roman Podpora
5 (1)
TREND ÇİZGİLERİ PRO     Piyasanın gerçek yön değişimini anlamaya yardımcı olur. Gösterge, gerçek trend dönüşlerini ve büyük oyuncuların piyasaya yeniden girdiği noktaları gösterir. Anlıyorsun     BOS hatları  Daha yüksek zaman dilimlerindeki trend değişiklikleri ve önemli seviyeler, karmaşık ayarlar veya gereksiz gürültü olmadan gösterilir. Sinyaller yeniden çizilmez ve çubuk kapandıktan sonra grafikte kalır. VERSION MT 5     -    RFI LEVELS PRO  göstergesiyle birlikte kullanıldığında maksimum p
The Propfolio Master Suite is the ultimate all-in-one analytical workstation for professional traders. Combining the power of the Beat The Market Maker (BTMM) methodology, Smart Money Concepts (SND/Liquidity), and Advanced Volume Profile, this suite replaces multiple different indicators with one optimized engine. Monitor up to 14 pairs simultaneously from a single chart, instantly identify market cycles, and seamlessly map institutional footprints with the click of a button. The Command Center
Legacy of Gann
Pavel Zamoshnikov
4.83 (12)
The indicator very accurately determines the levels of the possible end of the trend and profit fixing. The method of determining levels is based on the ideas of W.D.Gann, using an algorithm developed by his follower Kirill Borovsky. Extremely high reliability of reaching levels (according to K. Borovsky  - 80-90%) Indispensable for any trading strategy – every trader needs to determine the exit point from the market! Precisely determines targets on any timeframes and any instruments (forex, met
RFI levels PRO
Roman Podpora
5 (1)
Bu gösterge, fiyat dönüş noktalarını ve fiyat geri dönüş bölgelerini doğru bir şekilde gösterir.       Başlıca oyuncular   . Yeni trendlerin nerede oluştuğunu görüyorsunuz ve her işlem üzerinde kontrolü elinizde tutarak, azami hassasiyetle kararlar alıyorsunuz. TREND LINES PRO   göstergesiyle birlikte kullanıldığında maksimum potansiyelini ortaya koyar.  VERSION MT5 Göstergenin gösterdiği şey: Yeni bir trendin başlangıcında aktivasyonla birlikte tersine dönüş yapıları ve tersine dönüş seviyeler
ŞU ANDA %40 INDIRIMLI !!! Yeni Başlayanlar veya Uzman Tüccarlar için En İyi Çözüm! Bu gösterge benzersiz, yüksek kaliteli ve uygun fiyatlı bir ticaret aracıdır çünkü bir dizi tescilli özellik ve gizli bir formül ekledik. Yalnızca BİR grafikle 28 döviz çiftinin tümü için Uyarılar verir. Yeni bir trendin veya scalping fırsatının tam tetik noktasını belirleyebildiğiniz için ticaretinizin nasıl gelişeceğini hayal edin! Yeni temel algoritmalar üzerine inşa edilen bu sistem, potansiyel işlemlerin
Yazarın diğer ürünleri
The indicator detects the following types of Japanese candlesticks: Doji, Hammer and/or Hanging Man, Shooting Star and/or Inverted Hammer, Spinning Top, Maribozu. The indicator is intended for manual and/or automated trading within an Expert Advisor. There is a possibility to choose colors for bullish and bearish candlesticks. For automated trading, use any indicator buffer of the double type: 0, 1, 2 or 3, whose value is not zero!
The indicator is intended for detecting big (long) and/or small (short) candlesticks. There is possibility of coloring the bullish and bearish candlesticks. The indicator can be used for manual and/or automated trading within an Expert Advisor. The indicator data that can be used for automated trading can be taken from one of four buffers of the double type: 0, 1, 2 or 3. Values must not be equal to zero. 
The indicator of DeMark fractals. The indicator can be drawn on the basis of price data and on the basis of a moving average. There is a possibility to color the up and down fractals. The indicator can be used for manual and for automated trading within an Expert Advisor. For automated trading, use any indicator buffer of the double type: 0 - up fractals, 1 - down fractals! Values of the buffers must not be equal to zero.  A moving average is drawn on the basis of input parameters: Calc_Method 
Stochastic Global
Igor Semyonov
4 (1)
Description A universal colored indicator Stochastic. The rising and falling lines and the levels of the indicator can be colored.   The indicator can be calculated as the standard one on the basis of a price or as a derivative on the basis of the following nineteen other indicators included in the standard package of the MetaTrader 4 terminal: AD - an indicator of accumulation and distribution of volume. OBV - On Balance Volume. Volume - tick volume indicator. AC - indicator of acceleration. AO
Description A universal colored indicator MACD Histo. The rising and falling of the indicator histogram can be colored.   The indicator can be calculated as the standard one on the basis of a price or as a derivative on the basis of the following twelve other indicators included in the standard package of the MetaTrader 4 terminal: AD - an indicator of accumulation and distribution of volume. OBV - On Balance Volume. Volume - tick volume indicator. Force - Force Index indicator. MFI - Money Flow
Description A colored universal indicator MACD Line (MA convergence-divergence indicator, shown as a histogram). The rising and falling of the indicator histogram can be colored. The indicator can be calculated as the standard one on the basis of a price or as a derivative on the basis of the following twelve other indicators included in the standard package of the MetaTrader 4 terminal: AD - an indicator of accumulation and distribution of volume. OBV - On Balance Volume. Volume - tick volume i
Description A universal indicator RSI together with moving averages based on it. Depending on the need, moving averages can be disabled. You can color the indicator lines and levels: lines of RSI, moving average lines and thresholds of overbought and oversold levels.   The indicator can be calculated as the standard one on the basis of a price or as a derivative on the basis of the following eighteen other indicators included in the standard package of the MT4 terminal: AD - an indicator of accu
CCI Global
Igor Semyonov
5 (1)
Description A universal indicator CCI together with moving averages based on it. Depending on the need, moving averages can be disabled. You can color the indicator lines and levels: lines of CCI, moving average lines and thresholds of overbought and oversold levels.   The indicator can be calculated as the standard one on the basis of a price or as a derivative on the basis of the following eighteen other indicators included in the standard package of the MetaTrader 4 terminal: AD - an indicato
Description A multi-purpose multi-colored/multi-symbol indicator, which is a set of standard tools from the MetaTrader 4 terminal. The difference is that below the basic price chart it allows to calculate and build in a separate window any of the twenty indicators in a colored form, painting bulls and bears in different colors, for any financial instrument in accordance with the list below:  AD - an indicator of accumulation and distribution of volume. OBV - On Balance Volume. Force - Force Inde
Description A colored universal indicator AO (Awesome Oscillator). The rising and falling of the indicator histogram can be colored.   The indicator can be calculated as the standard one or as a derivative on the basis of the following eleven other indicators included in the standard package of the MetaTrader 4 terminal: AD - an indicator of accumulation and distribution of volume. OBV - On Balance Volume. Volume - tick volume indicator. Force - Force Index indicator. MFI - Money Flow Index. ATR
Description A colored universal indicator MACD Classic (MA convergence-divergence indicator) that combines two indicators: MACD Line and MACD Histo. The rising and falling lines, the signal line and the indicator histogram can be colored. The indicator can be calculated as the standard one on the basis of a price or as a derivative on the basis of the following twelve other indicators included in the standard package of the MetaTrader 4 terminal: AD - an indicator of accumulation and distributio
Description The universal colored multicurrency/multisymbol indicator MACD Classic, consisting of two MACD indicators: MACD Line and MACD Histo. The indicator may be used with any broker, irrespective of the name of the financial instrument since it is necessary to manually enter the name as an input parameter. If you enter a non-existent or incorrect name of a financial instrument, you will receive an error message that this financial instrument is unknown (does not exist). Inputs Currency_Nam
Description A colored universal indicator/oscillator based on crossing moving averages. The rising and falling lines of the indicator histogram can be colored. The combined use of the line and the histogram increases the level of the analysis when making a decision to open or close deals. The indicator can be calculated as the standard Price Oscillator or as a derivative on the basis of the following eleven other indicators included in the standard package of the MetaTrader 4 terminal: AD - an i
Description A universal colored multicurrency/multi-symbol indicator RAVI. Was proposed by T. Chand as a trend indicator. RAVI means Range Action Verification Index. The indicator may be used with any broker, irrespective of the name of the financial instrument since it is necessary to manually enter the name as an input parameter. If you enter a non-existent or incorrect name of a financial instrument, you will receive an error message that this financial instrument is unknown (does not exist).
Description A colored multicurrency/multisymbol oscillator of the market mood. The oscillator is designed for detecting the continuation or change of the market mood prior to its occurrence. An excellent example is the screenshots that show all the features of the oscillator. The oscillator may be used with any broker, irrespective of the name of the financial instrument since it is necessary to manually enter the name as an input parameter. If you enter a non-existent or incorrect name of a fin
Description The indicator determines the appearance of internal bars on the chart, and paints them in accordance with the bullish and/or bearish mood. The indicator can notify of the appearance of a formed internal bar by playing a beep, as well as display the time remaining until the end of the formation of the current bar in the format of <d:h:m:s, where: < means the current bar. d - days. h - hours. m - minutes. s - seconds. The bullish and bearish mood can be colored. Inputs Sound_Play - a
Description The indicator determines the appearance of the bars that signal of a reversal of current local moods and plays a beep. It also paints these bars in accordance with the bullish and/or bearish priority. You can select the color for bullish and bearish moods. Inputs Sound_Play - a flag that allows the sound notification. Use Detection of the reversal bar can be a signal to perform appropriate trading activities.  The indicator can be used for manual or automated trading in an Expert A
Description The indicator determines the appearance of bars that notify of the reversal of the current trend, and paints them in accordance with the bullish and/or bearish mood. The indicator can notify of the appearance of a formed reversal bar by playing a beep, as well as display the time remaining until the end of the formation of the current bar in the format of <d:h:m:s, where: < means the current bar. d - days. h - hours. m - minutes. s - seconds. You can select the color for bullish and
Description A universal colored multicurrency/multi-symbol indicator of moving averages: Moving Average, Double Moving Average, Triple Moving Average . The indicator is drawn in a separate window, so below the main trading chart a user can see the development of another financial instrument. It is very useful when considering the combined values of various moving averages for different financial instruments below the main trading chart.  The indicator may be used with any broker, irrespective of
Description A universal colored indicator of moving averages: Moving Average, Double Moving Average, Triple Moving Average . The indicator provides various opportunities for the analysis of prices based on different ways of constructing moving averages in the window of the main financial instrument. You can color bullish and bearish moods. Inputs MA_Type - type of multiplicity: Moving Average. Double Moving Average. Triple Moving Average. MA_Period - the MA period. MA_Method - the averaging met
Description A colored universal multicurrency/multi-symbol indicator Bollinger Bands to be drawn in a separate window below the main financial instrument. The rising and falling line of the main indicator and Bollinger Bands can be colored. The indicator can be calculated based on one of the eleven basic indicators included in the standard package of the MetaTrader 4 terminal: AD - an indicator of accumulation and distribution of volume. OBV - On Balance Volume. Force - Force Index indicator. MF
Description A colored universal multicurrency/multi-symbol indicator Channel to be drawn in a separate window below the main financial instrument. The indicator uses the calculation method of the Price Channel indicator. The rising and falling line of the main indicator and the Channel lines can be colored. The indicator can be calculated based on one of the eleven basic indicators included in the standard package of the MetaTrader 4 terminal: AD - an indicator of accumulation and distribution o
Description Keltner's colored channel indicator,also called STARC band, drawn in the main chart window. The indicator uses the calculation technique of the three drawing options: basic, improved and modified . The first two were proposed by Keltner, the third one - by a successful trader L. Rakshe. You can also search for your own best parameters of the indicator. The upper, middle and lower bands can be colored. The indicator includes the basic analytical tool of the market moods by Keltner. Th
Description A colored universal multicurrency/multi-symbol indicator ZigZag to be drawn in a separate window below the main financial instrument. The indicator may be used with any broker, irrespective of the name of the financial instrument since it is necessary to manually enter the name as an input parameter. If you enter a non-existent or incorrect name of a financial instrument, you will receive an error message that this financial instrument is unknown (does not exist).  The indicator can
Description A colored channel indicator Price Channel to be drawn on the main chart of a financial symbol. It can color bullish and bearish moods based on the middle line of the indicator, as well as change the color of the upper and lower lines of the channel. Purpose The indicator can be used for manual or automated trading in an Expert Advisor. Values of indicator buffer of the double type can be used for automated trading:  The middle line of the indicator - buffer 4. The upper line of the
Description Candlesticks is a colored multicurrency/multy-symbol indicator. It shows a financial instrument as a candlestick chart in a separate window below the chart of the main financial symbo. The indicator may be used with any broker, irrespective of the name of the financial instrument since it is necessary to manually enter the name as an input parameter. If you enter a non-existent or incorrect name of a financial instrument, you will receive an error message that this financial instrume
Description Candlestick Tools  is a colored multicurrency/multy-symbol indicator. It shows one of four standard indicators as a candlestick chart in a separate window below the chart of the main financial symbol. The indicator is calculated based on one of two indicators included in the standard package of the МetaТrader 4 terminal: CCI - Commodity Channel Index. RSI - Relative Strength Index. The default indicator is Commodity Channel Index. The indicator may be used with any broker, irrespecti
Description Pivot Pro  is a universal color indicator of the  Pivot Points  levels systems. You can select one of its three versions:  Standard   Old , Standard New  and  Fibo . The system will automatically calculate the  Pivot Point  on the basis of market data for the previous day ( PERIOD_D1 ) and the system of support and resistance levels, three in each. It can also display price tags for each level. You can color the indicator lines. Only a method of calculation of the third level of supp
Description The indicator is intended for labeling the chart using horizontal levels and/or half-round prices. The indicator works on any financial instrument regardless of the name and the number of digits. A user can choose colors for the indicator lines. Input Parameters Calc_Method - method of calculation of the lines: levels of round prices. levels of half-round prices. Digits_Accepted - flag for calculating the levels according to number of decimal places in the quotes of a financial inst
Description A colored universal multicurrency/multi-symbol indicator MACD Line Smart (the indicator moving average convergence divergence is displayed as a histogram) based on double or triple moving average .  Comparing to the standard MACD this indicator is more sensitive to what allows generating advance signals. he indicator may be used with any broker, irrespective of the name of the financial instrument since it is necessary to manually enter the name as an input parameter. If you enter a
Filtrele:
Değerlendirme yok
Değerlendirmeye yanıt