NTickChart
- Göstergeler
-
Katsura Yamanouchi
 Biz MT5 kullanıcılarıyız.
Uzman Danışmanlar, Göstergeler, Komut Dosyaları, Hizmetler ve Sınıflar geliştiriyoruz.
Bob Volman'ın fiyat hareketi stratejisi bize ilham veriyor ve yöntemlerini MT5'e dahil etmeyi hedefliyoruz.
Kodlarımızın keyfini çıkarın! - Sürüm: 1.7
- Güncellendi: 14 Ekim 2025
NtickChart-BVcandle
Features
This is a free version with limited functionality.
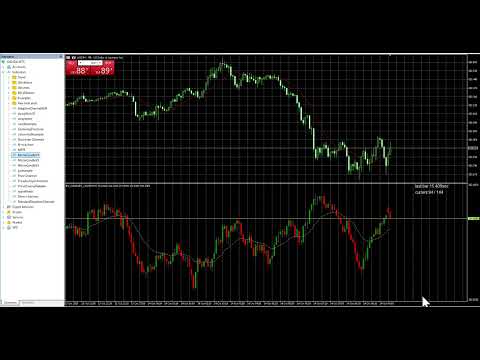
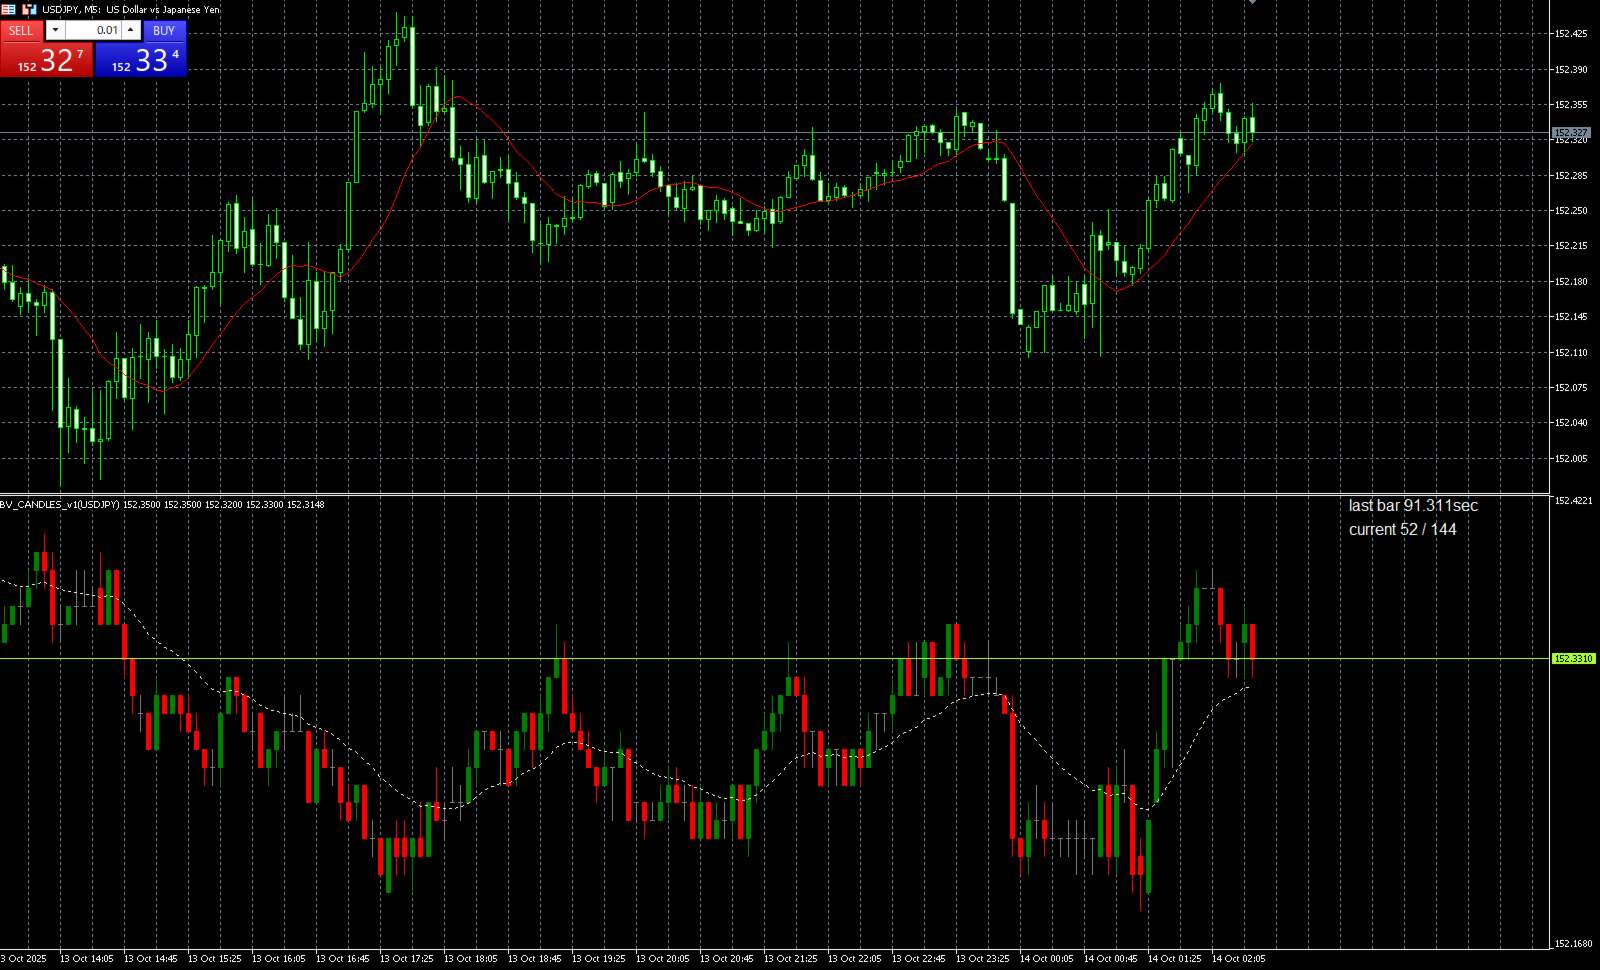
This is a tick chart indicator that displays in a sub-window.
Inspired by Bob Volman's (BV) scalping method, it is designed as a tool for achieving simple and effective trading. It is a tick chart specifically for day trading and scalping, focusing even on 1 pipette changes. Instead of time-based candle bars, it generates candle bars for a specified number of ticks (ticks_in_candle). This allows for a more detailed observation of short-term price fluctuations.
This indicator is particularly suitable for scalping in highly liquid currency pairs like EUR/USD, in environments with low spreads.
- Capture sudden market movements and aim for short-term profits.
- Quickly identify trend reversals and breakout points.
- Trade with a simple chart structure, avoiding distractions from unnecessary information.
Available Features:
- Tick count can be adjusted. BV recommends 70, but in today's high-volume trading environment, I recommend 144.
- The current price line can display Bid, Ask, or Mid (the midpoint between Ask and Bid) prices individually.
- Candlestick price values can be displayed in raw form (Nop) or rounded using one of the following methods: Round, Up, or Down.
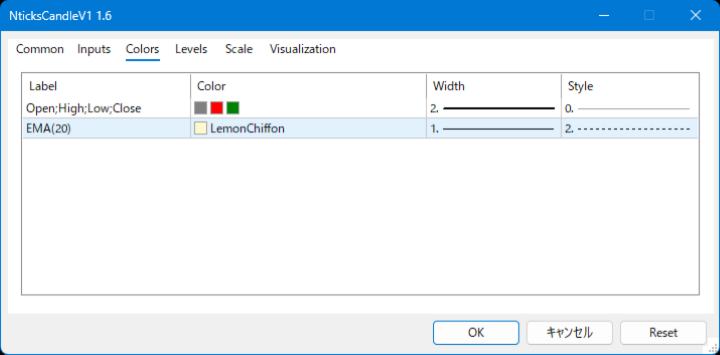
- Colors can be customized.
Default Settings
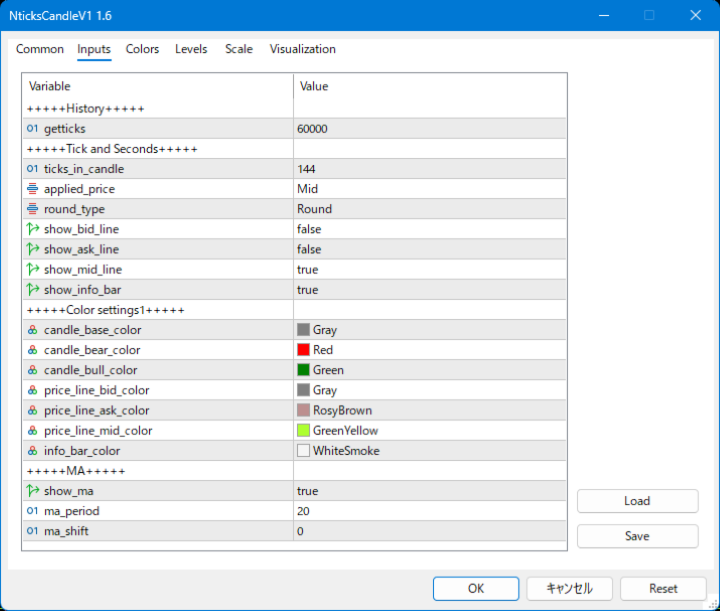
//--- input parameters
input group "+++++Tick and Seconds+++++";
input uint ticks_in_candle = 144; // Number of ticks per bar
input Eprice_types applied_price = Mid; // Price display type
input Eround_types round_type = Round; // Rounding display
input bool show_bid_line = false;
input bool show_ask_line = false;
input bool show_mid_line = true;
input group "+++++Color settings1+++++";
input color candle_base_color = clrGray;
input color candle_bear_color = clrRed;
input color candle_bull_color = clrGreen;
input color price_line_bid_color = clrGray;
input color price_line_ask_color = clrRosyBrown;
input color price_line_mid_color = clrGreenYellow;
Usage Notes (Limitations)
This indicator does not save buffer values to a file.
Other indicators cannot be overlaid on this tick chart.
How to Use
- Set the input parameters to your preferred values. The default settings are the creator's recommended configuration.
- Attach the indicator to the desired chart. There are no restrictions on currency pairs or timeframes (it is recommended to use it on timeframes below 5 minutes).
- Use it to assist in discretionary trading based on Bob Volman's method.