Yayınlanmış ürünler
Best Pivot Point Indicator display pivot points and support and resistance lines for the intraday trading. It calculates them using its own formula based on the previous trading session The indicator can display the following levels in addition to plain pivot points: Previous session's High and Low, today's Open. Sweet spots. Fibonacci levels. Camarilla pivots. Midpoint pivots.
FREE

The Swing High Low and Fibonacci Retracement Indicator is a powerful technical analysis tool designed to identify key price levels and potential reversal zones in the market. It automatically detects recent swing highs and swing lows on the chart and overlays Fibonacci retracement levels based on these points. This indicator helps traders: Visualize market structure by highlighting recent swing points. Identify support and resistance zones using Fibonacci ratios (e.g., 38.2%, 50%, 61.8%). Adapt
FREE
MetaTrader 5 İçin Saniyelik Grafik
Göstergeler, MetaTrader 5 terminalinde saniye cinsinden bir zaman dilimine sahip grafikler oluşturmanıza olanak tanır. Böyle bir grafikteki zaman dilimi dakika veya saat cinsinden değil saniye cinsinden ayarlanır. Böylece, M1'den daha kısa bir zaman dilimine sahip grafikler oluşturabilirsiniz. Örneğin, S15, 15 saniyelik bir periyoda sahip bir zaman dilimidir. Ortaya çıkan grafiğe göstergeleri, Uzman Danışmanları ve komut dosyalarını uygulayabilirsiniz.
Üzeri
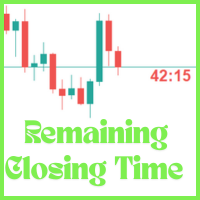
The Candle Remaining Closing Time indicator displays the amount of time left before the current candlestick closes on your chart. This tool is essential for traders who rely on precise timing to enter or exit trades, especially in fast-moving markets. By showing a real-time countdown, it helps you stay aware of upcoming candle completions across any timeframe—from 1-minute to daily charts. Whether you're a scalper watching minute-by-minute action or a swing trader timing key setups on higher tim
FREE
Indicator can be used for dxy correlation trading. it calculates the dollar index (USDX or DXY) using the EUR/USD, USD/JPY, GBP/USD, USD/CAD, USD/CHF and USD/SEK currency pairs. In order to trade them, you need to find a confirmed technical analysis pattern on the DXY chart and look for a correlated currency pair that has the same picture on its price chart.
The formula used for calculation is the following: USDX = 50.14348112 × EURUSD -0.576 × USDJPY 0.136 × GBPUSD -0.119 × USDCAD 0.091
FREE

MT5 için uyarılar içeren Otomatik Sabit Aralık Hacim Profili
Bu gösterge, fiyatın nerede daha fazla zaman harcadığını gösterir ve ticarette kullanılabilecek önemli seviyeleri vurgular.
ve belirli bir ticaret seansının en önemli fiyat seviyelerini, değer alanını ve kontrol değerini özetleyerek zaman içindeki fiyat yoğunluğunu gösterebilir. Bu gösterge, M1 ile D1 arasındaki zaman dilimlerine eklenebilir ve günlük, haftalık, aylık ve hatta gün içi oturumlar için Piyasa Profilini gösterir. Daha d

Support And Resistance indicator that can display round levels and zones . It shows them directly on the chart, providing an easy help when you want to set stop-loss or take-profit level, or when you want to see the next market target. If an asset price is moving down and bounces back up, the level is called support (think: price floor). If an asset price is moving upward and hits a level where it reverses downward, this is called resistance (think: price ceiling).
FREE
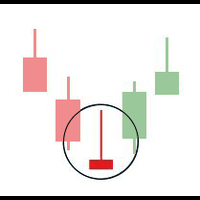
Basing Candles indicator is an automatic indicator that detects and marks basing candles on the chart. A basing candle is a candle with body length less than 50% of its high-low range. A basing candle or basing candlestick is a trading indicator whose body length is less than half of its range between the highs and lows. That's less than 50% of its range.
The indicator highlights the basing candles using custom candles directly in the main chart of the platform. The percentage criterion can be
FREE

This is a classic trading strategy based on two Moving Averages crossover. customized for usdjpy with a Good risk management strategy RR 1/2 . ( Long when fast MA crosses slow MA from below and Short when fast MA crosses slow MA from above ) TF : 5MIN MAX Lot size to use : 2% e.g : Balance =100 => lot size = 0.02 Balance =1000 => lot size = 0.20 Balance =10000 => lot size = 2
------
FREE

Volume Profile VPVR For MT5 Volume Profile VPVR is a powerful, high-performance MetaTrader 5 indicator designed to replicate the advanced Volume Profile (Visible Range) directly on your chart. It provides deep insight into market structure by visualizing where trading activity is concentrated, helping traders identify key price levels with precision. This indicator dynamically analyzes volume distribution across price levels and renders a detailed histogram directly on the chart, allowing you
This indicator Displays current spread in the main window of the chart. You can modify the font parameters, indicator's position and the normalization of the spread value. The spread is redrawn after each tick, ensuring the most current and active spread value. This can be useful for brokers with variable spreads or with spreads that are widened often. You can also enable a spread label to be shown near the current Bid line. you can also set alert : Email, and push notifications.
FREE

MT5 için İşlem Asistanı
Hassasiyet ve Kontrol için Kurumsal Düzeyde İşlem Yönetim Paneli Hız, doğruluk ve disiplinli risk kontrolü talep eden yatırımcılar için tasarlanmış profesyonel düzeyde bir işlem ve yönetim paneli olan MT5 için İşlem Asistanı ile işlemlerinizin tam kontrolünü elinize alın.
Performans ve kullanılabilirlik göz önünde bulundurularak geliştirilen bu araç, MetaTrader 5 grafiğinizi eksiksiz bir işlem iş istasyonuna dönüştürerek işlemleri güvenle gerçekleştirmenizi, yönetmen

Smart Money Concepts MQL5 – Full Historical Market Structure Indicator Smart Money Concepts MQL5 v4 is a powerful all-in-one market structure indicator designed for advanced traders who follow institutional trading logic. Converted from Pine Script and fully optimized for MetaTrader 5, this tool delivers accurate, real-time and historical visualization of Smart Money Concepts (SMC) directly on your chart. Unlike most indicators, it processes and draws complete historical data , allowing you to