Volume Profile For MT5
- Indicadores
- Versão: 2.1
- Atualizado: 1 maio 2026
- Ativações: 15

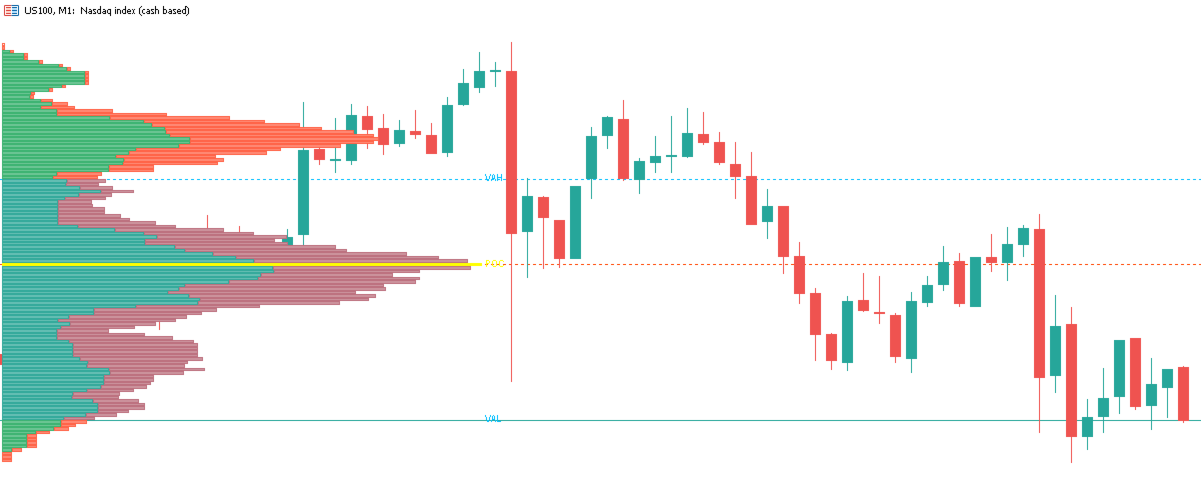
Perfil de Volume VPVR para MT5
O Perfil de Volume VPVR é um indicador poderoso e de alto desempenho para MetaTrader 5, projetado para replicar o Perfil de Volume (Faixa Visível) avançado diretamente no seu gráfico. Ele fornece uma visão profunda da estrutura do mercado, visualizando onde a atividade de negociação está concentrada, ajudando os traders a identificar níveis de preço importantes com precisão.
Este indicador analisa dinamicamente a distribuição do volume entre os níveis de preço e renderiza um histograma detalhado diretamente no gráfico, permitindo que você entenda rapidamente as zonas de aceitação e rejeição do mercado, bem como os clusters de liquidez.
🔍 Principais Recursos
• Modos Faixa Visível e Faixa Fixa
Alterne facilmente entre o VPVR (ajustando-se automaticamente às velas visíveis) ou defina sua própria faixa personalizada para uma análise precisa.
• Ponto de Controle (POC)
Detecta e destaca automaticamente o nível de preço com o maior volume negociado — o nível de maior interesse do mercado.
• Área de Valor (VAH / VAL)
Exibe os valores máximo e mínimo da Área de Valor com base em uma porcentagem configurável (padrão de 70%), ajudando a identificar zonas de valor justo.
• Divisão de Volume de Alta vs. Baixa
Cada barra de volume é dividida em pressão de compra (alta) e venda (baixa), proporcionando uma visão mais aprofundada do fluxo de ordens.
• Atualizações em Tempo Real (Baseadas em Ticks)
O perfil é atualizado continuamente com os ticks recebidos para acompanhamento do mercado ao vivo, sem atrasos.
• Extensão de Níveis-Chave
As linhas POC, VAH e VAL podem ser estendidas ao longo do gráfico, atuando como zonas dinâmicas de suporte/resistência.
• Posicionamento Ajustável do Perfil
Exiba o perfil no lado esquerdo ou direito do gráfico, dependendo do seu estilo de negociação.
• Escala de Volume (Visibilidade Aprimorada)
Estique ou comprima o histograma usando um multiplicador de escala de volume para maior clareza visual.
• Rótulos de Volume Integrados
Exiba opcionalmente os valores de volume de compra/venda diretamente dentro das barras do histograma com formatação inteligente (unidades K/M).
• POC em Desenvolvimento (Opcional)
Acompanhe a evolução do POC em tempo real para entender as mudanças no sentimento do mercado.
• Design Totalmente Personalizável
Controle cores, transparência, fontes, estilos de linha e layout para combinar com sua configuração de negociação.
⚙️ Como Funciona
O indicador divide a faixa de preço selecionada em várias linhas (intervalos) e distribui o volume com base na sobreposição de preços por vela. Em seguida:
Agrega o volume total por nível de preço
Identifica o nó de maior volume (POC)
Expande-se para calcular a Área de Valor (VAH/VAL)
Exibe um histograma mostrando a concentração de volume em cada preço
📊 Por que usar este indicador?
Identifique zonas de alta liquidez onde as instituições estão ativas
Identifique fortes níveis de suporte e resistência
Compreenda o equilíbrio versus desequilíbrio do mercado
Aprimore entradas, saídas e posicionamento de stops
Combine com conceitos de Smart Money ou estratégias de ação do preço
🚀 Ideal para
Day traders
Scalpers
Swing traders
Smart Money / Traders de Fluxo de Ordens
Este indicador traz a análise de volume de nível institucional para o MetaTrader 5 com uma implementação suave, otimizada e visualmente limpa — tornando-o uma ferramenta essencial para traders sérios.

O usuário não deixou nenhum comentário para sua avaliação