Win rate signal Price Range
- Göstergeler
-
Eve sense Co., Ltd.
 Geçtiğimiz 8 yıl boyunca, FX ve vadeli işlemlerle uğraşan bir şirkette çalıştım. Sonrasında, 7 yıl boyunca bir oyun geliştirme şirketinde öğrenim gördüm ve nihayetinde bir oyun geliştirme şirketi kurma kararı aldım.
 - Sürüm: 1.21
- Etkinleştirmeler: 5
■ Kazanma Oranı Hesaplama Sistemi ile Donatılmış Gösterge
【Gösterge Özellikleri】
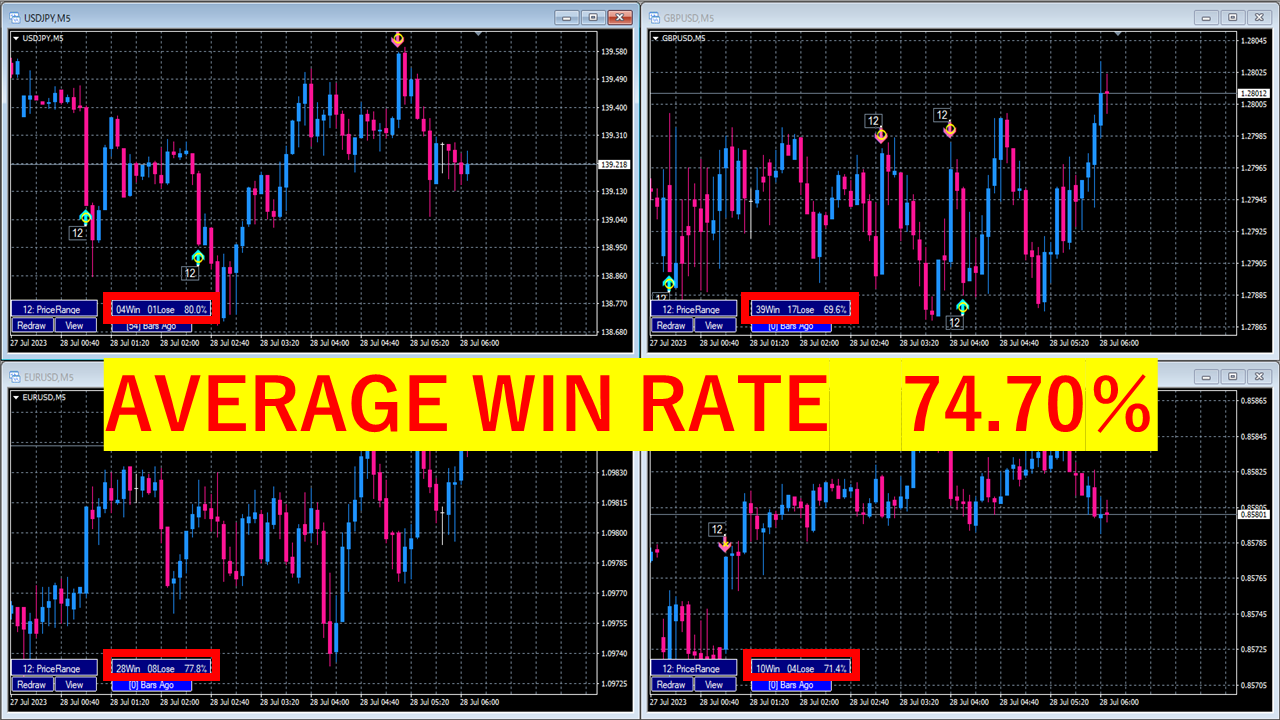
Bu gösterge, normal teknik analizi sinyal işaretleri aracılığıyla sezgisel ve net bir şekilde doğrulamanıza olanak tanır.
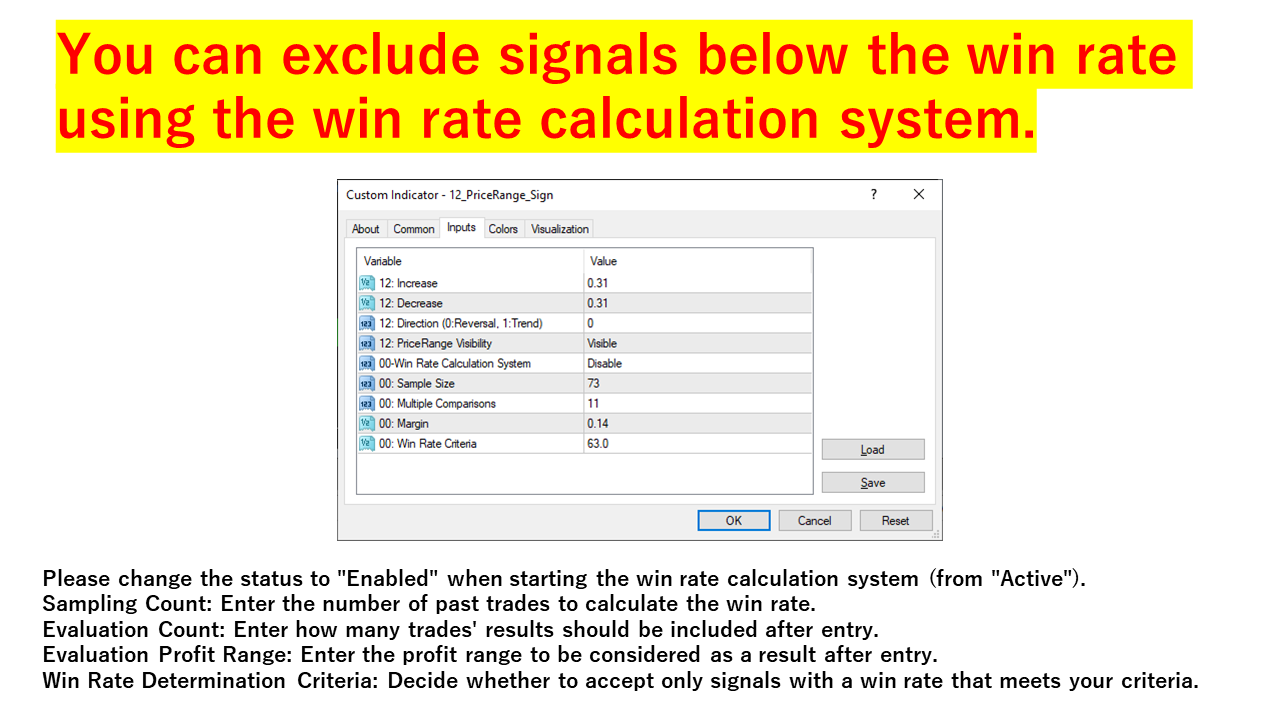
Ayrıca, mevcut parametrelerin uygun olup olmadığını kontrol eden ve kazanma oranı düşük olduğunda sinyal vermekten kaçınan otomatik bir kazanma oranı belirleme sistemine sahiptir.
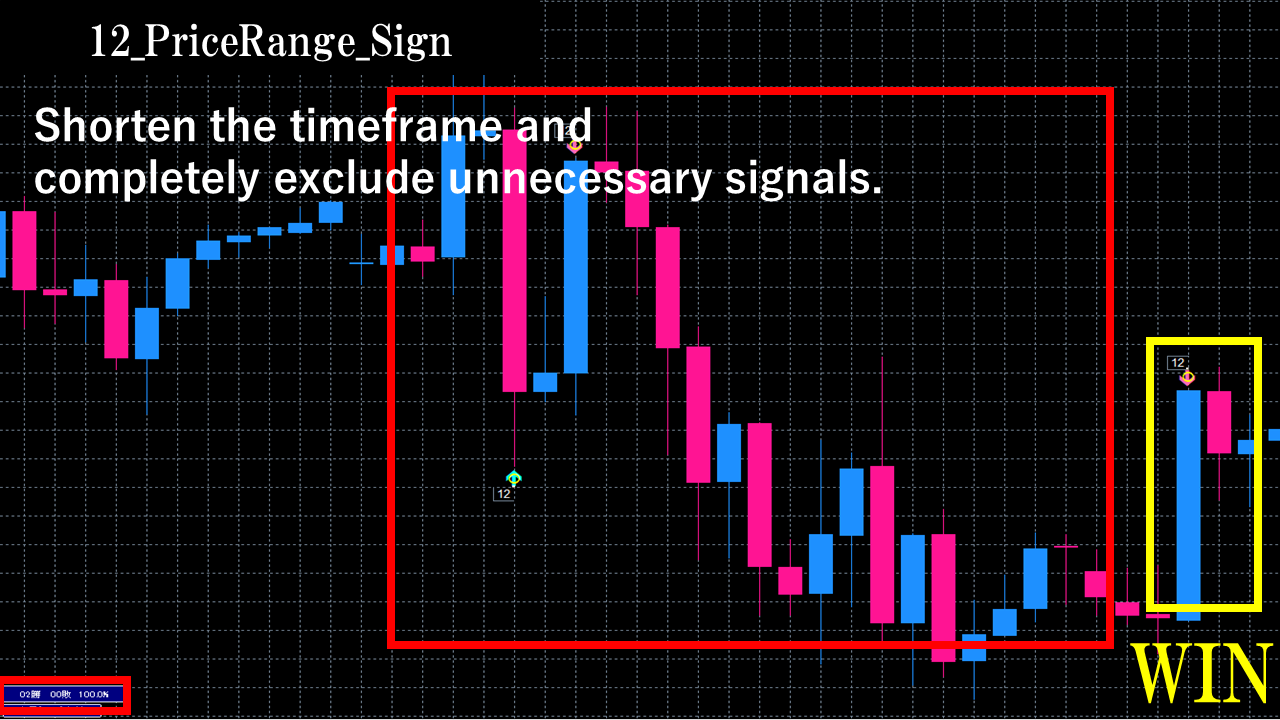
Bu, gereksiz girişleri azaltır ve yalnızca kazanma oranı yüksek olduğunda işlemlere girmenizi sağlar.
【Önemli Açıklama】
・Yeniden boyama yok. 1 dakikalık grafiklerden haftalık grafiklere kadar kullanılabilir.
・Para birimi kısıtlaması yok. Tüm döviz çiftleri için kullanılabilir.
· Kazanma oranlarını hesaplama yeteneği.
・Sinyaller, yalnızca önceden belirlenmiş kazanma oranına veya daha yüksek bir orana ulaşıldığında üretilir.
・Yükü azaltmak için optimize edildi! 9 döviz çifti ile uzun süreli çalışmaya ve eş zamanlı kullanıma uygundur.
・Tanınmış bir gösterge olarak, sinyalleri takip ederken çalışmayı sağlar.
・Hata ayıklama, sorunları çözmek için hata ayıklayıcılar tarafından desteklendi ve doğrulandı.
【Fiyat Aralığı İşareti Açıklaması】
FİYAT ARALIĞI, fiyat aralığını, yani fiyatların üst ve alt sınırlarını gösteren bir göstergedir.
Evesense tarafından geliştirilen belirli fiyat hareketlerine göre "ne zaman satılır" ve "ne zaman alınır" şeklinde ok işaretleri sağlar.
Geçmiş verilerden "ortalama değerleri" basit ama etkili bir şekilde hesaplar, 1 dakikalık ve 5 dakikalık grafikler için idealdir. Aynı zamanda, ani piyasa değişikliklerini ve beklenmedik haberleri idare edebilen çok yönlü bir araçtır.
【Gösterge Vurguları】
・Değişken ve hızla değişen piyasa koşullarında güçlü performans.
・Tutarlı ve sürekli hareketlerin olduğu pazarlar için uygun değildir.
【Giriş Sinyalleri】
・Satın Alma Sinyali: Fiyat, her döviz çifti için önceden belirlenmiş ortalama değerin altına düştüğünde girin.
・Sat Sinyali: Fiyat, her döviz çifti için önceden belirlenmiş ortalama değerin üzerine çıktığında girin.
Ani piyasa dalgalanmalarına ve beklenmedik haberlere sorunsuz bir şekilde uyum sağlamak için FİYAT ARALIĞINI kullanın ve alım satımlarınızın karlılığını artırın.
Bu araçla ticaret deneyiminizi bir üst seviyeye taşıyın!