 MetaTrader 5
 Uzmanlar
 Göstergeler
 Kütüphaneler
 Yardımcı programlar
 Widget'lar
 Kurallar
YouTube'dan Mağaza ile ilgili öğretici videoları izleyin
Bir alım-satım robotu veya gösterge nasıl satın alınır?
Uzman Danışmanınızı
sanal sunucuda çalıştırın
sanal sunucuda çalıştırın
Satın almadan önce göstergeyi/alım-satım robotunu test edin
Mağazada kazanç sağlamak ister misiniz?
Satış için bir ürün nasıl sunulur?
MetaTrader 4 için Uzman Danışmanlar ve Göstergeler - 25
 Alım-satım robotları piyasalarda otomatik olarak işlem yapar, göstergeler ise fiyatları analiz etmek ve fiyat değişikliklerindeki kalıpları belirlemek için kullanılır.
Bu alım-satım uygulamalarıyla, MetaTrader 4'te daha bilinçli alım-satım işlemleri gerçekleştirecek ve daha fazla alım-satım fırsatı yakalayacaksınız.

MultiLayer Signal — многоуровневый аналитический индикатор
Индикатор MultiLayer Signal объединяет сразу несколько подходов к анализу рынка: Уровни поддержки и сопротивления (на основе экстремумов за заданный период) Паттерны поглощения (бычьи и медвежьи) Сигналы на основе трендовой динамики Встроенный ZigZag с настраиваемой чувствительностью Многоуровневая EMA-фильтрация (микро-, макро- и быстрые/медленные скользящие)
️ Особенности: Возможность выбора режима: ️ “Закрытая свеча”
FREE
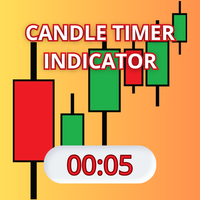
Candle Timer Indicator is a custom tool designed for the MetaTrader 4 (MQL4) trading platform. Its primary purpose is to display a moving timer on the chart, indicating the remaining time before the current candle closes. This feature is particularly useful for traders who need precise tracking of candle closing times for their technical analysis strategies. My indicators for free. I onl
FREE

Features: Sydney, Tokyo, London, and New York session lines — open and close Automatic DST adjustment: Australian (Oct–Apr), European (Mar–Oct), US (Mar–Nov). Tokyo fixed, no DST Toggle each session on or off independently Fully customizable: colors, line styles, line width, label size and position Runs on new bar only — no unnecessary recalculations Works on M1 through H1. Disabled on higher timeframes automatically Inputs: Show/hide each session independently Session open and close times in GM
FREE

Omnia Gold Pro MT4 MetaTrader 4 için profesyonel XAUUSD / Gold Expert Advisor . Akıllı trend-grid mantığı, ATR tabanlı adaptif aralık, spread koruması, drawdown kontrolü, margin güvenlik kontrolleri, seans filtresi ve grafikte gerçek zamanlı izleme özellikleri sunar. Omnia Gold Pro MT4 , XAUUSD üzerinde disiplinli otomatik işlem yapmak isteyen yatırımcılar için tasarlanmış, altın odaklı bir otomatik trading robotudur. Yapılandırılmış piyasa onayı, kontrollü grid uygulaması ve yerleşik risk korum
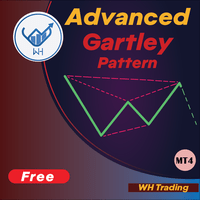
Gelişmiş Gartley Modeli tanıma göstergesine hoş geldiniz Bu gösterge, fiyat yapısının HH ve LL'sine ve Fibonacci Düzeylerine dayalı gartley desenini tespit eder ve belirli fib seviyeleri karşılandığında, gösterge grafiği grafikte gösterir. MT5 Sürümü: WH Advanced Gartley Pattern MT5
**Bu Gösterge, kombinasyonun bir parçasıdır WH Ultimate Harmonic Patterns MT4 Tüm model tanımayı içeren .** Özellikler : Gartley paternini yüksek ile tespit etmek için Gelişmiş Algoritma Doğruluk Çok
FREE

Candle Pattern Finder
Candle Pattern Finder is a powerful MT4 indicator designed to help traders easily detect key candlestick patterns in real-time. Whether you're trading trends, reversals, or consolidations, this tool highlights important price action signals directly on the chart — helping you make faster and more confident trading decisions. Detects popular candlestick patterns: Bullish/Bearish Engulfing Hammer & Inverted Hammer Shooting Star & Hanging Man Three White Soldiers Three Black
FREE

EZT Trend göstergesi size trendi, geri çekilmeyi ve giriş fırsatlarını gösterecektir. İsteğe bağlı filtreleme ve her türlü uyarı mevcuttur. E-posta ve anlık bildirim uyarıları eklendi. Ayrıca bu göstergeyi temel alan ve yakında kullanıma sunulacak bir EA da geliştiriyoruz.
İki renkli histogram ve bir çizgiden oluşan çok işlevli bir göstergedir. Bu, bir trendin yönünün ve gücünün görsel bir temsilidir; ayrıca çizgide veya histogramda birçok kez sapma bulacaksınız.
Gösterge, otomatik parametre

Market Oracle Cloud Reversal System is a replica of TradingView Market Oracle staging branch for MT4. It displays dynamic upper red cloud as resistance and lower green cloud as support based on Optimal Tuning (EMA 29) and ATR multiplier. Buy Reversal appears when price touches lower cloud and rejects, Sell Reversal when price touches upper cloud. Includes dashboard with Optimal Tuning, Prime Score and Consolidation Score. Works on all symbols and timeframes, non-repaint on closed bar. Tags: rev
FREE
BinaryPin is an indicator developed and adapted specifically for trading short-term binary options. The indicator's algorithm, before issuing the signal, analyzes many factors, such as market volatility, searches for the PinBar pattern, calculates the probability of success when making a deal. The indicator is set in the usual way. The indicator itself consists of an information window where the name of the trading instrument is displayed, the probability of making a successful transaction, the
FREE

B Williams Divergent Bar The indicator searches for and marks Divergent Bars on the chart according to Bill Williams' methodology. What it shows: Green upward arrow — potential bullish reversal (Bullish Divergent Bar). Red downward arrow — potential bearish reversal (Bearish Divergent Bar). Arrows appear only on closed bars. Signal logic: The indicator looks for bars with a large shadow in the direction of the reversal that update the local extremum (new local low or high), while being on the op
FREE

Break Tracer Göstergesi, MetaTrader 4 için yeniden boyamayan (non‑repainting) bir trend sistemidir. Üç bağımsız trend aracını tek bir görsel indikatörde birleştirir: hızlı EMA çifti (varsayılan 26 / 50), 200 periyotluk trend hareketli ortalama (EMA veya SMA, isteğe bağlı daha yüksek zaman dilimi çapasıyla) ve yatay/range koşullarını filtreleyen ATR tabanlı bir kanal. Yönlü bir sinyal yalnızca üç bileşen de aynı yönde olduğunda oluşur — mumun kanalın dışında kapanması, trend MA’ya göre doğru tara
FREE
Automated strategies are commonly used by institutional investors, banks, and hedge funds due to their ability to handle large volumes of trades with greater precision and efficiency. However, they are also increasingly being adopted by individual traders who use trading platforms that offer automated trading capabilities. While a profit of 10 percent may seem small , it can add up over time with consistent trading . It is important to note that trading involves risks, and traders should a
FREE

The QQE indicator is a momentum-based indicator used to identify trends and sideways. The Qualitative Quantitative Estimate (QQE) indicator works like a smoothed version of the popular Relative Strength Index (RSI) indicator. QQE extends the RSI by adding two volatility-based trailing stops. This indicator is converted from Trading View QQE MOD by Mihkel00 to be used in MT4 Version.

Cloud Stair is an Indicator has 2 Cloud (Up Trend and Down Trend). Cloud will turn Red when trend go down. Cloud will turn Blue when trend go up. You can use this indicator as a Support and Resistance level. Trend very strong when there are no opposite side. Open Buy position when the indicator show blue cloud and no red cloud. Open Sell position when the indicator show red cloud and no blue cloud.

Free. Set your risk, click Buy or Sell, done. TrueRisk Trade Panel works out the lot size for you. Type how much of your account you want to risk (for example 1%), set the stop loss in points or drag it on the chart, and the BUY and SELL buttons already show the right lot. No lot calculator, no guessing, no trade that risks ten times more than you meant. TrueRisk Account Dashboard MT4 (free) | TrueRisk Symbol Changer MT4 (free) | MT5 version | All TrueRisk tools Lot size from your risk: % of bal
FREE

En yeni algoritmik ticaret ve para yönetimi teknolojileriyle oluşturulmuş otomatik ticaret robotu.
Üç ticaret sınıfını aynı anda birleştirir:
trend riskten korunma Çoklu parabirim Sermayeniz, stop emirleri ve hesaptaki toplam alım satım pozisyonunun yönetimi ile korunur.
Herhangi bir ticaret enstrümanı üzerinde çalışır.
Not. MT4 terminalinin özellikleri nedeniyle, test cihazında çok para birimli danışmanları test etmek imkansızdır. Yalnızca Gerçek veya Demo hesabı. Sadık kiralama koşulları
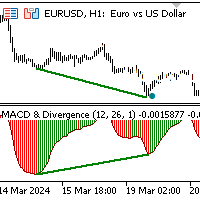
The indicator identifies divergence by analyzing the slopes of lines connecting price and MACD histogram peaks or troughs. Bullish Divergence (Convergence): Occurs when the lines connecting MACD troughs and corresponding price troughs have opposite slopes and are converging. Bearish Divergence: Occurs when the lines connecting MACD peaks and corresponding price peaks have opposite slopes and are diverging. When a divergence signal is detected, the indicator marks the chart with dots at the pric

Stochastic Scanner is a multi symbol multi timeframe Stochastic dashboard that monitors the indicator for price entering and exiting overbought and oversold in up to 28 symbols and 9 timeframes.
Download Demo here (Scans only M1 and W1) Settings description here MT5 version here
Stochastic Scanner features: Signals price entering and exiting the overbought and oversold zones. Monitors up to 28 customizable instruments and 9 timeframes at the same time. You can choose between 3 alert mode
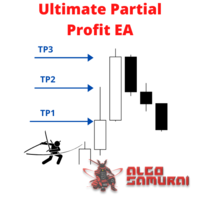
This EA Utility delivers a robust solution for managing an unlimited array of open orders, both manual and automated. It enables customizable partial profit levels utilizing metrics such as pips, ratios, ATR (Average True Range), and profit amounts for precise trade management. The utility features an advanced on-screen display, offering clear visualization of all orders and their profit levels to enhance strategic decision-making and control. To evaluate its performance and interface, the EA s

CandleCrusherX Scalping EA analyses the market situation on volume and strong price movement within internal Timeframe. It works on all major forex pairs and Timeframes (M5 or M15 recommend). The EA has integrated dynamic Take Profit, this means, if you reach your defined TP it gives you the chance to follow on the Trend by dynamic TP & SL and extend your profits. Also a News Filter function is integrated, to prevent miss trades on News events. Dynamic Lot calculation integrated On Request we ad
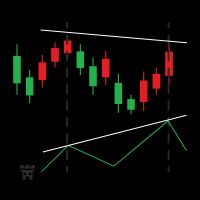
Investment Castle RSI Divergence — Catch the Turn Early
The RSI Divergence Indicator helps you spot potential reversals before they happen by detecting discrepancies between the RSI and price. Divergence is one of the most respected early signals of a trend change — from bullish to bearish or vice versa — now flagged for you automatically.
What it does for you Automatic divergence detection: bullish and bearish RSI/price divergences flagged on your chart. Earlier reads on reversals: see moment
FREE
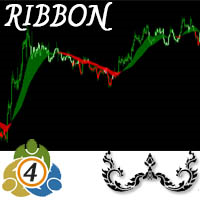
This indicator is a simple tool to spot a possible trend.
When the ribbon below the price bars, It will turn to Green color and the trend is seen to be bullish When the ribbon above the price bars, it will turn to Red color and the trend is seen to be bearish. It can be used a either Entry Signal Exit Signal or trailing stop, so it is very versatile. By default color : Green is UP trend and Red is Down trend and this work perfect with Bar4Colors.ex4
FREE

SR Breakout EA MT4 Launch Promo: Depending on the demand, the EA may become a paid product in the future. Presets: Click Here Key Features: Easy Installation : Ready to go in just a few steps - simply drag the EA onto any chart and load the settings. Safe Risk Management: No martingale, grid, or other high-risk money management techniques. Risk management, stop loss, and take profit levels can be adjusted in the settings. Customizable Parameters: Flexible configuration for individual trading pr
FREE

See my other products here. One Click Order This product helps you to send your order as quickly and easily as possible. Send your order as fast as possible: Just set your position parameter values(Price, TP, SL, Ex Date) with just a few simple mouse drags. On the other hand, the calculation of the losses and profits value before ordering is always a big challenge for traders; This expert is very useful in taking a position and calculating the amount of the stop loss/the take profit(in the curr
FREE
The TPSproDraW indicator allows to draw continuous zigzag lines on the chart. This handy tool will strike fancy of those traders who trade using technical analysis and need visual expression to forecast the price movement.
A drawn continuous zigzag line can be removed as easily as it is drawn - just aim a mouse cursor to the zigzag line and press the Shift key. How it helps:
The Z key - double press to enable the mode of drawing patterns, press one time to disable the mode, Esc - cancel drawn ob
FREE

TİCARİ FOTOKOPİ MAKİNESİ - YATIRIMCI ŞİFRESİ - KOPYA TİCARET - MT4 x MT5 CROSS PLATFORM
Not: Müşteri hesabının takip edeceği ana hesapta hem "Mirror Copier Master"a hem de ana hesabı takip edecek müşteri hesabında "Mirror Copier Client"a ihtiyacınız vardır.
Bloglar : https://www.mql5.com/en/blogs/post/756897
NASIL ÇALIŞIR :
https://www.youtube.com/watch?v=V7FNpuzrg5M
MT4 Sürümü
Usta : https://www.mql5.com/en/market/product/114774
Müşteri: https://www.mql5.com/en/market/product/114843
Akıllı Şebeke Seti EA, bir şebekede bekleyen emirleri yerleştirmek için esnek ve kullanıcı dostu bir uzman danışmandır. Denge mantığını, birden fazla takip eden durdurma modunu, manuel şebeke yerleşimini, özelleştirilebilir lot boyutlarını ve sezgisel bir grafik içi arayüzü destekler. Grid veya ortalama stratejileri kullanan yatırımcılar için idealdir. Temel Özellikler Özelleştirilebilir bir ızgarada Satın Alma Durdurma ve Satış Durdurma emirleri yerleştirin Her ızgara seviyesi için ay
FREE
Indicator overview Trend indicator usage Moving averages. Highest quality alerts that need no introduction. It is completely loyal to the original algorithm and uses other useful features.
Easy to trade Carry out all kinds of notifications It's not a new paint and it's not a back paint. Setting Indicator EMA50 in Time frame H1 for any pair currency and Gold Spot. EMA200 in Time frame H1 for any pair currency and more than EMA250 for Gold spot. Using it for maximum benefit Set up notification
FREE
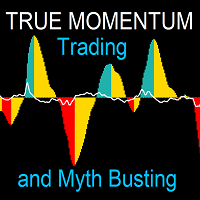
This indicator represents a genuine momentum oscillator according to the true definition of "Momentum", and as realised by the techniques of digital filtering. ( Note : download a complete set of true momentum oscillators here ). A scholarly paper on the subject by the current developer can be found here , but in this description we shall borrow only the minimum of conceptual and mathematical framework needed. In the process, we expose some long-held myths about indicators supposedly measurin
FREE

The Market Structures Pro indicator finds and displays 5 (five) patterns of the Smart Money Concepts (SMC) system on the chart, namely:
Break Of Structures (BoS) Change of character (CHoCH) Equal Highs & Lows Premium, Equilibrium and Discount zones with Fibo grid High-high, Low-low, High-low and Low-high extremes
Patterns are displayed for two modes - Swing and Internal and are easily distinguished by color on the chart. Internal mode features higher contrast colors, finer lines, and smal
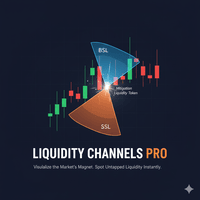
Liquidity Channels Pro MT5 VERSION HERE Here our more valuable tools
SMC Trend Trading , Easy SMC Trading , Institutional SMC Architect Volume Analysis Tools , Volume flow Profile , Market volume profile , FVG with Volume , Liquidity Heatmap Profile , Volume Spread Analysis Liquidity Channels is a sophisticated Smart Money Concepts (SMC) tool designed to automate the identification of Buy Side Liquidity (BSL) and Sell Side Liquidity (SSL) . Unlike standard support a

FREE for the First 50 Users
================================================================ ShowKillZones v1.0 - Corrected NY AM end time from 11 to 10, and NY PM end time from 17 to 16 (adjusted to Kill Zone hours) [cite: 321, 326] - Changed NY AM/PM labels to Kill Zone [cite: 321, 326]
v1.0 - User Manual [cite: 321] ================================================================
[Overview] This indicator displays ICT Kill Zones (session hours) on the chart as background zones an
FREE

See which fair value gaps flipped sides. This indicator marks every inversion fair value gap (IFVG) - a gap that a candle closed straight through - signals and alerts when price comes back to it and respects it, and checks on your own chart what price did next. ICT Inversion Fair Value Gap IFVG Honest Stats finds fair value gaps, waits for a candle to close through one and turns it into an inversion gap on the other side: a bearish gap closed above becomes bullish support, a bullish gap closed b
FREE

Çift çizgi sinyalleri, iki seviyeli sistem, çoklu zaman dilimi desteği, özelleştirilebilir görsel sinyaller ve yüksek oranda yapılandırılabilir uyarı sistemi ile gelişmiş Fisher Transform göstergesi.
Serbest programlama hizmetleri, güncellemeler ve diğer TrueTL ürünleri MQL5 profilimde mevcuttur.
Geri bildirim ve incelemeler çok değerlidir!
Fisher Transform Nedir? Fisher Transform, fiyatları Gauss normal dağılımına dönüştüren teknik bir göstergedir. John Ehlers tarafından geliştirilen bu göst
FREE
Çift çizgi sinyalleri, tek seviyeli sistem, çoklu zaman dilimi desteği, özelleştirilebilir görsel sinyaller ve yüksek oranda yapılandırılabilir uyarı sistemi ile Gelişmiş MACD (Hareketli Ortalama Yakınsama Iraksaması).
Freelance programlama hizmetleri, güncellemeler ve diğer TrueTL ürünleri MQL5 profilimde mevcuttur.
Geri bildirim ve değerlendirmeleriniz çok değerlidir!
MACD Nedir? MACD (Moving Average Convergence Divergence), bir varlığın fiyatının iki üstel hareketli ortalaması arasındaki i
FREE
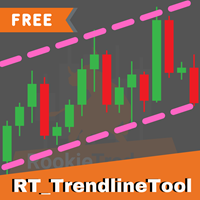
RT_TrendlineTool : Semi-AutoTrendline Tool on MT4 2 easy steps, just press the [T] button on your keyboard and click on the Swing High/Low that you're interested.
Then the indicator will try to draw a trendline that runs through only the wick, not cut through candlestick's body
and try to cross the swing point as much as possible with the least slope of the trendline. You can draw up to 10 trendlines.
You are able to get alert when price breakout these trendlines. Additional Hotkey : Press [M]
FREE

Indicator designed for both beginners and professionals. RECOMMEHDATION Trade with this indicator for 2-3 weeks and you will feel significant progress in your trading. This indicator is developed based on the use of HMA, Laguerre, CCI . The indicator is clear and does not require any setting. Does not redraw and works by opening bar. It works on timeframes M1-D1. I use timeframe M5 to enter the market.
FREE

First time on MetaTrader, introducing IQ Star Lines - an original Vedic Astrology based indicator. "Millionaires don't use astrology, billionaires do" . - J.P. Morgan, Legendary American financier and banker. We don't offer free or bonus indicators in exchange of reviews from you. You won't need any free products with this indicator to make it work. ;) Enjoy! Welcome to the new and updated IQ Star Lines , the ultimate fusion of ancient planetary harmonic cycles and modern quantitative trading.

ALPHA TP ZONE – SMART TAKE PROFIT & LIQUIDITY TOOL Alpha TP Zone is a professional trading indicator designed to help traders identify liquidity zones, take profit targets, and high-probability reaction areas with precision. KEY FEATURES Automatic Liquidity Detection (Buy & Sell Zones) Smart Take Profit Levels (Institutional Target) Clean Zone Visualization (No Lag) Real-Time Market Reaction Mapping Built-in Alert System Multi-Timeframe Compatible HOW IT WORKS The indicator
FREE
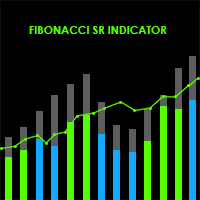
Fibonacci SR Indicator
This indicator creates support and resistance lines. This indicator is based on Fibonacci Retracement and Extension levels. It will consider many combinations of the Fibonacci levels and draw support/resistance lines based on these. This indicator uses tops and bottoms drawn by the ZigZag indicator in its calculations. The ZigZag can also be drawn on the chart, if necessary. The indicator considers many combinations of past reversal points and Fibonacci ratio levels, and w
FREE
This indicator finds the "Double Bottom" and "Double Top" technical analysis patterns, shows them on the chart of the currency pair and can signal if the pattern was formed recently. These patterns are reversal, often after the emergence of the trend turns back or a correction occurs. In order not to search for them yourself, it is enough to add the indicator to the chart, after that, you can change different timeframes in order to quickly find such figures on one of the timeframes. There are so
FREE
Bu gösterge, TradingView'deki "ATR Based Trendlines - JD" by Duyck göstergesinin MetaTrader 4'e uyarlanmış versiyonudur. Çalışma Prensibi:
Bu gösterge, yalnızca fiyata değil aynı zamanda ATR tarafından algılanan volatiliteye dayalı olarak otomatik ve sürekli trend çizgileri çizer. Böylece trend çizgilerinin açısı, ATR'nin (belirli bir yüzdesi) tarafından belirlenir. Trend çizgilerinin açısı, pivot noktasının tespit edildiği andaki ATR'nin belirlediği fiyat değişimlerini takip eder. ATR yüzdesi,
FREE

ZBubbles Delta — Professional Volume Indicator for MT4
See volume the way institutions see it. Trade where smart money enters.
ZBubbles Delta is an advanced volume analysis indicator for MetaTrader 4, combining statistical anomaly detection, ADX trend filtering, and built-in binary options statistics with Martingale tracking.
Unlike standard volume histograms, ZBubbles Delta draws dynamic colored bubbles directly on price action, showing where institutional volume entered and how strong the

GOLD SESSION LIQUIDITY MAP
Gold Session Liquidity Map is a multi-market MT4 indicator for session structure, liquidity, breakout probability, Fibonacci mapping and multi-timeframe momentum.
Originally developed around Gold/XAUUSD, it can also be used on Forex, Oil, indices and cryptocurrencies. Calculations use the current chart symbol and timeframe.
The indicator is built around three questions:
LOCATION - Where is price relative to session structure? DIRECTION - Which side currently has st

Advanced Market Maker Dashboard by G-Labs — Beat The Market Maker multi-pair scanner for MetaTrader 4. Seventeen-column ADR dashboard with price formation, breaker blocks, TDI SharkFin, RSI divergence, stop hunt, daily candle confirmation, currency strength, and chart overlays from one panel.
The full BTMM workflow dashboard for traders who have outgrown a basic scanner. Monitor 28 or more pairs in real time: trend direction, peak formation side (PFH/PFL), ADR expansion in MAX and real-time col

''Trendlines'' is an Indicator, that every Trader need and shows Trendline and Support and resistance levels in all Timeframe's. Also In 1-hour, 4-hour and daily time frames and Current timeframes, support, and resistance levels are specified and trend lines are drawn so that the trader can see all levels on a chart. In Properties it is possible to turn off unnecessary Lines.
In ' Tendency indicator '' , as full package of Predictions that every Trader need, there is also the Predict
FREE

G-Labs IC Breaker by G-Labs — ICT source and breaker order blocks for MetaTrader 4. Multi-timeframe structural zones, breaker invalidation on close, retest alerts, and per-timeframe colour control on one chart.
Marks where opposing liquidity rested before a move and what happens when structure breaks. Source order blocks draw as outlined rectangles from the first opposite-colour candle after a structural break. When price closes through the tracked extreme, the zone flips to a filled breaker bl
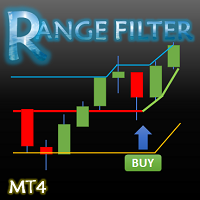
This indicator converted from 5 min Buy and Sell Range Filter - guikroth version on TradingView Popularity of the Range Filter
The Range Filter is a very popular and effective indicator in its own right, with adjustments to the few simple settings it is possible to use the Range Filter for helping filter price movement, whether helping to determine trend direction or ranges, to timing breakout or even reversal entries. Its practical versatility makes it ideal for integrating it's signals into a

This indicator is SO SIMPLE… when the green Rise Coming arrow appears, a price drop may be on the way! Plain and easy profits! As you receive more than one 'Rise Coming' text signal in a downtrend, it means momentum is building larger for a bull run. HOW TO USE 1. When the green "Rise Coming" text appears, a price jump may be on the way! This indicator Never Repaints! To get the best setting it's a matter of tweaking the indicator until it gives you the best results. Our recommendation, and what

Advanced CRT Indicator MT4 — Candle Range Theory Tool
Advanced CRT Indicator MT4 is a professional analysis tool that automates Candle Range Theory. It identifies consolidation ranges, breakout levels, Fair Value Gaps (FVG), and profit targets, with a real-time dashboard and alerts.
Overview - Multi-timeframe candle range detection - Automatic breakout levels with buffer settings - Fair Value Gap identification and tracking - Up to three customizable target levels (Risk:Reward ratios)
"GA Moving Average" ("GA Hareketli Ortalama"), hareketli ortalamaların kesişmesi stratejisini kullanan bir Uzman Danışman'dır (EA). Mükemmel stratejinizi oluşturmak için hayal ettiğiniz şekilde birçok ayar içermektedir.
"GA Moving Average" EA'nın temel kavramı, potansiyel ticaret fırsatlarını belirlemek için hareketli ortalama göstergelerini kullanmaktır. Farklı hareketli ortalamalar arasındaki etkileşimi analiz ederek, bu EA piyasada alım ve satım sinyalleri üretmeyi amaçlamaktadır.
Ana özel
FREE

HIZOA Dynamic Support & Resistance is a clean, adaptive market-structure indicator for MetaTrader 4, designed to visualize dynamic support and resistance across multiple market horizons. Instead of displaying only one fixed support and resistance calculation, the indicator continuously analyzes three different historical lookback periods. This creates three dynamic resistance levels and three dynamic support levels, allowing traders to view short-, medium- and longer-term market structure direc
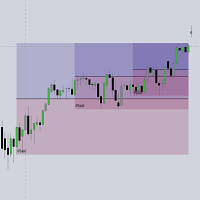
This script automatically calculates and updates ICT's daily IPDA look back time intervals and their respective discount / equilibrium / premium, so you don't have to :) IPDA stands for Interbank Price Delivery Algorithm. Said algorithm appears to be referencing the past 20, 40, and 60 days intervals as points of reference to define ranges and related PD arrays. Intraday traders can find most value in the 20 Day Look Back box, by observing imbalances and points of interest. Longer term traders c
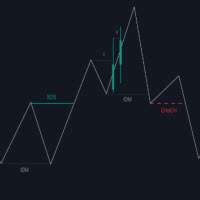
The Market Structure with Inducements & Sweeps indicator is a unique take on Smart Money Concepts related market structure labels that aims to give traders a more precise interpretation considering various factors.
Compared to traditional market structure scripts that include Change of Character (CHoCH) & Break of Structures (BOS) -- this script also includes the detection of Inducements (IDM) & Sweeps which are major components of determining other structures labeled on the chart.
SMC & pri

Automatic trading Advisor .This is a free version of the expert Advisor "Trend Analyzer Pro" https://www.mql5.com/ru/market/product/42792.В the robot is based on 2 strategies: at the intersection of moving averages and Bollinger bands indicator .In the paid version, three strategies are available, which increases profitability several times .Designed for the EURUSD H1 currency pair.It is possible to use it on other tools after optimization.Test only on tick data.
** Does not use such dangerous
FREE

The Heikin Ashi indicator is our version of the Heikin Ashi chart. Unlike competitor products, this indicator offers extensive options for calculating Heikin Ashi candles. In addition, it can be displayed as a classic or smoothed version.
The indicator can calculate Heikin Ashi with moving average by four methods: SMA - Simple Moving Average SMMA - Smoothed Moving Average EMA - Exponential Moving Average LWMA - Linear Weighted Moving Average
Main features The indicator shows Heikin As
FREE
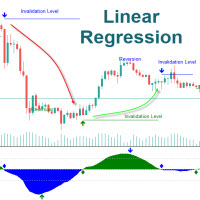
The Linear Regression Oscillator (LRO) is a technical indicator based on linear regression analysis, commonly used in financial markets to assess the momentum and direction of price trends. It measures the distance between the current price and the value predicted by a linear regression line, which is essentially the best-fit line over a specified period. Here’s a breakdown of how it works and its components: Key Components of the Linear Regression Oscillator Linear Regression Line (Best-Fit
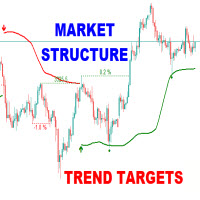
The Market Structure Trend Targets is a powerful trading indicator designed to give traders a clear, structured, and data-driven view of market momentum, breakouts, and key price reaction zones. Built on the principles of smart market structure analysis , it helps identify not only trend direction, but also precise breakout levels , trend exhaustion , and potential reversal zones — all with visual clarity and trader-friendly metrics. Key Features Breakout Points with Numbered Markers

Apex Synergy Pro EA - Technical Description Apex Synergy Pro EA is an automated multi-currency trading system developed for MetaTrader 5. The algorithm integrates multi-timeframe price action analysis and momentum indicators to detect trend continuation and reversal setups across major currency pairs and precious metals. Core Strategy & Logic Multi-Timeframe Trend Analysis: Evaluates higher timeframe market direction while looking for precise trigger signals on lower execution timeframes. Dynam
Çoklu zaman dilimi desteği, özelleştirilebilir görsel sinyaller ve yapılandırılabilir uyarı sistemi ile Bollinger Bands göstergesi.
Freelance programlama hizmetleri, güncellemeler ve diğer TrueTL ürünleri MQL5 profilimde mevcuttur.
Geri bildirim ve değerlendirmeler çok memnuniyetle karşılanır!
Bollinger Bands Nedir? Bollinger Bantları, üç çizgiden oluşan bir teknik analiz aracıdır: orta bant (hareketli ortalama), üst bant ve alt bant. Üst ve alt bantlar, orta banttan standart sapmalar olarak
FREE
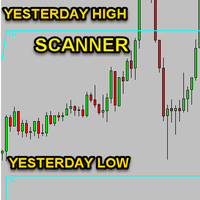
No idea why demo is not working. you can check the GIF to see how it works.
Features With this scanner you can detect Candles which are below/above yesterday high/low lines. A pair's rectangle turns RED in dashboard if it is above the yesterday high, and rectangle turns GREEN in dashboard if it is below the yesterday low. It gives alerts in every 15m candle close. Contains a Dashboard which will help you to see all market pair's. It is possible to disable this sorting through to make it easier

- Real price is 80$ - 40% Discount (It is 49$ now) Contact me for instruction, add group and any questions! - New Update: 2026/10 - Non-repaint - I just sell my products in Elif Kaya profile, any other websites are stolen old versions, So no any new updates or support. - Lifetime update free Related product: Bitcoin Expert
Introduction The breakout and retest strategy is traded support and resistance levels. it involves price breaking through a previous level. The break and retest strateg
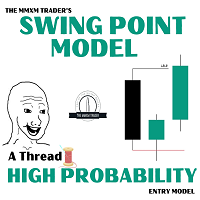
Introducing the Swing Point Model Indicator – A Professional Trading Tool The Swing Point Model Indicator is an innovative tool designed for traders who want to capture market structure and identify potential trading opportunities. With a logical and transparent approach, the Swing Point Model helps you gain deeper market insights and make precise trading decisions. This is multiple Timeframe indicator so you can choose Higher timeframe for detect Swing point model What Is the Swing Point Mo

Mum Grafiği Renk Göstergesi - Haftanın Gününe Göre Renkli Mum Grafiği Göstergesi
Nedir?
Haftanın gününe bağlı olarak grafikteki mum grafiklerini renklendiren basit bir görsel araçtır. Pazartesi bir renk, Salı başka bir renk ve benzeri şekilde renklendirilir. Fiyatların haftanın belirli günlerinde ne sıklıkla belirli bir şekilde davrandığını hiç merak ettiniz mi? Bu gösterge, bu tür kalıpları görmenize yardımcı olur.
Kimler İçindir?
Şu amaçlarla işlem yapan yatırımcılar için:
Geçmiş veriler
FREE

Night Swimmer, gece kafa derisi yüzen güçlü bir EA'dır:
Düşük değişken piyasa koşulları için tasarlanmış gelişmiş bir ölçeklendirme sistemi olan Night Swimmer EA ile gece ticaretini deneyimleyin. Bu EA'yı dikkatli kullanmak ve yalnızca rahat olduğunuz miktarda risk almak önemlidir. EA'yı gerçek tıklama modellemeyle tekrar test etmenizi ve sizin için en uygun olanı bulmak için ayarları denemenizi öneririz.
Bu EA ÜCRETSİZDİR; Dolayısıyla EA'yı beğendiyseniz lütfen 5 yıldızlı bir derecelendirme
FREE
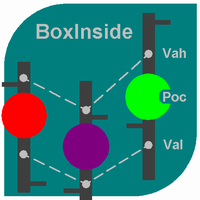
This indicator calculates the volume profile and places labels that correspond to the VAH, VAL and POC levels, for each candle individually.
Indicator operation features The indicator works on the timeframes from M5 to MN, but it uses the history data of smaller periods: M1 - for periods from M5 to H1, M5 - for the H4 period, M30 - for the D1 period, H4 - for the W1 period, D1 - for the MN period. The color and location of the VAL, VAH and POC labels on the current candle are considered to be c
FREE

Gösterge, grafikteki herhangi bir metni ve herhangi bir görüntüyü görüntüler ve ayrıca makrolar tarafından istenen bilgileri de görüntüleyebilir. Üç metin bloğu ve görüntüler için bir blok vardır. Yazı tipi seçimi, boyutu, rengi, girintisi ve konumlandırması mevcuttur. Ekran görüntülerinizi markalamak veya gerekli bilgileri bir grafik üzerinde görüntülemek istiyorsanız, UPD1 Watermark çok kullanışlı bir araç olacaktır.
Ayar açıklaması.
Metin ayarları (3 blok). Text 1, 2, 3 – metin ve veya mak
FREE
Candlestick Pattern Analyzer for MT4 Açıklama
Candlestick Pattern Analyzer, hem discretionary hem de sistematik trader’lar için geliştirilmiş ileri seviye bir araçtır. Önemli Japon mum formasyonlarını otomatik olarak tespit etmek ve bunların geçmiş performanslarına dair detaylı istatistiksel analiz sunmak üzere tasarlanmıştır. Bu gösterge, formasyonların gerçek dünyadaki etkinliğini nesnel şekilde doğrulamak ve bunları onaylayıcı filtrelerle (örneğin trend, önemli seviyeler, hacim) ve iyi tanım

Helmsman Trade Manager ÜCRETSİZ VE ÖYLE KALMAK ÜZERE YAPILDI Ne işlem yapmak istediğinizi zaten biliyorsunuz. Zor olan, etrafındaki her şey: riskinize gerçekten uyan lot, kendi kendine ilerleyen stop, almayı düşündüğünüz kısmi kapanış, gece üçte kendinize verip sabah onda bozduğunuz söz. Helmsman bu kısmı üstlenir; dikkatiniz ait olduğu yere, grafiğe döner. İŞLEMİ ÇİZİN, HESAPLAMAYIN Giriş, stop ve hedefi grafik üzerinde sürükleyin. Her çizgi kendi mesafesini, parasını ve kazanç/risk oranını siz
FREE

R Wolfe Wave göstergesi, fiyat hareketini analiz eder ve birikmiş verileri güçlü bir Wolfe Wave grafik modeli teknik aracına dönüştürür. Temelde, R Wolfe Wave grafik paterni hem yükseliş hem de düşüş eğilimi gösterebilir ve tüccarların gecikmeli göstergeler olmadan alım satım işlemleri açmasına yardımcı olabilir.
Anahtar noktaları Güçlü Wolfe Wave modellerini tanımlar Gelişmiş tüccarlar için Herhangi bir döviz çifti için çalışır Gösterge koleksiyonunuza eklemeye değer Bu gösterge, herhangi bir
FREE
MetaTrader Mağazası - yatırımcılar için alım-satım robotları ve teknik göstergeler doğrudan işlem terminalinde mevcuttur.
MQL5.community ödeme sistemi, MetaTrader Hizmetlerindeki işlemler için MQL5.com sitesinin tüm kayıtlı kullanıcıları tarafından kullanılabilir. WebMoney, PayPal veya banka kartı kullanarak para yatırabilir ve çekebilirsiniz.

Alım-satım fırsatlarını kaçırıyorsunuz:
- Ücretsiz alım-satım uygulamaları
- İşlem kopyalama için 8.000'den fazla sinyal
- Finansal piyasaları keşfetmek için ekonomik haberler
Kayıt
Giriş yap
Web sitesi politikasını ve kullanım şartlarını kabul edersiniz
Hesabınız yoksa, lütfen kaydolun