 MetaTrader 5
 专家
专家
 指标
指标
 程序库
程序库
 实用工具
实用工具
 窗口小部件
窗口小部件
 规则
规则
适用于MetaTrader 4的EA交易和指标 - 25
 EA交易自动执行市场交易,而指标可使您更准确地分析报价并预测价格行为。
通过这些应用程序,您将能够更明智地在MetaTrader 4执行交易,抓住更多的交易机会。
EA交易自动执行市场交易,而指标可使您更准确地分析报价并预测价格行为。
通过这些应用程序,您将能够更明智地在MetaTrader 4执行交易,抓住更多的交易机会。 
### ADX and DI v1.00
将TradingView上BeikabuOyaji的"ADX and DI"指标忠实移植到MQL4/MQL5。该指标是TradingView上使用最广泛的ADX实现之一,拥有超过43,000名用户。在单个子窗口中显示+DI、−DI和ADX,采用混合平滑方法:方向性指数使用Wilder平滑法,ADX线使用简单移动平均线。
#### 计算原理
该指标实现了Welles Wilder的方向性运动系统,在ADX的最终计算中有一个显著区别:
- **True Range、+DM、−DM** 按照Wilder的原始定义计算,方向性运动之间遵循互斥规则 - **TR、+DM、−DM的平滑** 使用Wilder的滚动求和法:S(i) = S(i−1) − S(i−1)/N + 值 - **+DI和−DI** 为平滑后的方向性运动与平滑后True Range的比值,以百分比表示 - **DX** 衡量+DI与−DI之间的标准化差异 - **ADX** 计算为所选周期内DX的 **简单移动平均线(SMA)** ,而非经典公式中Wilder的SMMA
基
FREE

Session Atlas — MetaTrader 4 专业交易时段地图 Session Atlas 是一款适用于 MT4 的可视化指标,可将普通图表转换为清晰直观的交易日时段地图。它直接在图表上显示主要交易时段的开盘、收盘和活跃状态,帮助您快速判断市场当前处于亚洲、欧洲还是美洲交易阶段。 许多交易者会分析价格水平、动量、突破和波动率,却往往忽略一个重要因素——时间。同一个交易信号在亚洲、欧洲和美洲时段可能会有完全不同的表现。Session Atlas 让您无需手动标记、无需频繁查看时间,也不会给图表增加多余的视觉干扰,即可快速掌握当前市场环境。 该指标会自动使用彩色区域标记图表上的交易时段。每个区域都会显示对应交易时段的持续时间和价格波动范围,并将不同的交易阶段清晰分隔。借助这些信息,您可以更容易发现市场何时处于平静状态、何时开始出现动量、何时流动性增加,以及价格何时仅处于盘整阶段。 Session Atlas 的功能 该指标显示以下主要交易时段: Asia
Europe
America 每个交易时段都可以单独启用或关闭。区域颜色、透明度、名称标签、开盘和收盘线、信息面板以及通知功
FREE

GoldKiller EA – Professional Expert Advisor for Gold Trading (XAUUSD) General Overview GoldKiller EA is an advanced Expert Advisor specifically designed for gold trading (XAUUSD) . It is not a simple grid robot, but a complete capital, risk, and profit management system , built to operate over the long term in an extremely volatile market. Unlike classic EAs focused purely on raw performance, GoldKiller prioritizes capital preservation , progressive profit protection , and strict risk control .

Sarah EA Mt4 Ea is so Unique rich EA with amazing different parameters like lot sizing , auto lot sizing , risk % , maximum lot size slippage in points , tp and sl also maximum spread control , it has many sections in parameters like trading settings , technical settings , strategy settings , risk management and drawdowns also sessions and trading settings also news filter and visual settings it will make trading so easy for you it has amazing trading recovery system it works with any pair but
FREE

The " YK Find Support And Resistance " indicator is a technical analysis tool used to identify key support and resistance levels on a price chart. Its features and functions are as follows:
1. Displays support and resistance levels using arrow lines and colored bands, with resistance in red and support in green.
2. Can be adjusted to calculate and display results from a specified timeframe using the forced_tf variable. If set to 0, it will use the current timeframe of the chart.
3. Uses the
FREE
Индикатор "Reversal zone" показывает силовые уровни и возможные точки разворота на текущем графике. Индикатор "Reversal zone" поможет трейдеру разобраться с текущей ситуацией The "Reverse zone" indicator shows power levels and possible reversal points on the current chart. The "Reverse zone" indicator will help the trader to deal with the current situation
FREE

SnR Key Level MT4 by RWBTradeLab
A clean, non-repainting Support & Resistance key level detector for MetaTrader 4, built for price action traders who want clear, fixed SnR reference levels with breakout upgrades, smart overlap-free labels and optional alerts — all from CLOSED candles only.
What This Indicator Does
The indicator automatically detects and draws 6 types of SnR key levels from 2-candle sequences:
Base Key Levels - A Level: Green -> Red (Level = 1st Green candle Close) — Resista
FREE

MetaTrader 4 上可定制化的期间分隔线 内置的期间分隔线功能不允许用户指定时间间隔,所以你可以使用这个指标来创建可定制的期间分隔线。
在日内图表上,你可以在特定的时间放置期间分隔线,你也可以选择在周一的特定时间放置额外的分隔线,以标记一周的开始。
在其他时间周期图表上,该指标的功能与内置的期间分隔线相同。
在日线图上,期间分隔线被放置在每个月的开始日。
在周线图和月线图上,期间分隔线被放置在每年的起始日。
输入 period_separator_hour period_separator_minute period_separator_color period_separator_width period_separator_style week_separator_hour week_separator_minute week_separator_color week_separator_width week_separator_style MT5 版本: https://www.mql5.com/en/market/product/91679
FREE

Auto Fibonacci displays the 38.2, 61.8, and 78.6 Fib levels directly on the chart, helping traders who use these key retracement zones consistently for trade planning or confluence. Drawing Fibonacci levels manually over and over again can take time, especially when done with wick-to-wick precision. Auto Fibonacci removes that friction by detecting the latest trend leg and placing the main Fibonacci levels automatically. Key Benefits Shows only the major Fibonacci levels to keep the chart clean
FREE

Fer Scalphunter 持续运作,每周 5 天、每天 24 小时顺势开仓,使用两条移动平均线。如果价格反转,它会开始网格交易和马丁格尔交易,直到价格回到初始方向,并盈利平仓所有交易。
功能 :
该机器人已针对 M5 时间框架下的 GBPUSD 进行了优化。它也可以针对其他交易品种进行优化。
建议余额 :
CENT 账户 500 美元 STANDARD 账户 5,000 美元 FUNDING 账户 50,000 美元
如需获取其余优化套件,请通过私信索取。
可配置参数 : 固定手数 基于账户余额的动态手数:手数随账户余额增加而增加。 止盈 止损 追踪止损 EA 可建仓的最大交易数量 网格 网格交易之间的距离 马丁格尔乘数 可建仓的最大网格交易数量 移动平均线:移动平均线配置 交易时间过滤器 每日最大回撤限制:如果达到每日最大回撤,机器人将停止交易,直至第二天(适用于账户注资阶段) 总利润目标百分比
支持 :
通过 MQL5 私信请求优化设置和支持。
FREE

This indicator is based on Guppy's GMMA Strategy. And shows arrows when GMMA lines cross up or down. To have this indicator and get alerts for Multiple Timeframes and multiple Pairs you can check out the demo of this GMMA Trend Scanner indicator: https://www.mql5.com/en/market/product/38747
About GMMA In Brief:
GMMA attempts to identify trends by combining two groups of moving averages with differing time periods: The long-term EMAs (30, 35, 40, 45, 50, and 60) the behaviors of investors that h
FREE

Descent Blade 指标是一套用于 MetaTrader 4 的非重绘趋势反转信号系统。它将 Wilder 抛物线 SAR 与一个滞后一根 K 线的变体结合,用于入场信号检测,并叠加比尔·威廉姆斯分形层,用来生成止盈与重新入场信号。所有信号都只在已确认收盘的 K 线上计算——一旦历史信号绘制出来,就不会移动、改变或消失。 该系统针对的是原始抛物线 SAR 交易的核心问题:标准 SAR 在震荡行情中频繁翻转,在真正的趋势变化之间制造出大量虚假信号。滞后变体充当结构性确认阀门,滤除高频噪音,同时仍能在每一次真实的趋势反转时触发信号。BW 分形层则为止盈和重新入场提供与结构相匹配的信号,会根据每一笔交易的摆动结构进行自适应调整。 查看 MT5 版本: Descent Blade MT5 查看更多产品: 所有产 品 想查看实盘示例和新工具,请访问我的个人主页并发送好友请求,以免错过任何更新! 工作原理 滞后 PSAR 交叉引擎 指标计算一个 Wilder 抛物线 SAR,支持可配置的 Start、Increment 和 Max 加速因子。滞后 PSAR 是在标准 SAR 基础上向
FREE

EasyADX - Color Trend Histogram & Alerts for MT5 Visual color-coded ADX Trend Histogram with automatic pop-up and push notifications. Instantly spot strong trends and filter out noisy sideways markets. Key Features: 3-Color Visual Histogram: Green for Strong Uptrends, Red for Strong Downtrends, Gray for Flat/Ranging markets. Custom ADX Threshold: Easily adjust the trend filter level (default at 25). Real-Time Alerts: Get Pop-up alerts and Push Notifications on your phone right at the start of a
FREE

Market Profile 3 MetaTrader 4 indicator — is a classic Market Profile implementation that can show the price density over time, outlining the most important price levels, value area, and control value of a given trading session. This indicator can be attached to timeframes between M1 and D1 and will show the Market Profile for daily, weekly, monthly, or even intraday sessions. Lower timeframes offer higher precision. Higher timeframes are recommended for better visibility. It is also possible t
FREE

该程序将使分析多个时间范围更加方便。
这将有助于在不同的时间范围同步图表中同步所有图表以显示相同的符号, 相同的特定时间段和同步绘图对象同时显示在所有图表上
在这个版本中,只有 6 种对象类型可以同步所有图表。
绘图对象类型支持:垂直/水平线、趋势线、矩形、箭头、斐波纳契回撤
附加功能:趋势线警报 如果您想在价格触及趋势线时获得警报,您只需在描述字段中将“alert”一词放在趋势线属性中, 当价格触及该趋势线时,MT4 会弹出提示信息,您也将通过 MT4 App 收到通知
使用方法>> https://youtu.be/NEHUW7v1h1c
报告问题或关注最新版本更新
网站: www.RookieTraders.com LineID:@RookieTraders
FREE

======================================================== XAUUSD ELLIOTT WAVE + REAL YIELD (MTF LEVELS/TARGETS) - MQL5/MT4 MARKET DESCRIPTION (formatting: **bold** = Bold button; lines with • = bullet list; UPPERCASE = heading) ========================================================
OVERVIEW ------------------------------------------------------- **XAUUSD Elliott Wave + Real Yield** maps Elliott structure with ZigZag pivots and motive/corrective checks, then filters signals with a **real-yield
FREE

介绍 Ea CloseManager MT4,一个专门为 MetaTrader 4 量身定制的 Expert Advisor (EA),旨在简化和自动化交易平仓过程。这个强大的工具为手动和自动交易策略提供了精确的退出标准控制,使其成为各个水平交易者的理想选择。 MQL产品安装指南 | 在 MT4/MT5 上更新已购买的MQL产品 | 常见故障排除指南 | 常规设置 / 输入指南 | 回测和设置文件 使用 Ea CloseManager MT4,用户在交易管理中节省了大量时间,并改善了风险控制。利用这个 EA 的交易者报告称,通过适应快速变化市场条件的有纪律的退出策略,盈利能力得到了提升,特别是在 forex、指数和加密货币方面。 MQL产品安装指南 | 在 MT4/MT5 上更新已购买的MQL产品 | 常见故障排除指南 | 常规设置 / 输入指南 | 回测和设置文件 主要特点 自动交易平仓:根据可自定义的标准无缝关闭交易,确保有纪律的退出。 盈亏管理:设定特定的盈亏阈值以进行自动调整,提高整体交易表现。 基于蜡烛的平仓:在定义的蜡烛数量后自动终止交易,允许有效的基于时间的策略。 回撤控
FREE

Developed by Etienne Botes and Douglas Siepman, the Vortex Indicator consists of two oscillators that capture positive and negative trend movement. In creating this indicator, Botes and Seipman drew on the work of Welles Wilder and Viktor Schauberger, who is considered the father of implosion technology. Despite a rather involved formula, the indicator is quite straightforward to understand and easy to interpret. A bullish signal triggers when the positive trend indicator (VI+ green line) crosse
FREE

Zig Zag 123 tells us when a reversal or continuation is more likely by looking at the shift in supply and demand. When this happens a signature pattern appears known as 123 (also known ABC) will often break out in direction of higher low or lower high.
Stop loss and take profit levels have been added. There is a panel that shows the overall performance of your trades for if you was to use these stop loss and take profit levels.
We get alerted if a pattern 123 appears and also if the price re
FREE

专注于NZDCAD的稳定型EA 主要特点 自适应的提前获利策略
当多单网格仓位累积时,EA会自动启动提前获利逻辑,保持健康的保证金水平。 基于持仓时间的退出机制
如果持仓时间超过预设时限,系统将提前平仓,以降低风险并锁定利润。 灵活设置止盈幅度
多头和空头仓位可分别设定独立的止盈目标,满足不同交易风格和风险偏好的需求。 稳健且安心的交易模式
每笔交易的收益相对较小,但更注重长期稳定的业绩与交易的安心感。 历史业绩 在 2007年8月21日 至 2025年6月27日 期间,初始资金 10,000美元 增长至 84,297美元 。 收益因子(PF): 1.98 最大回撤: 36.67% 胜率: 67.23% 交易条件 复利:启用 所需保证金:每0.01手需700美元 止损设置:关闭

RSI + EMA Momentum MetaTrader 4 Indicator for RSI-Based Momentum Analysis RSI + EMA Momentum is a MetaTrader 4 indicator designed to measure momentum using the relationship between RSI and its exponential moving average (EMA). Instead of relying exclusively on traditional overbought and oversold levels, the indicator evaluates the distance between RSI and its EMA and normalizes the result using standard deviation. This approach provides a momentum score that adapts to different volatility condit
FREE

Overview Auto Fibonacci EA is a professional trading tool designed to automatically detect swing points and draw Fibonacci retracement levels on your charts. This indicator helps traders identify potential support and resistance zones based on the golden ratio principles. Key Features Automatic Swing Detection Intelligent algorithm identifies swing high and swing low points automatically Customizable swing detection sensitivity (SwingBars parameter) Works on all timeframes: M1, M5, M15, M30, H1
FREE

Now free. The key Fibonacci pivot levels, drawn for you automatically every day, on any timeframe.
Automatic Fibonacci Pivots calculates the daily support and resistance from the Fibonacci sequence and plots them clean on your chart: the daily pivot, S1/S2/S3 below and R1/R2/R3 above. These are the price zones where the market tends to react, bounce or break, and now you see them without drawing a single line.
What it does: - Daily Fibonacci pivot levels (pivot, S1/S2/S3, R1/R2/R3), updated
FREE

Ninja Trader EA – 适用于MetaTrader的专业剥头皮顾问 为什么选择Ninja Trader EA?
Ninja Trader EA 是一款功能强大、可靠且高科技的交易顾问,专为剥头皮交易设计。它结合了严格的风险管理、利润保护和高精度的入场点。不使用危险的方法(马丁格尔、网格、平均加仓),这款顾问非常适合初学者和专业交易者。 Ninja Trader EA的主要优势: ️ 安全交易: 不使用马丁格尔、网格或平均加仓。只有清晰的逻辑和明确的规则。
️ 存款保护: 内置止损、止盈和追踪止损,最大限度地保护您的资本。
️ 自动手数计算: 便捷的风险管理系统允许您根据存款调整头寸大小。
️ 高性能: 针对M1时间框架进行了优化,延迟最小化。
️ 设置简单: 直观的参数使使用顾问尽可能舒适。 Ninja Trader EA的主要设置: 交易参数: StartHour/StartMinute: 交易开始时间(小时:分钟)。 EndHour/EndMinute: 交易结束时间。 MaxOrdersCount: 同时订单的最大数量。 MagicNumber: 订

Smart Risk Panel Smart Risk Panel (SRP) 是为手动交易者设计的交互式图表内交易管理面板。入场决定由您自己做出;SRP 提供一个有条理的工作区,用于下单、管理已有持仓和应用账户保护,而无需每次常规调整都返回 EA Inputs。 它的优势在于工作布局:下单、入场后的管理以及可选的 Telegram 命令参考分别放在清晰的标签中,Quick Actions 则始终靠近图表。 三个标签,一个工作区 GUI 分为 Trading Panel 、 Modify Orders 和 Telegram 。每个标签都有明确任务,因此在使用图表时,下单和交易管理都更容易跟踪。 主要控制与功能 Trading Panel — 使用价格、手数、数量和间距控制创建 BUY、SELL、BUY LIMIT、BUY STOP、SELL LIMIT 和 SELL STOP。 Modify Orders — 直接从图表管理 Trailing Stop、Break Even、Cascade TP 以及缺失 TP/SL 的相关操作。 Quick Actions — Close All、C
FREE
具有多时间框架支持、可自定义视觉信号和高度可配置警报系统的交易者动态指数(TDI)指标。
免费编程服务、更新及其他 TrueTL 产品请访问 MQL5 个人主页 。
非常感谢您的反馈和评价!
什么是 TDI? 交易者动态指数(TDI)是由 Dean Malone 开发的复合指标,将 RSI、应用于 RSI 的布林带以及 RSI 的两条移动平均线组合在单一显示中。它提供了市场动态的全面视角,包括动量、波动性和趋势方向。 该指标由五条线组成:RSI 价格线(原始 RSI)、交易信号线(RSI 的快速 MA)、RSI 信号线(RSI 的慢速 MA,也是波动率带的中线)、以及波动率带高点和低点(应用于 RSI 的布林带)。 功能特点: 五条独立样式的线:RSI 价格、交易信号、RSI 信号、VB 高点、VB 低点 带箭头标记和垂直线的视觉信号标记 具有可配置触发条件的三个独立信号缓冲区 信号检测选项:方向变化、水平线穿越、峰值/谷值 每个信号可配置警报功能(邮件、推送、声音、弹窗) 支持插值方法的多时间框架(MTF)功能 多种颜色模式(简单、方向型、水平线型) 支持 Expert Adv
FREE

The Supertrend indicator available on the MQL5 Market for MetaTrader 4 is an exceptional tool for traders seeking to identify prevailing trends in specific trading instruments. This indicator boasts two built-in indicators, Average True Range and Standard Deviation, allowing traders to choose the most suitable indicator based on their preferred trading strategy. Additionally, users can customize the period of these indicators and select the price (Close, High, Low, Open, Weighted) to which it s
FREE

.................................if you need pivot point s levels............................... ............................this is a daily pivot point level creator........................... ...it is for daily pivots and show levels at times period H4 , H1 , M30 , M15 ,M 5... .................................also shows levels for 3 last days.............................. ................can use it with other indicators and see important levels...............
FREE
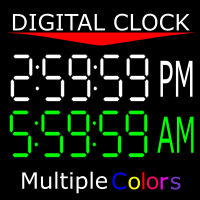
显示您所在服务器的时间以及您所在时区的当前时间。 12小时时钟格式(上午12:00:00至晚上11:59:59) 1-5分钟的图表以小时:分钟:秒格式表示 图表从15分钟到1个月以小时为单位:分钟格式“ 您还可以将时钟颜色更改为MT4 提供的任何颜色。 这是由谷歌翻译翻译。 我不会说这种语言。 //------------------------------------------------------------- 顯示您所在服務器的時間以及您所在時區的當前時間。 12小時時鐘格式(上午12:00:00至晚上11:59:59) 1-5分鐘的圖表以小時:分鐘:秒格式表示 圖表從15分鐘到1個月以小時為單位:分鐘格式“ 您還可以將時鐘顏色更改為MT4 提供的任何顏色。 這是由谷歌翻譯翻譯。 我不會說這種語言。
FREE

Auto Supply and Demand Oscillator is an indicator for MetaTrader 4 and MetaTrader 5 that detects supply and demand zones automatically and displays them as a single oscillator value at the bottom of the chart, instead of drawing rectangles directly on price.
Concept
Supply zones are price areas where strong selling created a sharp downward move away from a balance area. Demand zones are price areas where strong buying created a sharp upward move. Traditional implementations draw boxes on the
FREE

MultiLayer Signal — многоуровневый аналитический индикатор
Индикатор MultiLayer Signal объединяет сразу несколько подходов к анализу рынка: Уровни поддержки и сопротивления (на основе экстремумов за заданный период) Паттерны поглощения (бычьи и медвежьи) Сигналы на основе трендовой динамики Встроенный ZigZag с настраиваемой чувствительностью Многоуровневая EMA-фильтрация (микро-, макро- и быстрые/медленные скользящие)
️ Особенности: Возможность выбора режима: ️ “Закрытая свеча”
FREE
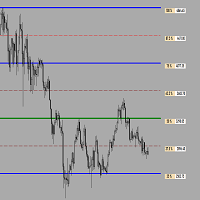
Индикатор рисует уровни Фибоначчи с выделенными Ценовыми метками.При установке индикатора на график необходимо создать трендовую линию с именем указанным в поле" Unique name of trend line to place fib on ". По умолчанию имя=" Unique name of trend line to place fib on" = "+" .В индикаторе можно заменить уровни фибоначчи по своему усмотрению.Также меняются цвет,стиль,толщина линий и т. д.
FREE

1. Core Components & Visual Logic While this version is customized, it retains the five foundational pillars of the Ichimoku system, designed to provide a "one-glance" view of equilibrium, trend, and momentum. The Kumo (Cloud): The shaded area (orange and blue boundaries) acts as the primary filter. In this screenshot, the price is trading above the cloud , which signifies a dominant bullish trend. Tenkan-sen (Blue Line): This is the fast-moving signal line. When it is above the slower line, mom
FREE

BoS and CHoCH Market Structure 直接在图表上标记市场结构:波段高点和低点、结构突破(BoS, Break of Structure)以及性质转变(CHoCH, Change of Character)。当某个波段点是其两侧所选数量K线中的最高点或最低点时,该波段被确认。当一根K线收盘突破最近的波段点时,指标会从该波段点到突破K线画一条线并加上标签:如果突破方向与当前趋势一致则为 BoS,与当前趋势相反则为 CHoCH。 功能 BoS(结构突破) - 收盘价沿当前趋势方向突破最近的波段点(趋势延续) CHoCH(性质转变) - 收盘价逆当前趋势方向突破最近的波段点(可能的方向转变) 以K线收盘价判断突破 - 仅用影线触及波段点不算突破 多空事件使用不同颜色 ;四种事件类型(看涨 BoS、看涨 CHoCH、看跌 BoS、看跌 CHoCH)均可单独开启或关闭 可调波段强度 - 每侧 2 到 50 根K线:数值越小事件越多,数值越大事件越少但更有意义 可选的突破K线上的 箭头 可选的波段上的 HH / HL / LH / LL 标记(每个波段与上一个同类波段比较)
FREE
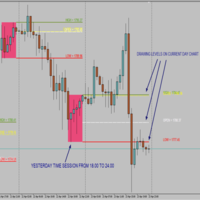
Time Session OPEN-HIGH-LOW-CLOSE This Indicator Will Draw Lines Of OHLC Levels Of Time Session Defined By User. It Will Plot Floating Lines On Current Day Chart. Time Session Can Of Current Day Or Previous Day. You Can Plot Multiple Session Lines By Giving Unique ID To Each Session. It Can Even Show Historical Levels Of Time Session Selected By User On Chart To Do Backdating Test. You Can Write Text To Describe The Lines.
FREE

Galaxy Force Analyzer - is an intelligent indicator for analyzing market volume and strength. It combines data from indicators like Force, OBV, MFI, AD, and others with advanced algorithms for acceleration and filtering to show the energy of price movement — the moment when a trend gains strength or begins to weaken. The indicator doesn’t just display volume — it measures impulse power, acceleration, and the speed of pressure changes between buyers and sellers.
Signals: Everything on the chart
FREE

StealthTrade Commander 是一款高级可视化交易面板和风险管理工具,专为手动交易者、剥头皮交易者(Scalpers)和自营交易公司(Prop-Firm)挑战者设计。 该工具可帮助您直接在图表上可视化执行交易,向经纪商隐藏您的止损(SL)和止盈(TP)水平,并严格控制您的每日回撤——这是通过和保留 Prop-Firm 资金账户的关键功能。 主要功能: Risk Guardian(自营交易保护器) 每日最大亏损限制: 如果您的每日回撤达到指定限制,自动平仓所有交易并锁定面板。 每日利润目标: 一旦达到您的每日目标,即平仓所有头寸以锁定利润。 精准手数计算: 根据您的可视化止损和预设风险(%、$ 或账户净值)计算确切的交易手数。 Stealth & Tactical Engine(隐身与战术引擎) 隐身模式: 向经纪商隐藏真实的 SL 和 TP 水平。面板在内部管理它们,并在价格穿过您的虚拟线时精准平仓。 幽灵入场(虚拟挂单): 放置隐形挂单,仅在价格触及您的线条时触发。 OCO 订单(选择性委托单): 突破交易的完美选择。当一个挂单被触发时,相反的挂单将自动删除。 价格磁
FREE
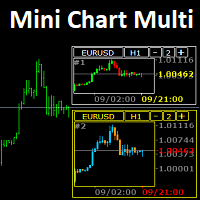
This indicator tool provides mini charts, with adjustable symbol/tf that can be dragged into place. Lightweight operation with multiple mini charts are supported.
Chart features: adjustable symbol and tf draggable multiple mini charts color styling and font sizing, foreground/background colors candle coloring candle styles; candles, bars, line, high-low channel
zoom in/out
FREE

This indicator is based on the ADX indicator and indicates the trend very easily.
You can customize the indicator to your needs: ADXPeriod ADXSignal_Level BarWidth CandleWith HeikenAshi
The Adx color candles indicator is fully FREE and compatible with the other part of the system; the Acc arrow >>>> https://www.mql5.com/en/market/product/33770 ENJOY and check out my other indicator: https://www.mql5.com/en/market/product/32111
FREE

This indicator calculates the volume profile and places labels that correspond to the VAH, VAL and POC levels, for each candle individually.
Indicator operation features The indicator works on the timeframes from M5 to MN, but it uses the history data of smaller periods: M1 - for periods from M5 to H1, M5 - for the H4 period, M30 - for the D1 period, H4 - for the W1 period, D1 - for the MN period. The color and location of the VAL, VAH and POC labels on the current candle are considered to be c
FREE
YOU CAN NOW DOWNLOAD FREE VERSIONS OF OUR PAID INDICATORS . IT'S OUR WAY OF GIVING BACK TO THE COMMUNITY ! >>> GO HERE TO DOWNLOAD Most of the time, market reversals / pull backs usually follow volume and price spikes thus these spikes could be the first indication of an exhaustion and possible reversal/pullback. High volume Turns is an indicator that scans the market for price and volume spikes around over-bought/over-sold market conditions. These spikes when spotted serves as the first indi
FREE

Overview Market Structure Analysis Indicator MT4 Structure Analysis Indicator automatically identifies Market Structure based on Smart Money Concepts (SMC). It clearly displays Break of Structure (BoS), Change of Character (CHoCH), Higher Highs, Higher Lows, Lower Highs, and Lower Lows in real-time. Key Features Automatic Market Structure Detection Break of Structure (BoS) - Price breaks previous structure in trend direction Change of Character (CHoCH) - Trend reversal sig

XAUUSD Trading EA (MT5) Get access to our fully automated Expert Advisor designed for consistent performance. Free Trial Available
Try the EA before you commit. Live Performance
Check real results via MyFXBook (link available in our Telegram channel https://t.me/xgoldscalper – pinned message). How to Get the EA
The original MT5 EA file is shared via Telegram.
Contact directly: https://t.me/SaravananL Available Models
Choose what suits you best: Subscription (Buy EA acc
FREE

Kumo Forge Pro 是一款适用于 MetaTrader 4 的非重绘自适应一目均衡表交易系统。它远超标准一目均衡表指标,新增了自适应波动率引擎(可根据实时市场状况自动缩放转换线、基准线和先行跨度 B 的周期)、0–110 分的 9 因子共振评分引擎、五种独立信号类型(TK 交叉、基准线反弹、云层边缘反弹、迟行线突破和云层突破)、动量脉冲引擎、具有三种止损模式和三个止盈级别的智能 TP/SL 系统,以及包含多时间周期对齐面板的 22–28 行综合大盘。每个信号仅在确认的 K 线收盘时触发,不会重绘。 查看 MT5 版本: Kumo Forge Pro MT5 查看更多产品: 全部产 品 欢迎访问我的主页查看实时示例和新工具,并发送好友申请,第一时间获取更新!
工作原理 自适应一目均衡表引擎 核心引擎通过可配置的回望窗口(默认:50 根 K 线)测量 ATR(14) 相对于其最高值和最低值,生成 0.0 至 1.0 的波动率比率。每个一目均衡表周期——转换线(9)、基准线(26)和先行跨度 B(52)——根据该比率和自适应强度参数(默认:0.4,即周期可拉伸 ±40%)进
FREE

SENSE 是一个自动系统,它将选定的 GANN 方法与分形计算相结合。系统会告诉我们在哪里开仓,在哪里平仓。无需再将时间浪费在复杂的计算上 - SENSE 会为您完成一切。只需安装指标即可。
基本原则:
当价格高于白线时,市场看涨
在白线上方买入,在白线下方止损 绿线为上涨目标 当价格低于白线时,市场看跌。
在白线下方卖出,在白线上方止损 红线为下行目标 双绿线或红线表示较强的区域。
为什么是 SENSE?
获利目标: SENSE 自动设置获利目标,帮助您最大限度地提高交易成功率。 自动适应: 该指标可自动重新计算任何时间框架,提供准确可靠的信号,无需手动调整。
非常适合剥头皮交易。
查看演示版!
SENSE 是一个自动系统,它将选定的 GANN 方法与分形计算相结合。系统会告诉我们在哪里开仓,在哪里平仓。无需再将时间浪费在复杂的计算上 - SENSE 会为您完成一切。只需安装指标即可。
基本原则:
当价格高于白线时,市场看涨
在白线上方买入,在白线下方止损 绿线为上涨目标 当价格低于白线时,市场看跌。
在白线下方卖出,在白线上方止损 红线为下行目标

"Candlesticks MTF 4" is an informational indicator that displays "Japanese Candlesticks" . The indicator analyzes and determines the opening and closing times of candles from higher time frames.
An algorithm has been developed for the "Candlesticks MTF 4" indicator that corrects the discrepancy between the opening and closing times of candles from higher time frames. For example, if the opening time of a candle on a weekly time frame is the 1st of the month, and on the smaller time frame this
FREE

Engulfing Detector MT4 by RWBTradeLab
A clean, non-repainting engulfing pattern detector for MetaTrader 4 that finds BOTH kinds of engulfing — the classic 2-candle Regular Engulfing and the extended multi-candle E-Regular Engulfing that most indicators miss — and separates the ones that swept liquidity first from the ones that did not. Every pattern is marked as a clear zone box on the chart, all from CLOSED candles only.
What This Indicator Does
The indicator detects 8 pattern types by CLOS
FREE
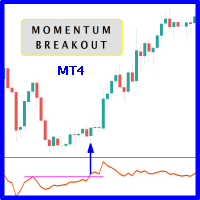
When prices breakout resistance levels are combined with momentum oscillator breaks out its historical resistance levels then probability emerges to record farther prices. It's strongly encouraged to confirm price breakout with oscillator breakout since they have comparable effects to price breaking support and resistance levels; surely, short trades will have the same perception. Concept is based on find swing levels which based on number of bars by each side to confirm peak or trough and in tu
FREE

Read detailed blog here: https://www.mql5.com/en/blogs/post/772837
Quick Feature List Three strategies in one indicator: Fakeout Reversal, FVG Breakout, Quartile Continuation Heatmap candle coloring using a Linear Regression channel on every bar Configurable anchor session window with automatic timezone offset support Candle color filter to accept or skip signals based on trend strength Signal strength separation: strong signals and weak signals drawn separately so you can style them differentl
FREE

VR Cub 这是获得高质量切入点的指标。该指标的开发是为了促进数学计算并简化对仓位入场点的搜索。多年来,该指标所针对的交易策略已被证明其有效性。交易策略的简单性是其巨大的优势,即使是新手交易者也能成功进行交易。 VR Cub 计算开仓点以及获利和止损目标水平,这显着提高了效率和易用性。查看使用以下策略进行交易的屏幕截图,了解简单的交易规则。 设置、设置文件、演示版本、说明、问题解决,可以从以下位置获取 [博客]
您可以在以下位置阅读或撰写评论 [关联]
版本为 [MetaTrader 5] 计算入场点的规则 开仓 要计算入场点,您需要将 VR Cub 工具从最后一个高点拉伸到最后一个低点。 如果第一个点在时间上早于第二个点,交易者等待柱线收于中线上方。 如果第一个点在时间上晚于第二个点,交易者等待柱线收于中线下方。 根据上述条件,严格在 柱线收盘 后建仓。 换句话说,如果我们在小时图上进行交易,那么从最高点到最低点的时间距离必须超过24小时,最高点和最低点之间的点数必须大于或等于平均价格变动每天。 维持和改变市场地位 可以有多个未平仓头寸;每个头寸都可以单独修改。 VR Cub

Bermaui Bands (BB) 是一种技术分析工具,有助于在价格波动和趋势价格变动之间进行过滤。这个指标背后的想法可以在接下来的步骤中解释: 将标准偏差计算为一个在 0 到 100 之间移动的振荡器。我将其命名为 Bermaui Deviation 百分比 (BD %)。 如果“BD %”接近于零,则波动率处于极端状态。此外,如果“BD %”接近 100,则波动性非常低。 高波动性意味着趋势市场的可能性很大,而低波动性意味着横向或区间市场。 中线是简单移动平均线 (SMA),因为标准偏差是根据 SMA 计算的。 将“BD %”添加到计算中具有相同条数的简单移动平均线,以获得上伯毛伊乐队。 从计算中具有相同条数的简单移动平均线中减去“BD %”以获得下伯毛伊乐队。 重要信息
Bermaui Bands 用户手册: https://www.mql5.com/en/blogs/post/718688 Bermaui Bands Expert Advisor 示例 : https://www.mql5.com/en/blogs/post/731143
如何使用它 使用 Bermaui

手动交易面板 EA MT4 是您可以找到的最简单易用的 MT4 交易面板。它的所有选项和功能都集中在一个表面上,无需打开额外的窗户或面板。它是一个订单管理、风险计算器、部分关闭和帐户保护实用程序,都在一个极其方便的界面中使用!
通过使用 手动交易面板 EA MT4 ,您可以比传统的手动交易方法更快、更准确地进行多次交易,这让您有更多时间和更清晰的头脑专注于您的交易决策。
账户保护是我们的首要任务,因此 手动交易面板 EA MT4 也是一个很好的账户保护实用程序,它可以在账户止盈或止损后关闭所有未平仓交易、删除所有挂单并关闭所有附加有任何 EA 的终端图表已达到亏损净额。这在盈利情况下非常方便,当您的资产低于您想要的止损水平时,可以避免您的交易账户进一步亏损。 提示: 您可以在您的模拟账户中下载并试用 手动交易面板 EA MT4 模拟版: 这里 将下载的免费演示文件粘贴到您的 MT4 >> 文件 >> 打开数据文件夹 >> MQL4 >> 专家文件夹并重新启动您的终端。 免费演示版本每次可在 4 小时内发挥全部功能,仅限演示帐户。 要重置试用期,请转至 MT4 >> 工具 >>

Introduction To Time Box Indicator Time Box Indicator is a must have indicator for any trader. It will display daily, weekly and Monthly box according to your preferences. Yet, you can extend any important price levels in your chart automatically. You can use them as the significant support and resistance levels. It is very simple but effective tool for your trading.
Graphic Setting Use White Chart Line Style for Current Open price
Daily Setting Update Timeframe for daily box Number of days to
FREE

Did You Have A Profitable Trade But Suddenly Reversed? In a solid strategy, exiting a trade is equally important as entering.
Exit EDGE helps maximize your current trade profit and avoid turning winning trades to losers.
Never Miss An Exit Signal Again
Monitor all pairs and timeframes in just 1 chart www.mql5.com/en/blogs/post/726558
How To Trade You can close your open trades as soon as you receive a signal
Close your Buy orders if you receive an Exit Buy Signal. Close your Sell orders if
This simple indicator paints with a darker color on the volume bar when the quantity traded is above the average of select number of periods of the volume itself, highlighting the moments when there was a large volume of deals above the average. It is also possible to use a configuration of four colors where the color tone shows a candle volume strength. The indicator defaults to the simple average of 20 periods, but it is possible to change to other types of averages and periods. If you like t
FREE

SX Trend Impulse Channels is a precisely designed trend-following system that represents trend development through distinct, volatility-adjusted steps. Instead of relying on traditional slope-based methods, it employs a structured step mechanism that only advances when price action conclusively confirms momentum via an ATR-based trigger.
This indicator is well suited for traders who favor structured, stair-step trend progression over smooth, continuous curves. It delivers clear momentum-based
FREE

"VirtualDealer" EA is a multitasking solution that uses advanced order management functions to automate and optimize FX trading. This latest version 3.1 implements a smart trading strategy that seamlessly switches between virtual and real orders while responding to market fluctuations. In particular, the appeal of this EA is its "virtual order management function." Using virtual orders, it simulates market trends in advance and finds entry points. Only if the market moves as planned, these virt
FREE

Omnia Gold Pro MT4 适用于 MetaTrader 4 的专业 XAUUSD / Gold 黄金交易EA ,具备智能趋势网格逻辑、基于 ATR 的自适应间距、点差保护、回撤控制、保证金安全检查、交易时段过滤以及图表实时监控功能。 Omnia Gold Pro MT4 是一款专注于黄金交易的自动交易机器人,适合希望在 XAUUSD 上进行纪律化交易的交易者。它结合了结构化市场确认、受控网格执行和内置风险保护。 该EA专门为 XAUUSD / GOLD 设计。它重点关注黄金波动性、趋势行为、点差条件、交易时段、保证金安全和订单篮子管理,而不是随机交易所有市场。 当前发布价格可能只面向有限数量的早期买家。随着用户数量增加,产品价格可能进入下一个价格层级。产品仍会保持可用,但不一定继续保持相同的促销价格。 策略概述 Omnia Gold Pro MT4 使用结构化趋势网格方法,并通过内部过滤器在开仓前评估市场方向和交易质量。EA会检查趋势变化、ATR 波动率、点差、交易时段、保证金状态和风险限制,然后才允许交易活动。 该系统更注重交易质量,而不是过高的交易频率。当市场方向不清晰

EZT 趋势指标将向您显示趋势、回调和入场机会。 提供可选的过滤和所有类型的警报。 添加电子邮件和推送通知警报。 我们还在开发基于该指标的 EA,即将推出。
它是一个多功能指标,由两个颜色直方图和一条线组成。 它是趋势方向和强度的直观表示,您也可以在线上或直方图上多次发现背离。
该指标与自动参数设置配合良好。 这些是针对给定时间范围预先确定的,我们建议使用具有该设置的指标。 在手动模式下,您可以设置自己的参数。 这是一个多时间框架 (mtf) 指标。
该指标与我们的其他指标(例如 MTF rsi 或 MTF cci 或 MACD pro)组合起来效果很好。
交易工具的波动性越大,您寻找最佳入场机会的时间范围就越小。 始终考虑更高的时间范围方向!
为此,您应该使用更多指标实例。
输入 参数模式:可选择“手动参数”或预设的“自动参数”。 自动参数处于多时间范围模式。 示例:当您设置自动 H1 参数时:您可以看到从 H1 时间范围一直到 1 分钟的相同显示。 在此设置中,指标不会在更高的时间范围(例如 H4 或更大)上显示。 手动时间范围:当在第一个菜单中选择手动参数时,您

RSI TheTrendWave 是一个带有智能马丁格尔策略的双重 RSI,用于 MQL4 的专家顾问(EA)。它结合了基于 RSI 的趋势识别和风险管理策略,通过修改的马丁格尔系统减少回撤。以下是其工作原理: 双重 RSI 信号: 当短期 RSI 上穿长期 RSI 且两者都低于某个超卖阈值(例如 30)时,触发买入信号。 当短期 RSI 下穿长期 RSI 且两者都高于某个超买阈值(例如 70)时,触发卖出信号。 EA 在所有货币对上使用相同的双重 RSI 逻辑,基于每个货币对的超买和超卖条件识别买入和卖出机会。由于 EURUSD、GBPUSD 和 USDCAD 的流动性和波动性差异,EA 能有效地检测趋势和反转。 智能马丁格尔策略: 初始仓位 : 根据 RSI 信号开仓,初始手数较小。 马丁格尔倍增 : 如果交易方向与 EA 相反并达到某个亏损阈值,下一笔交易的手数将以受控方式增加(例如,倍数小于 2),而不是像传统的马丁格尔系统那样激进地加倍。 动态调整 : 倍增系数根据当前市场波动性和可用权益进行调整,以避免过度杠杆,帮助限制风险敞口。 盈利目标和退出 : EA 在达到预定的盈利
FREE

The QQE indicator is a momentum-based indicator used to identify trends and sideways. The Qualitative Quantitative Estimate (QQE) indicator works like a smoothed version of the popular Relative Strength Index (RSI) indicator. QQE extends the RSI by adding two volatility-based trailing stops. This indicator is converted from Trading View QQE MOD by Mihkel00 to be used in MT4 Version.

Cloud Stair is an Indicator has 2 Cloud (Up Trend and Down Trend). Cloud will turn Red when trend go down. Cloud will turn Blue when trend go up. You can use this indicator as a Support and Resistance level. Trend very strong when there are no opposite side. Open Buy position when the indicator show blue cloud and no red cloud. Open Sell position when the indicator show red cloud and no blue cloud.

Expert for portfolio of basic set long term strategies. You can choose for your AOS trading two ways – first way is purchased for EA with grid, martingale and other similar dangerous strategies. This EAs work great and have very profitable results – days, weeks, maybe months, years?.. Until they didn’t blow up your account. The second way is to use EAs based on real trading strategies and logical patterns. On MQL Market are very few of these strategies. The risk of trading with these EAs

Automatic trading robot, created with the latest algorithmic trading and money management technologies. Combines three trading classes at the same time: Trending Hedging Multicurrency Your capital is protected by stop orders and management of the total trading position on the account. Works on any trading instruments. Note. Due to the peculiarities of the MT4 terminal, it is impossible to test multi-currency advisors in the tester. Only Real or Demo account. Loyal rental conditions and discounts
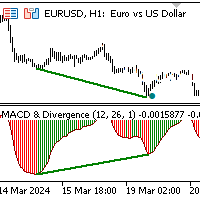
The indicator identifies divergence by analyzing the slopes of lines connecting price and MACD histogram peaks or troughs. Bullish Divergence (Convergence): Occurs when the lines connecting MACD troughs and corresponding price troughs have opposite slopes and are converging. Bearish Divergence: Occurs when the lines connecting MACD peaks and corresponding price peaks have opposite slopes and are diverging. When a divergence signal is detected, the indicator marks the chart with dots at the pric

Stochastic Scanner is a multi symbol multi timeframe Stochastic dashboard that monitors the indicator for price entering and exiting overbought and oversold in up to 28 symbols and 9 timeframes.
Download Demo here (Scans only M1 and W1) Settings description here MT5 version here
Stochastic Scanner features: Signals price entering and exiting the overbought and oversold zones. Monitors up to 28 customizable instruments and 9 timeframes at the same time. You can choose between 3 alert mode

如果您喜欢这款免费工具,请留下五星好评!非常感谢 :) “风险管理助手”专家顾问系列是一套全面的工具,旨在通过有效管理各种市场条件下的风险来增强交易策略。该系列包含三个关键组件:平均交易、切换交易和对冲交易专家顾问,每个组件都针对不同的交易场景提供独特的优势。
此 EA 是基于市场上标准风险管理策略的开发版本。
https://www.mql5.com/en/blogs/post/756961
1. “均线助手”EA: MT4: https://www.mql5.com/en/market/product/115468 MT5: https://www.mql5.com/en/market/product/115469 2. “切换助手”EA: MT4: https://www.mql5.com/en/market/product/115478 MT5: https://www.mql5.com/en/market/product/115428 3. “对冲助手”EA: MT4: https://www.mql5.com/en/market/product/115466 MT5
FREE
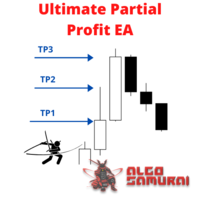
This EA Utility delivers a robust solution for managing an unlimited array of open orders, both manual and automated. It enables customizable partial profit levels utilizing metrics such as pips, ratios, ATR (Average True Range), and profit amounts for precise trade management. The utility features an advanced on-screen display, offering clear visualization of all orders and their profit levels to enhance strategic decision-making and control. To evaluate its performance and interface, the EA s

CandleCrusherX Scalping EA analyses the market situation on volume and strong price movement within internal Timeframe. It works on all major forex pairs and Timeframes (M5 or M15 recommend). The EA has integrated dynamic Take Profit, this means, if you reach your defined TP it gives you the chance to follow on the Trend by dynamic TP & SL and extend your profits. Also a News Filter function is integrated, to prevent miss trades on News events. Dynamic Lot calculation integrated On Request we ad
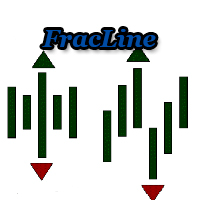
The "FracLine" Expert Advisor uses trend lines based on fractals to open a position.
It works at closing prices, so optimization and testing can be performed at open prices. The time frame and tool can be anything. Definition of a fractal for this EA:
a fractal is a 9-candlestick pattern, where the central one is the maximum (in an upward movement) or minimum (in a downward movement) in this pattern.
A prerequisite is that to the left and right of the high (fractal candle) there must be at l
FREE
MetaTrader市场是 出售自动交易和技术指标的最好地方。
您只需要以一个有吸引力的设计和良好的描述为MetaTrader平台开发应用程序。我们将为您解释如何在市场发布您的产品将它提供给数以百万计的MetaTrader用户。
