Fan sayfamıza katılın

Multitimeframe indicators - MetaTrader 4 için gösterge

Forex ticareti ile ilgileniyorsanız, size hazır ürünler sunabilir veya stratejinize göre sizin için bir robot yazabilirim.
sitem
https://cmillion.ru
- Görüntülemeler:
- 28637
- Derecelendirme:
- Yayınlandı:
- Güncellendi:
-
 Alım-satım fırsatlarını kaçırıyorsunuz:
- Ücretsiz alım-satım uygulamaları
- İşlem kopyalama için 8.000'den fazla sinyal
- Finansal piyasaları keşfetmek için ekonomik haberler
Kayıt Giriş yapWeb sitesi politikasını ve kullanım şartlarını kabul edersiniz
Hesabınız yoksa, lütfen kaydolun -
 Bu koda dayalı bir robota veya göstergeye mi ihtiyacınız var? Freelance üzerinden sipariş edin
Freelance'e git
Bu koda dayalı bir robota veya göstergeye mi ihtiyacınız var? Freelance üzerinden sipariş edin
Freelance'e git
Description:
It's very often there isn't enough time to check all chart timeframes and look for the best entry point, these indicators can be set in one window and not switching screens to see the whole picture together.
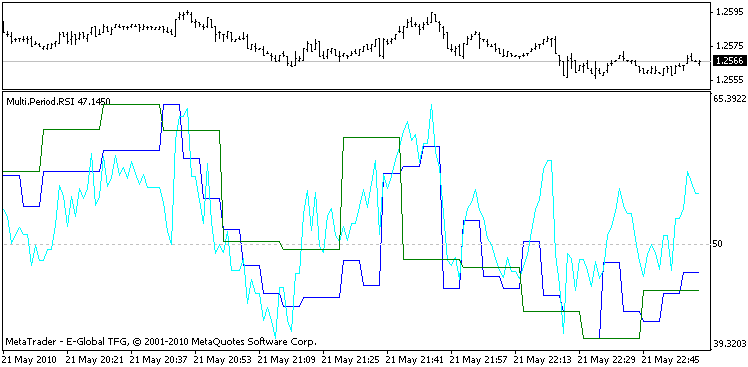
RSI:
Stoxastic:
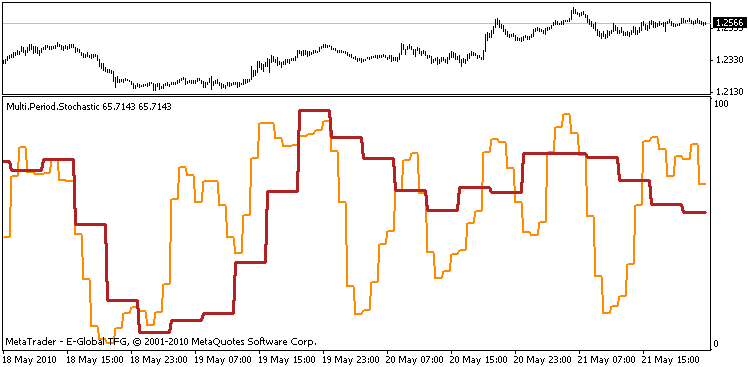
The Stoxastic and RSI indicators are extremely simple, they show the values of relevant indicators with a candle a higher period. The details can be examined further using indicators MA.
Variables:
Total variable for all three indicators timeframe. The valyes are:
- timeframe = January 1 minute
- timeframe = May 5 minutes
- timeframe = 15 15 minutes
- timeframe = 30 30 minutes
- timeframe = 60 1:00
- timeframe = 240 4:00
- timeframe = 1440 1 day
- timeframe = 10080 1 week
- timeframe = 43200 1 month
For the case if there is a mistake in minutes, the indicator itself correct, and set the desired period. For all other variables as well as in the original versions of the indicators.
Now back to MA.
Partly applied_price it can serve for many functions.
- applied_price = 0 PRICE_CLOSE
- applied_price = 1 PRICE_OPEN
- applied_price = 2 PRICE_HIGH
- applied_price = 3 PRICE_LOW
- applied_price = 4 (high + low) / 2
- applied_price = 5 (high + low + close) / 3
- applied_price = 6 (high + low + close + close) / 4
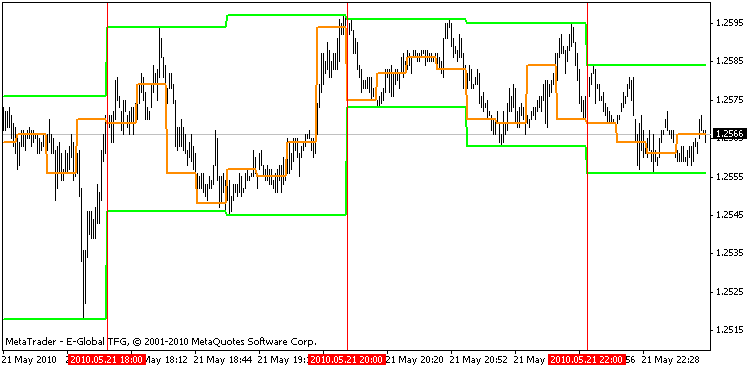
For example, if you put in the window with a period of less than H1 immediately 3 indicators with the following parameters:
- PeriodMA = 1; applied_price = 2; timeframe = 60;
- PeriodMA = a; applied_price = 3; timeframe = 1960;
- PeriodMA = 1; applied_price = 0; timeframe = 15;
So we get an indicator showing the minimum and maximum hourly candles (green lines 1,2) and (Orange 3) shows the opening price of each 15-minute candles.
By varying the parameters, you can create right combination of indicators that can you.
Each indicator has two buffers. One is the main, which shows the value steps and support, a smoothing step.
The possible applications of these indicators isn't restricted the ones described.
MetaQuotes Ltd tarafından Rusçadan çevrilmiştir.
Orijinal kod: https://www.mql5.com/ru/code/9680
 10 Point3 enhanced v003
Base on 10 point , V003 But have been enhanced
 Avg_02b
Calculating the difference between the High and Low price to see the price range for every hour.
10 Point 3 v004 enhanced
10 Point 3 v004 enhanced Expert Advisor
Drag and Drop Support and Resistance lines with color differentiation
Draws several resistance and support lines differentiating the color of both types of line by Drag and Drop a simple script.