Alım-satım robotlarını ücretsiz olarak nasıl indirebileceğinizi izleyin
Bizi Facebook üzerinde bulun!
Fan sayfamıza katılın
Fan sayfamıza katılın
Kodu beğendiniz mi? MetaTrader 5 terminalinde deneyin

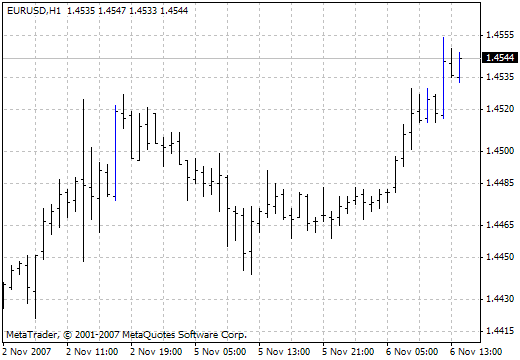
Three Line Break - MetaTrader 4 için gösterge
- Görüntülemeler:
- 29576
- Derecelendirme:
- Yayınlandı:
-
 Alım-satım fırsatlarını kaçırıyorsunuz:
- Ücretsiz alım-satım uygulamaları
- İşlem kopyalama için 8.000'den fazla sinyal
- Finansal piyasaları keşfetmek için ekonomik haberler
Kayıt Giriş yapWeb sitesi politikasını ve kullanım şartlarını kabul edersiniz
Hesabınız yoksa, lütfen kaydolun -
 Bu koda dayalı bir robota veya göstergeye mi ihtiyacınız var? Freelance üzerinden sipariş edin
Freelance'e git
Bu koda dayalı bir robota veya göstergeye mi ihtiyacınız var? Freelance üzerinden sipariş edin
Freelance'e git
Author: Equipe Forex
This method has been described by Steve Nison in the book "Japanese Candlestick Charting Techniques". "Three-Line Break" combines the qualities of the "tic-tac-toe" charts and the standard line charts or bars.
The literature notes the advantages of future price movement prediction methods based on the calculation of the duration of pricing models.
This chart allows to easily eliminate the noise and to efficiently place such points, support and resistance levels, graphical shapes. It should be noted that the appearance of graphical shapes on a usual chart differs from those on a Three-Line Break chat, caused by the non-linearity of the time scale.
In a sense, this type of charts converts the price movement into a range of cyclical fluctuations.
MetaQuotes Ltd tarafından Rusçadan çevrilmiştir.
Orijinal kod: https://www.mql5.com/ru/code/7580
StochasticOnPriceVSwma
A version of the Stochastic located right in the price window.
Standard Deviation Channels
The Standard Deviation Channel is plotted on the basis of the Linear Regression Trend.
 Zs1
Zs1
I came across an expert that was discussed many times on the forum.
Wss_trader
The Wss_trader EA. People recommend setting the trading hours to 7-17, trailing to 60, metrics to 36 and to look back to 2 months.