Fan sayfamıza katılın

- Görüntülemeler:
- 91
- Yayınlandı:
- Güncellendi:
-
 Alım-satım fırsatlarını kaçırıyorsunuz:
- Ücretsiz alım-satım uygulamaları
- İşlem kopyalama için 8.000'den fazla sinyal
- Finansal piyasaları keşfetmek için ekonomik haberler
Kayıt Giriş yapWeb sitesi politikasını ve kullanım şartlarını kabul edersiniz
Hesabınız yoksa, lütfen kaydolun -
 Bu koda dayalı bir robota veya göstergeye mi ihtiyacınız var? Freelance üzerinden sipariş edin
Freelance'e git
Bu koda dayalı bir robota veya göstergeye mi ihtiyacınız var? Freelance üzerinden sipariş edin
Freelance'e git
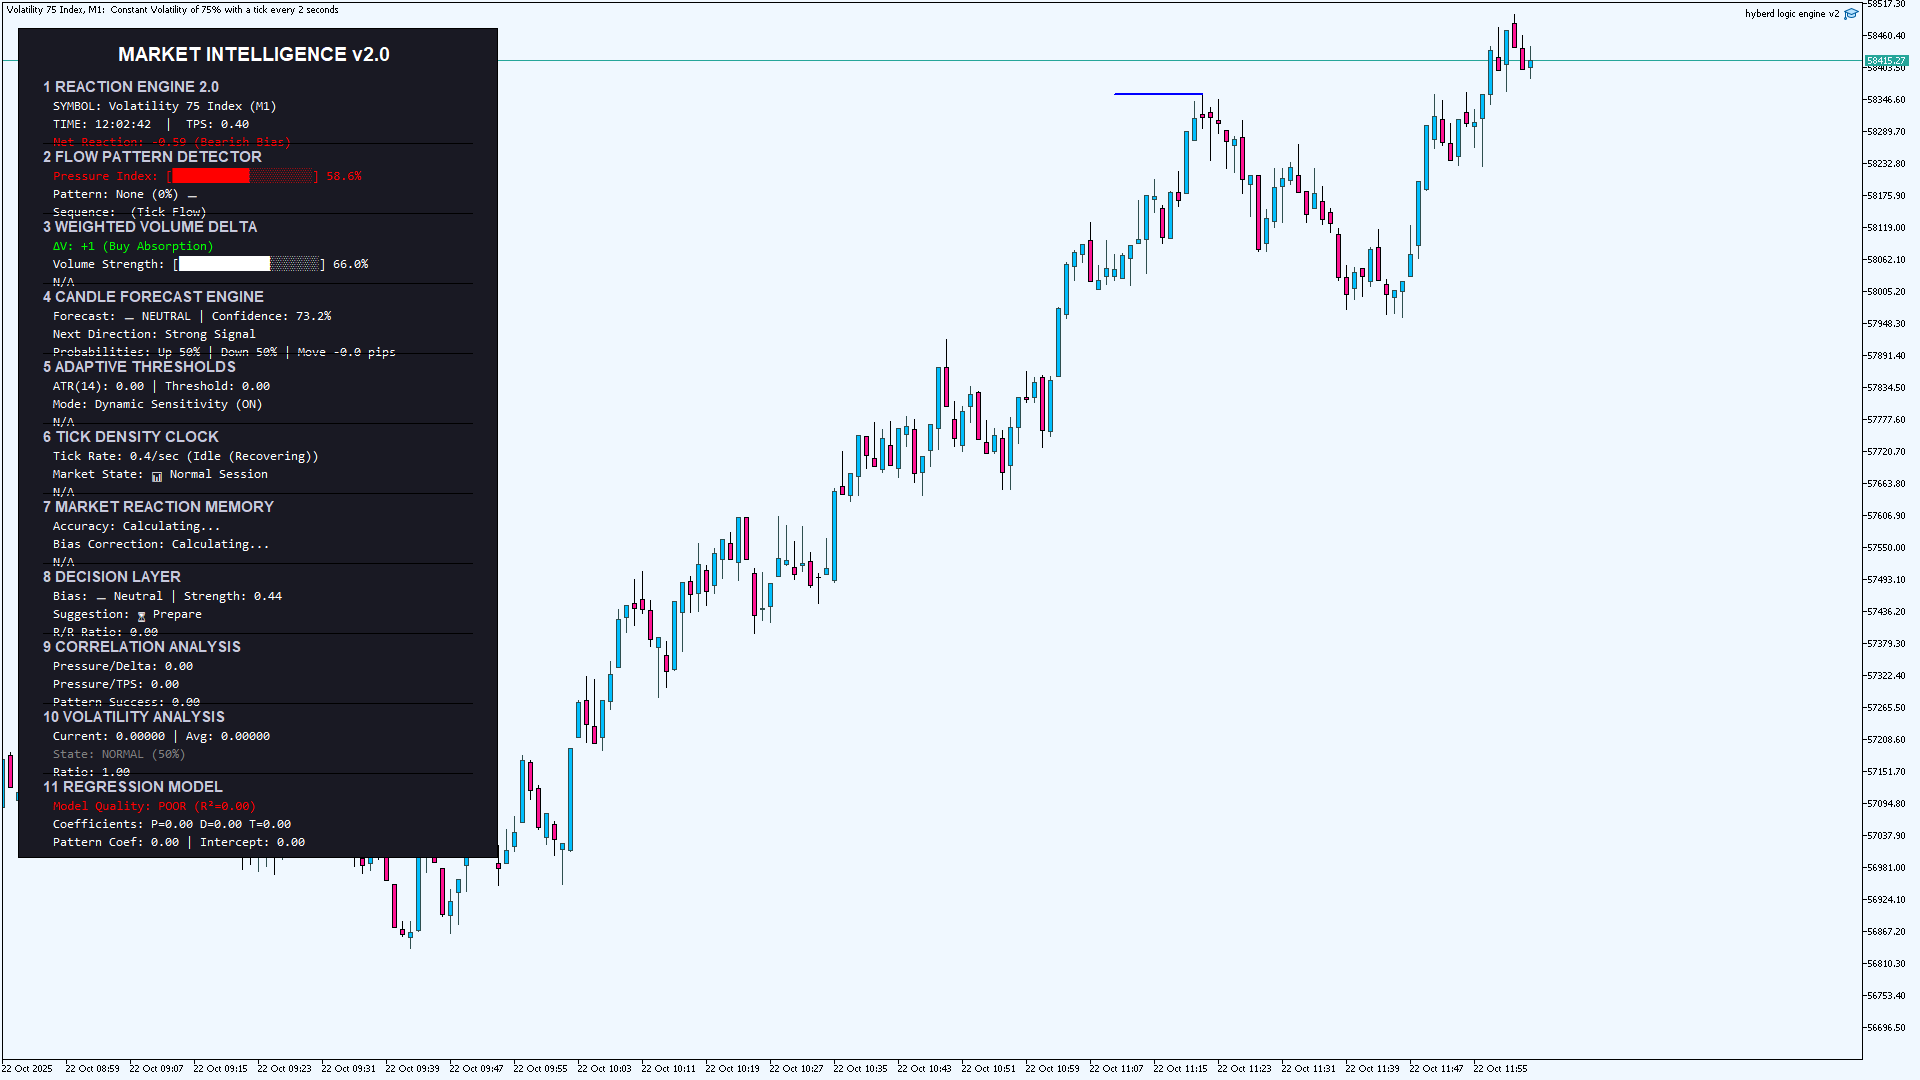
Understanding the EA's Core Components
The Master Intelligence EA analyzes market data through 8+ modules, each providing unique insights. Here's how to interpret and use each component for trading:
1. Reaction Engine 2.0
What it measures: Market pressure based on price movements, volume, and tick velocity
How to interpret:
- Pressure Index (-1 to +1):
- Above 0.6: Strong bullish pressure
- 0.2 to 0.6: Moderate bullish pressure
- -0.2 to 0.2: Neutral pressure
- -0.6 to -0.2: Moderate bearish pressure
- Below -0.6: Strong bearish pressure
Trading strategy:
- Look for entry opportunities when pressure exceeds ±0.6
- Consider scaling positions when pressure moves from moderate to strong
- Use pressure reversals (e.g., from strong bullish to neutral) as potential exit signals
2. Flow Pattern Detector
What it measures: Recurring tick patterns that historically precede price movements
Key patterns and their implications:
- Buyer Re-entry: Bullish continuation pattern after brief pullback
- Seller Exhaustion: Potential bullish reversal after downtrend
- Spike-Bounce: High volatility pattern often followed by reversal
- Seller Re-entry: Bearish continuation pattern after brief rally
- Buyer Exhaustion: Potential bearish reversal after uptrend
Trading strategy:
- High confidence patterns (>70%) offer the best trade opportunities
- Combine pattern direction with pressure index for confirmation
- Patterns with historical success rates above 65% are most reliable
- Wait for pattern completion before entering (don't anticipate)
3. Weighted Volume Delta
What it measures: The balance between buying and selling volume, with weighting applied
How to interpret:
- Positive values: More buying volume than selling
- Negative values: More selling volume than buying
- Extreme readings (>±2.0 normalized) suggest strong momentum
Trading strategy:
- Use delta to confirm pressure readings (confluence increases reliability)
- Divergence between price and delta can signal potential reversals
- Sudden delta spikes often precede significant price movements
- Combine with pattern recognition for high-probability setups
4. Candle Forecast Engine
What it measures: Predicts next candle direction and magnitude using multiple factors
Key metrics:
- Forecast Score: Overall prediction strength (-1 to +1)
- Direction: UP, DOWN, or NEUTRAL
- Confidence: Probability percentage of forecast accuracy
- Probabilities: Specific chances of up/down movement
- Expected Move: Anticipated price movement in pips
Trading strategy:
- Only consider trades with confidence above 70%
- Higher expected moves (in pips) offer better risk/reward ratios
- Use probability differentials (e.g., 75% up vs. 25% down) to determine position sizing
- Combine forecast with current market state (avoid trading against strong trends)
5. Adaptive Thresholds
What it measures: Dynamic entry/exit levels based on market volatility
How to interpret:
- Adjusts automatically based on ATR and tick density
- Higher in volatile markets, lower in quiet markets
- Scales with market conditions to maintain consistent risk
Trading strategy:
- Use dynamic thresholds for stop-loss placement
- Adjust position sizes based on threshold width
- Wider thresholds in volatile markets require smaller positions
- Tighter thresholds in quiet markets allow for larger positions
6. Tick Density Clock
What it measures: Market activity level through tick frequency analysis
States:
- High: Accelerating activity, often precedes significant moves
- Active: Normal market activity
- Idle: Low activity, often during quiet sessions
Trading strategy:
- High activity periods offer better trading opportunities
- Avoid entering new positions during idle periods
- Use transitions between states as timing indicators
- High activity with directional bias is particularly powerful
7. Market Reaction Memory
What it measures: Historical accuracy of forecasts and patterns
Key metrics:
- Accuracy: Percentage of correct forecasts
- Bias Correction: Systematic forecasting errors to account for
Trading strategy:
- Higher accuracy indicates the EA is performing well for current conditions
- Use bias correction to adjust expectations (e.g., if bias is +10%, reduce bullish expectations)
- Track accuracy over time to identify optimal market conditions for this EA
- Consider reducing position size during periods of declining accuracy
8. Decision Layer
What it measures: Final trading recommendation based on all modules
Outputs:
- Bias: Overall market direction (Bullish, Bearish, Neutral)
- Strength: Conviction level of the bias
- Action: Specific recommendation (Enter Long, Enter Short, Wait, Prepare)
- Risk/Reward Ratio: Potential profit vs. loss for recommended trade
Trading strategy:
- Follow "Enter Long/Short" signals when confidence is high
- Use "Prepare" signals to get ready for potential entries
- "Wait" signals suggest avoiding new positions
- Only take trades with risk/reward ratios above 1.5
Practical Trading Approach
1. Setup and Configuration
For optimal performance:
- Use on major currency pairs (EUR/USD, GBP/USD, USD/JPY)
- Best timeframes: M15, M30, H1
- Ensure sufficient tick data (let EA run for at least 24 hours before trading)
- Enable data persistence for learning capabilities
2. Pre-Trade Analysis
Before entering any trade:
- Check overall market bias from Decision Layer
- Verify confidence is above 70%
- Confirm risk/reward ratio exceeds 1.5
- Look for confluence between at least 3 modules
- Check market state (avoid trading during idle periods)
3. Entry Criteria
Enter long positions when:
- Decision Layer: "Enter Long"
- Pressure Index > 0.2
- Forecast Direction: UP with confidence > 70%
- Pattern: Buyer Re-entry or Seller Exhaustion
- Weighted Delta: Positive or turning positive
- Risk/Reward Ratio > 1.5
Enter short positions when:
- Decision Layer: "Enter Short"
- Pressure Index < -0.2
- Forecast Direction: DOWN with confidence > 70%
- Pattern: Seller Re-entry or Buyer Exhaustion
- Weighted Delta: Negative or turning negative
- Risk/Reward Ratio > 1.5
4. Exit Strategy
Take profit when:
- Forecast confidence drops below 50%
- Pressure Index reverses direction significantly
- Pattern completion occurs
- Risk/Reward ratio target reached
Stop loss placement:
- Use dynamic threshold as baseline
- Adjust based on volatility (wider in high volatility)
- Consider recent swing highs/lows
- Never risk more than 2% per trade
5. Position Sizing
Conservative approach:
- 1% of account per trade
- Reduce to 0.5% during high volatility
- Increase to 1.5% only when confidence > 80% and multiple confirmations
Normal approach:
- 2% of account per trade
- Adjust based on risk/reward ratio
- Scale in when multiple signals align
Aggressive approach:
- 3% of account per trade
- Only when confidence > 85% and all modules align
- Use trailing stops to protect profits
6. Advanced Strategies
Confluence Trading:
- Look for alignment between Pressure Index, Delta, and Forecast
- Higher confluence = higher probability trades
- Use pattern recognition as final confirmation
Divergence Trading:
- Price making new highs but Pressure Index declining = potential reversal
- Price making new lows but Delta becoming less negative = potential reversal
- Forecast direction opposing price trend with high confidence = strong reversal signal
Volatility Scaling:
- In high volatility periods, focus on breakout strategies
- In low volatility periods, focus on range-bound strategies
- Adjust position sizes according to volatility metrics
7. Performance Monitoring
Track these metrics:
- Overall accuracy rate (target: >65%)
- Average risk/reward ratio (target: >1.5)
- Win/loss ratio (target: >1.2)
- Maximum drawdown (keep below 15%)
- Profit factor (target: >1.5)
Optimization routine:
- Review performance weekly
- Adjust parameters based on market conditions
- Focus on patterns with highest success rates
- Consider time-of-day performance patterns
Common Mistakes to Avoid
- Overtrading: Don't take every signal—wait for high-quality setups
- Ignoring risk management: Always use stop-losses and proper position sizing
- Fighting the trend: Use the EA to identify trend direction, don't trade against it
- Confirmation bias: Don't cherry-pick signals that agree with your opinion
- Poor timing: Wait for pattern completion before entering
- Ignoring volatility: Adjust approach based on current market conditions
- Over-optimizing: Don't constantly change parameters based on short-term results
Conclusion
The Master Intelligence EA provides comprehensive market analysis, but success ultimately depends on proper interpretation and disciplined execution. Focus on high-confidence setups with multiple confirmations, maintain strict risk management, and continuously monitor performance. Remember that no system is perfect—losses are normal, but with this EA's analytical capabilities and proper application, you can achieve consistent trading results over time.
 Simple Expert Advisor based on WPR, Bollinger Bands and ATR indicators
A simple strategy based on the signals of two indicators: Williams' Percent Range (WPR) and Bollinger Bands (BB). A position is opened only when the signals of both indicators coincide.
 Bollinger Bands Squeeze
It signals a period of low market volatility that is about to end, foreshadowing a significant price move.
ExpPinBar - Expert Advisor for Pin Bar Price Action patterns
Expert Advisor based on iPinBar Pin Bar Finder + several different trailing indicators
ATR without iATR() with smoothing Wilder by William210.mq5
The goal is to show a code that shows the calculation of the ATR with Wilder smoothing